

Key Insights
The Middle East and Africa (MEA) alcoholic drinks packaging market is poised for robust expansion, projecting a Compound Annual Growth Rate (CAGR) of 5.8%. This growth is propelled by rising disposable incomes and an expanding middle class across the region, driving increased alcohol consumption and, consequently, demand for packaging solutions. The rising popularity of premium alcoholic beverages, including wines and spirits, further fuels the need for sophisticated and visually appealing packaging. Tourism also contributes significantly to the alcoholic beverage sector in key MEA nations like the UAE, South Africa, and Egypt. Emerging trends include a strong preference for convenient and sustainable packaging, such as lightweight and recyclable materials. However, stringent government regulations concerning alcohol content and labeling, alongside volatile raw material prices for glass and metal, present notable market challenges. The market is segmented with glass bottles dominating wine and spirits packaging, while metal cans are prevalent for beer. Plastic bottles, though less common for premium products, are gaining traction for value-oriented alcoholic beverages.
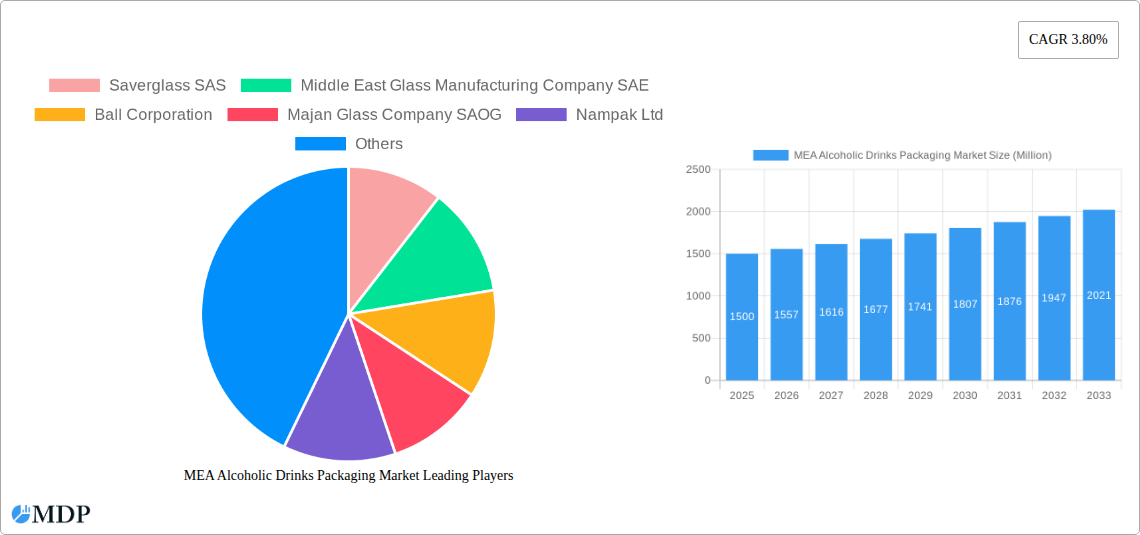
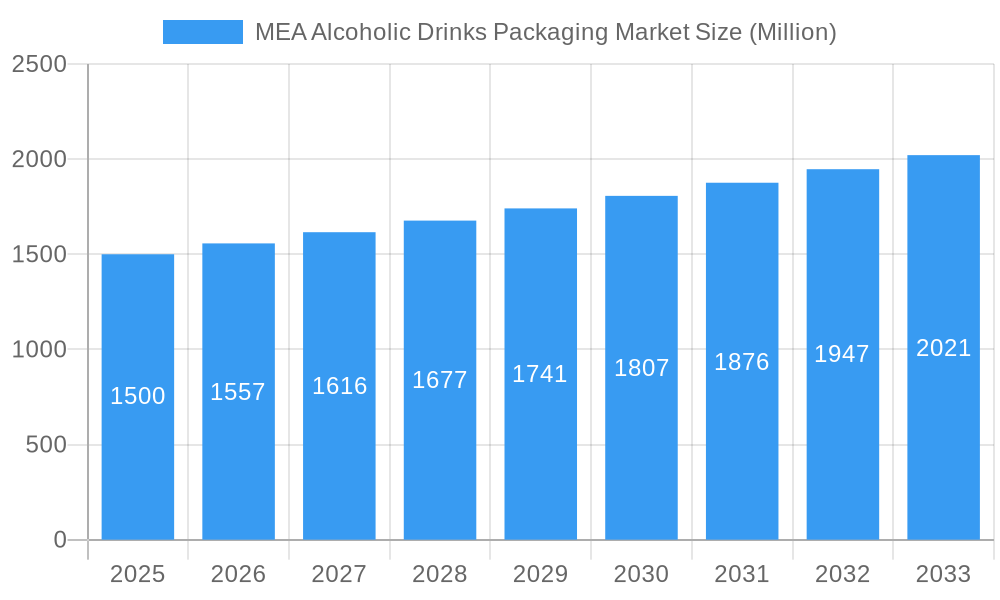
MEA Alcoholic Drinks Packaging Market Market Size (In Billion)
The MEA alcoholic drinks packaging market features a dynamic competitive landscape, encompassing both established multinational corporations and agile regional players. Leading global packaging firms are actively expanding their footprint in the MEA region to capitalize on this burgeoning market. Investments in advanced packaging technologies aimed at enhancing product shelf life and consumer appeal are also on the rise. Regional companies leverage intimate local market understanding and well-established distribution channels, while international players contribute advanced technology and extensive market access. Future market dynamics indicate a trend towards increased consolidation through organic growth and strategic mergers and acquisitions. The forecast period highlights significant growth opportunities, particularly in emerging economies demonstrating rising per-capita spending on alcoholic beverages, underscoring the demand for innovative and adaptable packaging solutions.
MEA Alcoholic Drinks Packaging Market Company Market Share
MEA Alcoholic Drinks Packaging Market: A Comprehensive Report (2019-2033)
This comprehensive report provides a detailed analysis of the Middle East and Africa (MEA) alcoholic drinks packaging market, offering invaluable insights for industry stakeholders. Covering the period from 2019 to 2033, with a focus on 2025, this report analyzes market dynamics, trends, leading players, and future opportunities. The market is segmented by primary material (glass, metal, plastic, paper), alcoholic product (wine, spirits, beer, others), product type (bottles, cans, etc.), and country (UAE, South Africa, Egypt, Turkey, Rest of MEA). Expect detailed forecasts, CAGR calculations, and in-depth competitive landscaping. This report is crucial for strategic decision-making in this dynamic and growing market. The total market value is predicted to reach xx Million by 2033.
MEA Alcoholic Drinks Packaging Market Market Dynamics & Concentration
The MEA alcoholic drinks packaging market is characterized by a moderately concentrated landscape, with several major players holding significant market share. Market concentration is influenced by factors including economies of scale, technological capabilities, and established distribution networks. The market share of the top five players is estimated to be around xx%. Innovation drives market growth, with a focus on sustainability, lightweighting, and enhanced functionality. Stringent regulatory frameworks concerning material usage, labeling, and recyclability influence packaging choices. The rise of eco-conscious consumers fuels the demand for sustainable packaging alternatives, creating opportunities for innovative solutions. Product substitution is evident, with materials like aluminum gaining traction over traditional glass and plastic. Furthermore, trends in alcoholic beverage consumption—such as the growing popularity of craft beers and premium spirits—drive demand for specialized packaging. The past five years have witnessed xx M&A deals, indicating increased consolidation within the market.
- Key Drivers: Innovation in materials, sustainability concerns, changing consumer preferences.
- Key Restraints: Regulatory hurdles, fluctuating raw material prices, and supply chain complexities.
- M&A Activity: xx deals in the last five years, indicating consolidation trends.
MEA Alcoholic Drinks Packaging Market Industry Trends & Analysis
The MEA alcoholic drinks packaging market exhibits robust growth, driven by rising disposable incomes, increasing alcohol consumption, and expanding tourism. The CAGR for the period 2025-2033 is projected to be xx%. Technological advancements, particularly in lightweighting and sustainable materials, are transforming the market. Consumer preferences for premium packaging and convenient formats are reshaping product offerings. The market is witnessing increased competition, with new entrants and established players vying for market share. Market penetration of sustainable packaging is gradually increasing, driven by environmental concerns and consumer demand. This shift is visible across all segments, with a growing preference for recyclable and compostable materials. The increasing demand for premium alcoholic beverages is stimulating the demand for high-quality packaging solutions. This includes innovative closures, designs and specialized materials such as glass and metal. The industry is adapting to the growing trend of e-commerce, with demand for packaging solutions that enhance product protection during shipping.
Leading Markets & Segments in MEA Alcoholic Drinks Packaging Market
The UAE and South Africa represent the leading markets within the MEA region, driven by robust economies and a significant alcohol consumption base. The glass segment holds the largest market share among primary materials, followed by metal. Spirits and beer represent the largest segments by alcoholic product type, while glass bottles dominate the product type segment.
Key Drivers by Segment:
- UAE: Strong economic growth, high disposable incomes, significant tourism.
- South Africa: Established wine industry, large consumer base, developed infrastructure.
- Glass: Established infrastructure, consumer preference for aesthetics.
- Metal: Lightweighting, durability, recyclability.
- Spirits: High value, premium packaging demand.
- Beer: Large consumer base, cost-effective packaging solutions.
MEA Alcoholic Drinks Packaging Market Product Developments
Recent product innovations focus on sustainability, functionality, and aesthetics. Lightweighting technologies are being adopted to reduce material usage and transportation costs. Companies are investing in recyclable and biodegradable materials to address environmental concerns. Smart packaging solutions with features like tamper evidence and traceability are gaining traction. These developments reflect a market shift towards sustainable and technologically advanced packaging options.
Key Drivers of MEA Alcoholic Drinks Packaging Market Growth
The MEA alcoholic drinks packaging market is fueled by several key factors. Rising disposable incomes and increasing alcohol consumption are primary drivers. Tourism plays a crucial role, particularly in countries like the UAE. Government regulations promoting sustainable practices are also influencing packaging choices. Technological advancements, such as lightweighting and smart packaging solutions, are further accelerating market growth.
Challenges in the MEA Alcoholic Drinks Packaging Market Market
The market faces challenges like fluctuating raw material prices, stringent regulatory compliance requirements, and intense competition. Supply chain disruptions and logistical complexities can impact production and delivery. Furthermore, maintaining consistency in quality and sustainability across the entire supply chain is crucial.
Emerging Opportunities in MEA Alcoholic Drinks Packaging Market
Significant opportunities exist in sustainable packaging solutions, particularly in biodegradable and compostable materials. Strategic partnerships between packaging companies and alcoholic beverage brands can create innovative products and expand market reach. Leveraging technological advancements, such as digital printing and smart packaging, can enhance brand appeal and consumer engagement. Expanding into new markets within the MEA region and exploring niche segments like craft beverages can further unlock growth potential.
Leading Players in the MEA Alcoholic Drinks Packaging Market Sector
- Saverglass SAS
- Middle East Glass Manufacturing Company SAE
- Ball Corporation (Ball Corporation)
- Majan Glass Company SAOG
- Nampak Ltd
- The National Company For Glass Industries (Zouja)
- Crown Holdings Inc (Crown Holdings Inc)
- Can-Pack S.A.
- Saudi Arabian Glass Co Ltd
- Huhtamäki Oyj (Huhtamäki Oyj)
- Bonpak (Pty) Ltd
- Consol Glass Ltd
Key Milestones in MEA Alcoholic Drinks Packaging Market Industry
- August 2021: Huhtamäki Oyj acquired Elif Holding AŞ, expanding its presence in Turkey and Egypt and boosting its sustainability initiatives. This acquisition significantly impacted the market by increasing Huhtamaki's market share and strengthening its position in the sustainable packaging sector within the MEA region.
- August 2021: Ball Corporation's focus on sustainable aluminum packaging alternatives to plastic and glass positions it as a leader in driving environmentally friendly packaging solutions within the alcoholic beverage industry in MEA. This initiative signals a significant shift towards sustainability within the industry and sets a trend for competitors.
Strategic Outlook for MEA Alcoholic Drinks Packaging Market Market
The MEA alcoholic drinks packaging market is poised for continued growth, driven by favorable economic conditions, evolving consumer preferences, and technological advancements. Strategic partnerships, investments in sustainable solutions, and a focus on innovation will be key to success in this dynamic market. Companies that can effectively adapt to evolving regulations and consumer demands will be well-positioned to capture significant market share.
MEA Alcoholic Drinks Packaging Market Segmentation
-
1. Primary Material
- 1.1. Glass
- 1.2. Metal
- 1.3. Plastic
- 1.4. Paper
-
2. Alcoholic Products
- 2.1. Wine
- 2.2. Spirits
- 2.3. Beer
- 2.4. Other Types of Alcoholic Beverages
-
3. Product Type
- 3.1. Glass Bottles
- 3.2. Metal Cans
- 3.3. Plastic Bottles
- 3.4. Other Product Types
MEA Alcoholic Drinks Packaging Market Segmentation By Geography
-
1. North America
- 1.1. United States
- 1.2. Canada
- 1.3. Mexico
-
2. South America
- 2.1. Brazil
- 2.2. Argentina
- 2.3. Rest of South America
-
3. Europe
- 3.1. United Kingdom
- 3.2. Germany
- 3.3. France
- 3.4. Italy
- 3.5. Spain
- 3.6. Russia
- 3.7. Benelux
- 3.8. Nordics
- 3.9. Rest of Europe
-
4. Middle East & Africa
- 4.1. Turkey
- 4.2. Israel
- 4.3. GCC
- 4.4. North Africa
- 4.5. South Africa
- 4.6. Rest of Middle East & Africa
-
5. Asia Pacific
- 5.1. China
- 5.2. India
- 5.3. Japan
- 5.4. South Korea
- 5.5. ASEAN
- 5.6. Oceania
- 5.7. Rest of Asia Pacific
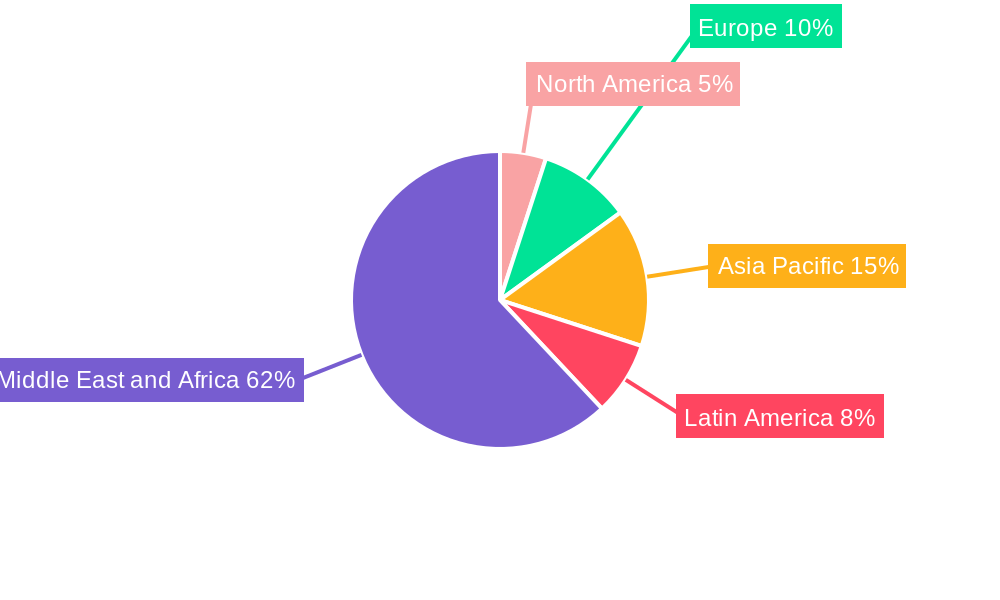
MEA Alcoholic Drinks Packaging Market Regional Market Share
Geographic Coverage of MEA Alcoholic Drinks Packaging Market
MEA Alcoholic Drinks Packaging Market REPORT HIGHLIGHTS
| Aspects | Details |
|---|---|
| Study Period | 2020-2034 |
| Base Year | 2025 |
| Estimated Year | 2026 |
| Forecast Period | 2026-2034 |
| Historical Period | 2020-2025 |
| Growth Rate | CAGR of 5.8% from 2020-2034 |
| Segmentation |
|
Table of Contents
- 1. Introduction
- 1.1. Research Scope
- 1.2. Market Segmentation
- 1.3. Research Objective
- 1.4. Definitions and Assumptions
- 2. Executive Summary
- 2.1. Market Snapshot
- 3. Market Dynamics
- 3.1. Market Drivers
- 3.2. Market Restrains
- 3.3. Market Trends
- 3.4. Market Opportunities
- 4. Market Factor Analysis
- 4.1. Porters Five Forces
- 4.1.1. Bargaining Power of Suppliers
- 4.1.2. Bargaining Power of Buyers
- 4.1.3. Threat of New Entrants
- 4.1.4. Threat of Substitutes
- 4.1.5. Competitive Rivalry
- 4.2. PESTEL analysis
- 4.3. BCG Analysis
- 4.3.1. Stars (High Growth, High Market Share)
- 4.3.2. Cash Cows (Low Growth, High Market Share)
- 4.3.3. Question Mark (High Growth, Low Market Share)
- 4.3.4. Dogs (Low Growth, Low Market Share)
- 4.4. Ansoff Matrix Analysis
- 4.5. Supply Chain Analysis
- 4.6. Regulatory Landscape
- 4.7. Current Market Potential and Opportunity Assessment (TAM–SAM–SOM Framework)
- 4.8. MDP Analyst Note
- 4.1. Porters Five Forces
- 5. Market Analysis, Insights and Forecast 2021-2033
- 5.1. Market Analysis, Insights and Forecast - by Primary Material
- 5.1.1. Glass
- 5.1.2. Metal
- 5.1.3. Plastic
- 5.1.4. Paper
- 5.2. Market Analysis, Insights and Forecast - by Alcoholic Products
- 5.2.1. Wine
- 5.2.2. Spirits
- 5.2.3. Beer
- 5.2.4. Other Types of Alcoholic Beverages
- 5.3. Market Analysis, Insights and Forecast - by Product Type
- 5.3.1. Glass Bottles
- 5.3.2. Metal Cans
- 5.3.3. Plastic Bottles
- 5.3.4. Other Product Types
- 5.4. Market Analysis, Insights and Forecast - by Region
- 5.4.1. North America
- 5.4.2. South America
- 5.4.3. Europe
- 5.4.4. Middle East & Africa
- 5.4.5. Asia Pacific
- 5.1. Market Analysis, Insights and Forecast - by Primary Material
- 6. Global MEA Alcoholic Drinks Packaging Market Analysis, Insights and Forecast, 2021-2033
- 6.1. Market Analysis, Insights and Forecast - by Primary Material
- 6.1.1. Glass
- 6.1.2. Metal
- 6.1.3. Plastic
- 6.1.4. Paper
- 6.2. Market Analysis, Insights and Forecast - by Alcoholic Products
- 6.2.1. Wine
- 6.2.2. Spirits
- 6.2.3. Beer
- 6.2.4. Other Types of Alcoholic Beverages
- 6.3. Market Analysis, Insights and Forecast - by Product Type
- 6.3.1. Glass Bottles
- 6.3.2. Metal Cans
- 6.3.3. Plastic Bottles
- 6.3.4. Other Product Types
- 6.1. Market Analysis, Insights and Forecast - by Primary Material
- 7. North America MEA Alcoholic Drinks Packaging Market Analysis, Insights and Forecast, 2020-2032
- 7.1. Market Analysis, Insights and Forecast - by Primary Material
- 7.1.1. Glass
- 7.1.2. Metal
- 7.1.3. Plastic
- 7.1.4. Paper
- 7.2. Market Analysis, Insights and Forecast - by Alcoholic Products
- 7.2.1. Wine
- 7.2.2. Spirits
- 7.2.3. Beer
- 7.2.4. Other Types of Alcoholic Beverages
- 7.3. Market Analysis, Insights and Forecast - by Product Type
- 7.3.1. Glass Bottles
- 7.3.2. Metal Cans
- 7.3.3. Plastic Bottles
- 7.3.4. Other Product Types
- 7.1. Market Analysis, Insights and Forecast - by Primary Material
- 8. South America MEA Alcoholic Drinks Packaging Market Analysis, Insights and Forecast, 2020-2032
- 8.1. Market Analysis, Insights and Forecast - by Primary Material
- 8.1.1. Glass
- 8.1.2. Metal
- 8.1.3. Plastic
- 8.1.4. Paper
- 8.2. Market Analysis, Insights and Forecast - by Alcoholic Products
- 8.2.1. Wine
- 8.2.2. Spirits
- 8.2.3. Beer
- 8.2.4. Other Types of Alcoholic Beverages
- 8.3. Market Analysis, Insights and Forecast - by Product Type
- 8.3.1. Glass Bottles
- 8.3.2. Metal Cans
- 8.3.3. Plastic Bottles
- 8.3.4. Other Product Types
- 8.1. Market Analysis, Insights and Forecast - by Primary Material
- 9. Europe MEA Alcoholic Drinks Packaging Market Analysis, Insights and Forecast, 2020-2032
- 9.1. Market Analysis, Insights and Forecast - by Primary Material
- 9.1.1. Glass
- 9.1.2. Metal
- 9.1.3. Plastic
- 9.1.4. Paper
- 9.2. Market Analysis, Insights and Forecast - by Alcoholic Products
- 9.2.1. Wine
- 9.2.2. Spirits
- 9.2.3. Beer
- 9.2.4. Other Types of Alcoholic Beverages
- 9.3. Market Analysis, Insights and Forecast - by Product Type
- 9.3.1. Glass Bottles
- 9.3.2. Metal Cans
- 9.3.3. Plastic Bottles
- 9.3.4. Other Product Types
- 9.1. Market Analysis, Insights and Forecast - by Primary Material
- 10. Middle East & Africa MEA Alcoholic Drinks Packaging Market Analysis, Insights and Forecast, 2020-2032
- 10.1. Market Analysis, Insights and Forecast - by Primary Material
- 10.1.1. Glass
- 10.1.2. Metal
- 10.1.3. Plastic
- 10.1.4. Paper
- 10.2. Market Analysis, Insights and Forecast - by Alcoholic Products
- 10.2.1. Wine
- 10.2.2. Spirits
- 10.2.3. Beer
- 10.2.4. Other Types of Alcoholic Beverages
- 10.3. Market Analysis, Insights and Forecast - by Product Type
- 10.3.1. Glass Bottles
- 10.3.2. Metal Cans
- 10.3.3. Plastic Bottles
- 10.3.4. Other Product Types
- 10.1. Market Analysis, Insights and Forecast - by Primary Material
- 11. Asia Pacific MEA Alcoholic Drinks Packaging Market Analysis, Insights and Forecast, 2020-2032
- 11.1. Market Analysis, Insights and Forecast - by Primary Material
- 11.1.1. Glass
- 11.1.2. Metal
- 11.1.3. Plastic
- 11.1.4. Paper
- 11.2. Market Analysis, Insights and Forecast - by Alcoholic Products
- 11.2.1. Wine
- 11.2.2. Spirits
- 11.2.3. Beer
- 11.2.4. Other Types of Alcoholic Beverages
- 11.3. Market Analysis, Insights and Forecast - by Product Type
- 11.3.1. Glass Bottles
- 11.3.2. Metal Cans
- 11.3.3. Plastic Bottles
- 11.3.4. Other Product Types
- 11.1. Market Analysis, Insights and Forecast - by Primary Material
- 12. Competitive Analysis
- 12.1. Company Profiles
- 12.1.1 Saverglass SAS
- 12.1.1.1. Company Overview
- 12.1.1.2. Products
- 12.1.1.3. Company Financials
- 12.1.1.4. SWOT Analysis
- 12.1.2 Middle East Glass Manufacturing Company SAE
- 12.1.2.1. Company Overview
- 12.1.2.2. Products
- 12.1.2.3. Company Financials
- 12.1.2.4. SWOT Analysis
- 12.1.3 Ball Corporation
- 12.1.3.1. Company Overview
- 12.1.3.2. Products
- 12.1.3.3. Company Financials
- 12.1.3.4. SWOT Analysis
- 12.1.4 Majan Glass Company SAOG
- 12.1.4.1. Company Overview
- 12.1.4.2. Products
- 12.1.4.3. Company Financials
- 12.1.4.4. SWOT Analysis
- 12.1.5 Nampak Ltd
- 12.1.5.1. Company Overview
- 12.1.5.2. Products
- 12.1.5.3. Company Financials
- 12.1.5.4. SWOT Analysis
- 12.1.6 The National Company For Glass Industries (Zouja)
- 12.1.6.1. Company Overview
- 12.1.6.2. Products
- 12.1.6.3. Company Financials
- 12.1.6.4. SWOT Analysis
- 12.1.7 Crown Holdings Inc
- 12.1.7.1. Company Overview
- 12.1.7.2. Products
- 12.1.7.3. Company Financials
- 12.1.7.4. SWOT Analysis
- 12.1.8 Can-Pack S
- 12.1.8.1. Company Overview
- 12.1.8.2. Products
- 12.1.8.3. Company Financials
- 12.1.8.4. SWOT Analysis
- 12.1.9 Saudi Arabian Glass Co Ltd
- 12.1.9.1. Company Overview
- 12.1.9.2. Products
- 12.1.9.3. Company Financials
- 12.1.9.4. SWOT Analysis
- 12.1.10 Huhtamäki Oyj
- 12.1.10.1. Company Overview
- 12.1.10.2. Products
- 12.1.10.3. Company Financials
- 12.1.10.4. SWOT Analysis
- 12.1.11 Bonpak (Pty) Ltd
- 12.1.11.1. Company Overview
- 12.1.11.2. Products
- 12.1.11.3. Company Financials
- 12.1.11.4. SWOT Analysis
- 12.1.12 Consol Glass Ltd
- 12.1.12.1. Company Overview
- 12.1.12.2. Products
- 12.1.12.3. Company Financials
- 12.1.12.4. SWOT Analysis
- 12.1.1 Saverglass SAS
- 12.2. Market Entropy
- 12.2.1 Company's Key Areas Served
- 12.2.2 Recent Developments
- 12.3. Company Market Share Analysis 2025
- 12.3.1 Top 5 Companies Market Share Analysis
- 12.3.2 Top 3 Companies Market Share Analysis
- 12.4. List of Potential Customers
- 13. Research Methodology
List of Figures
- Figure 1: Global MEA Alcoholic Drinks Packaging Market Revenue Breakdown (billion, %) by Region 2025 & 2033
- Figure 2: North America MEA Alcoholic Drinks Packaging Market Revenue (billion), by Primary Material 2025 & 2033
- Figure 3: North America MEA Alcoholic Drinks Packaging Market Revenue Share (%), by Primary Material 2025 & 2033
- Figure 4: North America MEA Alcoholic Drinks Packaging Market Revenue (billion), by Alcoholic Products 2025 & 2033
- Figure 5: North America MEA Alcoholic Drinks Packaging Market Revenue Share (%), by Alcoholic Products 2025 & 2033
- Figure 6: North America MEA Alcoholic Drinks Packaging Market Revenue (billion), by Product Type 2025 & 2033
- Figure 7: North America MEA Alcoholic Drinks Packaging Market Revenue Share (%), by Product Type 2025 & 2033
- Figure 8: North America MEA Alcoholic Drinks Packaging Market Revenue (billion), by Country 2025 & 2033
- Figure 9: North America MEA Alcoholic Drinks Packaging Market Revenue Share (%), by Country 2025 & 2033
- Figure 10: South America MEA Alcoholic Drinks Packaging Market Revenue (billion), by Primary Material 2025 & 2033
- Figure 11: South America MEA Alcoholic Drinks Packaging Market Revenue Share (%), by Primary Material 2025 & 2033
- Figure 12: South America MEA Alcoholic Drinks Packaging Market Revenue (billion), by Alcoholic Products 2025 & 2033
- Figure 13: South America MEA Alcoholic Drinks Packaging Market Revenue Share (%), by Alcoholic Products 2025 & 2033
- Figure 14: South America MEA Alcoholic Drinks Packaging Market Revenue (billion), by Product Type 2025 & 2033
- Figure 15: South America MEA Alcoholic Drinks Packaging Market Revenue Share (%), by Product Type 2025 & 2033
- Figure 16: South America MEA Alcoholic Drinks Packaging Market Revenue (billion), by Country 2025 & 2033
- Figure 17: South America MEA Alcoholic Drinks Packaging Market Revenue Share (%), by Country 2025 & 2033
- Figure 18: Europe MEA Alcoholic Drinks Packaging Market Revenue (billion), by Primary Material 2025 & 2033
- Figure 19: Europe MEA Alcoholic Drinks Packaging Market Revenue Share (%), by Primary Material 2025 & 2033
- Figure 20: Europe MEA Alcoholic Drinks Packaging Market Revenue (billion), by Alcoholic Products 2025 & 2033
- Figure 21: Europe MEA Alcoholic Drinks Packaging Market Revenue Share (%), by Alcoholic Products 2025 & 2033
- Figure 22: Europe MEA Alcoholic Drinks Packaging Market Revenue (billion), by Product Type 2025 & 2033
- Figure 23: Europe MEA Alcoholic Drinks Packaging Market Revenue Share (%), by Product Type 2025 & 2033
- Figure 24: Europe MEA Alcoholic Drinks Packaging Market Revenue (billion), by Country 2025 & 2033
- Figure 25: Europe MEA Alcoholic Drinks Packaging Market Revenue Share (%), by Country 2025 & 2033
- Figure 26: Middle East & Africa MEA Alcoholic Drinks Packaging Market Revenue (billion), by Primary Material 2025 & 2033
- Figure 27: Middle East & Africa MEA Alcoholic Drinks Packaging Market Revenue Share (%), by Primary Material 2025 & 2033
- Figure 28: Middle East & Africa MEA Alcoholic Drinks Packaging Market Revenue (billion), by Alcoholic Products 2025 & 2033
- Figure 29: Middle East & Africa MEA Alcoholic Drinks Packaging Market Revenue Share (%), by Alcoholic Products 2025 & 2033
- Figure 30: Middle East & Africa MEA Alcoholic Drinks Packaging Market Revenue (billion), by Product Type 2025 & 2033
- Figure 31: Middle East & Africa MEA Alcoholic Drinks Packaging Market Revenue Share (%), by Product Type 2025 & 2033
- Figure 32: Middle East & Africa MEA Alcoholic Drinks Packaging Market Revenue (billion), by Country 2025 & 2033
- Figure 33: Middle East & Africa MEA Alcoholic Drinks Packaging Market Revenue Share (%), by Country 2025 & 2033
- Figure 34: Asia Pacific MEA Alcoholic Drinks Packaging Market Revenue (billion), by Primary Material 2025 & 2033
- Figure 35: Asia Pacific MEA Alcoholic Drinks Packaging Market Revenue Share (%), by Primary Material 2025 & 2033
- Figure 36: Asia Pacific MEA Alcoholic Drinks Packaging Market Revenue (billion), by Alcoholic Products 2025 & 2033
- Figure 37: Asia Pacific MEA Alcoholic Drinks Packaging Market Revenue Share (%), by Alcoholic Products 2025 & 2033
- Figure 38: Asia Pacific MEA Alcoholic Drinks Packaging Market Revenue (billion), by Product Type 2025 & 2033
- Figure 39: Asia Pacific MEA Alcoholic Drinks Packaging Market Revenue Share (%), by Product Type 2025 & 2033
- Figure 40: Asia Pacific MEA Alcoholic Drinks Packaging Market Revenue (billion), by Country 2025 & 2033
- Figure 41: Asia Pacific MEA Alcoholic Drinks Packaging Market Revenue Share (%), by Country 2025 & 2033
List of Tables
- Table 1: Global MEA Alcoholic Drinks Packaging Market Revenue billion Forecast, by Primary Material 2020 & 2033
- Table 2: Global MEA Alcoholic Drinks Packaging Market Revenue billion Forecast, by Alcoholic Products 2020 & 2033
- Table 3: Global MEA Alcoholic Drinks Packaging Market Revenue billion Forecast, by Product Type 2020 & 2033
- Table 4: Global MEA Alcoholic Drinks Packaging Market Revenue billion Forecast, by Region 2020 & 2033
- Table 5: Global MEA Alcoholic Drinks Packaging Market Revenue billion Forecast, by Primary Material 2020 & 2033
- Table 6: Global MEA Alcoholic Drinks Packaging Market Revenue billion Forecast, by Alcoholic Products 2020 & 2033
- Table 7: Global MEA Alcoholic Drinks Packaging Market Revenue billion Forecast, by Product Type 2020 & 2033
- Table 8: Global MEA Alcoholic Drinks Packaging Market Revenue billion Forecast, by Country 2020 & 2033
- Table 9: United States MEA Alcoholic Drinks Packaging Market Revenue (billion) Forecast, by Application 2020 & 2033
- Table 10: Canada MEA Alcoholic Drinks Packaging Market Revenue (billion) Forecast, by Application 2020 & 2033
- Table 11: Mexico MEA Alcoholic Drinks Packaging Market Revenue (billion) Forecast, by Application 2020 & 2033
- Table 12: Global MEA Alcoholic Drinks Packaging Market Revenue billion Forecast, by Primary Material 2020 & 2033
- Table 13: Global MEA Alcoholic Drinks Packaging Market Revenue billion Forecast, by Alcoholic Products 2020 & 2033
- Table 14: Global MEA Alcoholic Drinks Packaging Market Revenue billion Forecast, by Product Type 2020 & 2033
- Table 15: Global MEA Alcoholic Drinks Packaging Market Revenue billion Forecast, by Country 2020 & 2033
- Table 16: Brazil MEA Alcoholic Drinks Packaging Market Revenue (billion) Forecast, by Application 2020 & 2033
- Table 17: Argentina MEA Alcoholic Drinks Packaging Market Revenue (billion) Forecast, by Application 2020 & 2033
- Table 18: Rest of South America MEA Alcoholic Drinks Packaging Market Revenue (billion) Forecast, by Application 2020 & 2033
- Table 19: Global MEA Alcoholic Drinks Packaging Market Revenue billion Forecast, by Primary Material 2020 & 2033
- Table 20: Global MEA Alcoholic Drinks Packaging Market Revenue billion Forecast, by Alcoholic Products 2020 & 2033
- Table 21: Global MEA Alcoholic Drinks Packaging Market Revenue billion Forecast, by Product Type 2020 & 2033
- Table 22: Global MEA Alcoholic Drinks Packaging Market Revenue billion Forecast, by Country 2020 & 2033
- Table 23: United Kingdom MEA Alcoholic Drinks Packaging Market Revenue (billion) Forecast, by Application 2020 & 2033
- Table 24: Germany MEA Alcoholic Drinks Packaging Market Revenue (billion) Forecast, by Application 2020 & 2033
- Table 25: France MEA Alcoholic Drinks Packaging Market Revenue (billion) Forecast, by Application 2020 & 2033
- Table 26: Italy MEA Alcoholic Drinks Packaging Market Revenue (billion) Forecast, by Application 2020 & 2033
- Table 27: Spain MEA Alcoholic Drinks Packaging Market Revenue (billion) Forecast, by Application 2020 & 2033
- Table 28: Russia MEA Alcoholic Drinks Packaging Market Revenue (billion) Forecast, by Application 2020 & 2033
- Table 29: Benelux MEA Alcoholic Drinks Packaging Market Revenue (billion) Forecast, by Application 2020 & 2033
- Table 30: Nordics MEA Alcoholic Drinks Packaging Market Revenue (billion) Forecast, by Application 2020 & 2033
- Table 31: Rest of Europe MEA Alcoholic Drinks Packaging Market Revenue (billion) Forecast, by Application 2020 & 2033
- Table 32: Global MEA Alcoholic Drinks Packaging Market Revenue billion Forecast, by Primary Material 2020 & 2033
- Table 33: Global MEA Alcoholic Drinks Packaging Market Revenue billion Forecast, by Alcoholic Products 2020 & 2033
- Table 34: Global MEA Alcoholic Drinks Packaging Market Revenue billion Forecast, by Product Type 2020 & 2033
- Table 35: Global MEA Alcoholic Drinks Packaging Market Revenue billion Forecast, by Country 2020 & 2033
- Table 36: Turkey MEA Alcoholic Drinks Packaging Market Revenue (billion) Forecast, by Application 2020 & 2033
- Table 37: Israel MEA Alcoholic Drinks Packaging Market Revenue (billion) Forecast, by Application 2020 & 2033
- Table 38: GCC MEA Alcoholic Drinks Packaging Market Revenue (billion) Forecast, by Application 2020 & 2033
- Table 39: North Africa MEA Alcoholic Drinks Packaging Market Revenue (billion) Forecast, by Application 2020 & 2033
- Table 40: South Africa MEA Alcoholic Drinks Packaging Market Revenue (billion) Forecast, by Application 2020 & 2033
- Table 41: Rest of Middle East & Africa MEA Alcoholic Drinks Packaging Market Revenue (billion) Forecast, by Application 2020 & 2033
- Table 42: Global MEA Alcoholic Drinks Packaging Market Revenue billion Forecast, by Primary Material 2020 & 2033
- Table 43: Global MEA Alcoholic Drinks Packaging Market Revenue billion Forecast, by Alcoholic Products 2020 & 2033
- Table 44: Global MEA Alcoholic Drinks Packaging Market Revenue billion Forecast, by Product Type 2020 & 2033
- Table 45: Global MEA Alcoholic Drinks Packaging Market Revenue billion Forecast, by Country 2020 & 2033
- Table 46: China MEA Alcoholic Drinks Packaging Market Revenue (billion) Forecast, by Application 2020 & 2033
- Table 47: India MEA Alcoholic Drinks Packaging Market Revenue (billion) Forecast, by Application 2020 & 2033
- Table 48: Japan MEA Alcoholic Drinks Packaging Market Revenue (billion) Forecast, by Application 2020 & 2033
- Table 49: South Korea MEA Alcoholic Drinks Packaging Market Revenue (billion) Forecast, by Application 2020 & 2033
- Table 50: ASEAN MEA Alcoholic Drinks Packaging Market Revenue (billion) Forecast, by Application 2020 & 2033
- Table 51: Oceania MEA Alcoholic Drinks Packaging Market Revenue (billion) Forecast, by Application 2020 & 2033
- Table 52: Rest of Asia Pacific MEA Alcoholic Drinks Packaging Market Revenue (billion) Forecast, by Application 2020 & 2033
Frequently Asked Questions
1. What is the projected Compound Annual Growth Rate (CAGR) of the MEA Alcoholic Drinks Packaging Market?
The projected CAGR is approximately 5.8%.
2. Which companies are prominent players in the MEA Alcoholic Drinks Packaging Market?
Key companies in the market include Saverglass SAS, Middle East Glass Manufacturing Company SAE, Ball Corporation, Majan Glass Company SAOG, Nampak Ltd, The National Company For Glass Industries (Zouja), Crown Holdings Inc, Can-Pack S, Saudi Arabian Glass Co Ltd, Huhtamäki Oyj, Bonpak (Pty) Ltd, Consol Glass Ltd.
3. What are the main segments of the MEA Alcoholic Drinks Packaging Market?
The market segments include Primary Material, Alcoholic Products, Product Type.
4. Can you provide details about the market size?
The market size is estimated to be USD 78.63 billion as of 2022.
5. What are some drivers contributing to market growth?
Growth in Purchasing Power of Consumers; Growing Awareness Among Alcoholic Beverage Manufacturers to Differentiate Their Products Over Packaging.
6. What are the notable trends driving market growth?
Metal Can Packaging is Expected to Grow Significantly.
7. Are there any restraints impacting market growth?
Presence of Alternate Packaging Solutions.
8. Can you provide examples of recent developments in the market?
August 2021 - Huhtamäki Oyj acquired Elif Holding AŞ, a major supplier of sustainable, flexible packaging to global FMCG brand owners, with operations in Turkey and Egypt. In line with Huhtamaki's 2030 growth strategy, the acquisition adds scale in strategic geographies and supports Huhtamaki's progress toward reaching its high sustainability ambitions. The acquisition also expands Huhtamaki's technology capabilities and product range, allowing it to serve its customers even better.
9. What pricing options are available for accessing the report?
Pricing options include single-user, multi-user, and enterprise licenses priced at USD 4750, USD 4950, and USD 6800 respectively.
10. Is the market size provided in terms of value or volume?
The market size is provided in terms of value, measured in billion.
11. Are there any specific market keywords associated with the report?
Yes, the market keyword associated with the report is "MEA Alcoholic Drinks Packaging Market," which aids in identifying and referencing the specific market segment covered.
12. How do I determine which pricing option suits my needs best?
The pricing options vary based on user requirements and access needs. Individual users may opt for single-user licenses, while businesses requiring broader access may choose multi-user or enterprise licenses for cost-effective access to the report.
13. Are there any additional resources or data provided in the MEA Alcoholic Drinks Packaging Market report?
While the report offers comprehensive insights, it's advisable to review the specific contents or supplementary materials provided to ascertain if additional resources or data are available.
14. How can I stay updated on further developments or reports in the MEA Alcoholic Drinks Packaging Market?
To stay informed about further developments, trends, and reports in the MEA Alcoholic Drinks Packaging Market, consider subscribing to industry newsletters, following relevant companies and organizations, or regularly checking reputable industry news sources and publications.
Methodology
Step 1 - Identification of Relevant Samples Size from Population Database


Step 2 - Approaches for Defining Global Market Size (Value, Volume* & Price*)

Note*: In applicable scenarios
Step 3 - Data Sources
Primary Research
- Web Analytics
- Survey Reports
- Research Institute
- Latest Research Reports
- Opinion Leaders
Secondary Research
- Annual Reports
- White Paper
- Latest Press Release
- Industry Association
- Paid Database
- Investor Presentations

Step 4 - Data Triangulation
Involves using different sources of information in order to increase the validity of a study
These sources are likely to be stakeholders in a program - participants, other researchers, program staff, other community members, and so on.
Then we put all data in single framework & apply various statistical tools to find out the dynamic on the market.
During the analysis stage, feedback from the stakeholder groups would be compared to determine areas of agreement as well as areas of divergence