

Key Insights
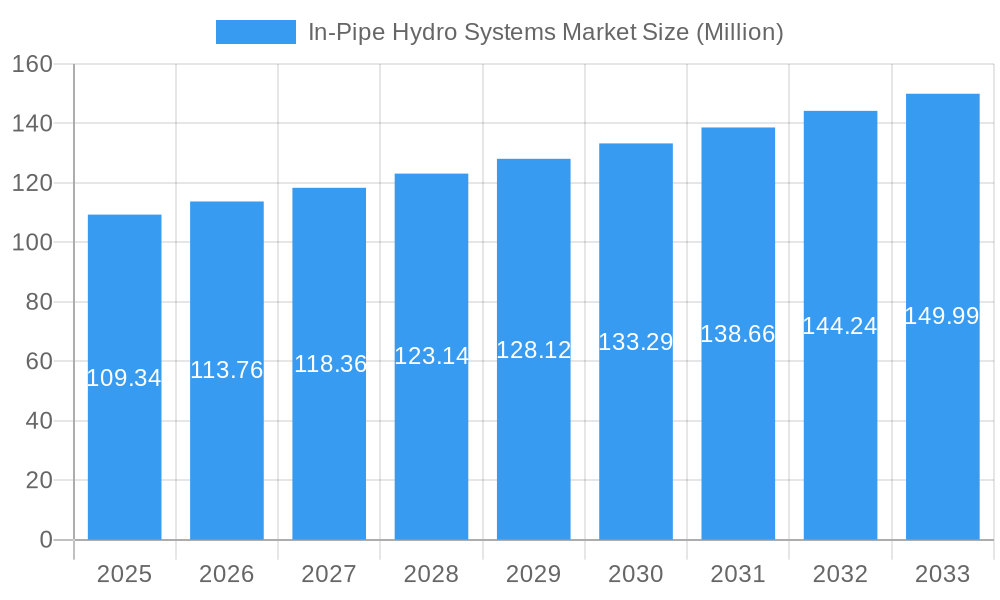
The In-Pipe Hydro Systems market, valued at $109.34 million in 2025, is projected to experience robust growth, driven by increasing demand for sustainable energy solutions and the rising need for decentralized power generation. The market's Compound Annual Growth Rate (CAGR) of 3.87% from 2025 to 2033 indicates a steady expansion, fueled primarily by the adoption of in-pipe hydro systems in municipal water and wastewater treatment facilities. These systems offer a cost-effective and environmentally friendly approach to generating clean energy, reducing reliance on conventional power sources and lowering operational costs. Further growth is anticipated from the industrial water systems segment, particularly in sectors with high water usage like manufacturing and food processing. The increasing focus on water conservation and energy efficiency initiatives worldwide will significantly bolster market adoption. While initial installation costs may present a restraint, the long-term benefits, including reduced energy bills and carbon footprint, are expected to drive market penetration. The market is segmented by application (municipal, industrial, irrigation, urban/building) and capacity (pico-hydro, micro-hydro, mini-hydro), with the micro-hydro segment projected to hold a significant market share due to its suitability for various applications. Geographical expansion is expected across North America (driven by strong government support for renewable energy), Europe (high environmental consciousness), and the Asia-Pacific region (rapid industrialization and urbanization).
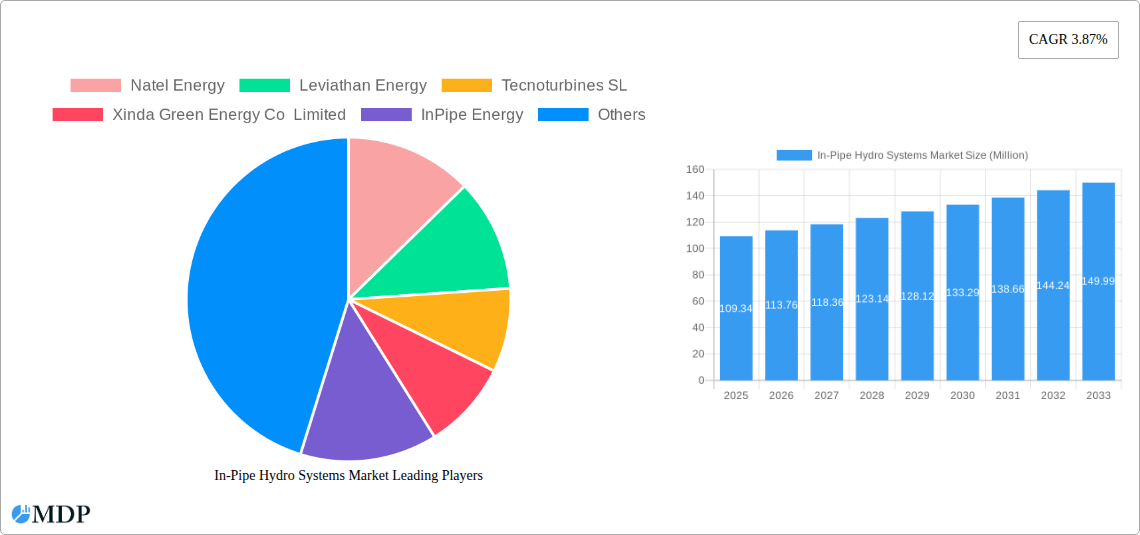
In-Pipe Hydro Systems Market Market Size (In Million)
The competitive landscape features established players such as Natel Energy, Leviathan Energy, and Tecnoturbines SL, along with emerging companies. These companies are focusing on technological advancements, such as improved turbine designs and enhanced energy conversion efficiency, to enhance market competitiveness. Strategic partnerships and collaborations are also expected to play a crucial role in shaping market dynamics. The market's future trajectory depends on factors such as government policies promoting renewable energy adoption, technological advancements leading to cost reductions, and increasing awareness of the environmental and economic benefits of in-pipe hydro systems. Expansion into new applications and geographical regions will also contribute to sustained growth throughout the forecast period. Ongoing research and development efforts focused on optimizing system performance and lowering installation complexities will be essential for market expansion.
In-Pipe Hydro Systems Market Company Market Share
Unlock Untapped Energy: A Comprehensive Analysis of the In-Pipe Hydro Systems Market (2019-2033)
This in-depth report provides a comprehensive analysis of the In-Pipe Hydro Systems market, offering invaluable insights for stakeholders across the renewable energy and water management sectors. From market dynamics and leading players to emerging opportunities and strategic outlooks, this report unveils the potential of in-pipe hydro technology and its transformative impact on sustainable energy generation. The study period spans from 2019 to 2033, with 2025 serving as the base and estimated year. The market size is projected to reach xx Million by 2033.
In-Pipe Hydro Systems Market Market Dynamics & Concentration
The In-Pipe Hydro Systems market is experiencing significant growth driven by increasing demand for renewable energy sources and the need for efficient water management solutions. Market concentration is currently moderate, with key players like Natel Energy, Leviathan Energy, and InPipe Energy holding significant market share. However, the market is characterized by a growing number of entrants, particularly smaller companies focusing on niche applications.
Market Dynamics:
- Innovation Drivers: Ongoing advancements in turbine technology, sensor integration, and control systems are driving efficiency gains and expanding the applicability of in-pipe hydro systems.
- Regulatory Frameworks: Supportive government policies and incentives for renewable energy adoption are stimulating market growth, particularly in regions with ambitious sustainability targets. However, variations in regulatory landscapes across different geographies pose challenges for standardization and widespread adoption.
- Product Substitutes: While traditional hydroelectric power plants remain a primary energy source, in-pipe hydro systems offer a more localized, adaptable, and cost-effective alternative for smaller-scale applications.
- End-User Trends: The rising adoption of smart water management practices and the growing focus on energy efficiency are creating a strong demand for in-pipe hydro systems across municipal, industrial, and other applications.
- M&A Activities: The number of mergers and acquisitions in the In-Pipe Hydro Systems market has been moderate (xx deals in the last 5 years), indicating a consolidating landscape with larger players seeking to expand their market presence and technological capabilities. The average market share of the top 5 players is estimated at xx%.
In-Pipe Hydro Systems Market Industry Trends & Analysis
The In-Pipe Hydro Systems market is witnessing robust growth, driven by a confluence of factors. The global market is projected to achieve a CAGR of xx% during the forecast period (2025-2033). This growth is fueled by increasing investments in renewable energy infrastructure, coupled with a growing awareness of the environmental and economic benefits associated with sustainable energy solutions. Technological advancements, such as improved turbine designs and enhanced energy conversion efficiency, are further accelerating market expansion. Consumer preference for environmentally friendly energy sources is also a key driver. Competitive dynamics are characterized by a mix of established players and new entrants vying for market share, fostering innovation and driving down costs. Market penetration is currently estimated at xx% and is projected to reach xx% by 2033.
Leading Markets & Segments in In-Pipe Hydro Systems Market
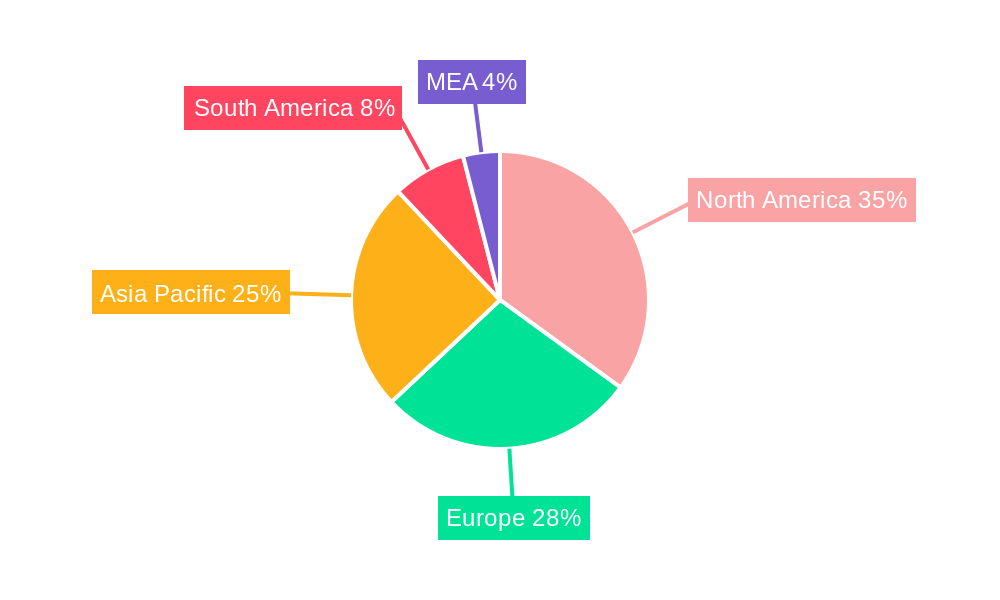
The Municipal Water or Wastewater Systems segment currently dominates the In-Pipe Hydro Systems market, driven by the significant energy potential within existing water infrastructure and the associated cost savings. North America and Europe are currently the leading regions, but Asia-Pacific is expected to experience the fastest growth in the coming years due to rapid urbanization and increasing investments in renewable energy.
Dominant Segments & Key Drivers:
Application:
- Municipal Water or Wastewater Systems: High energy potential in existing infrastructure, supportive government regulations, and significant cost savings.
- Industrial Water Systems: Growing demand for energy efficiency in industrial processes and the potential for on-site renewable energy generation.
- Other Applications (Irrigation, Urban & Building): Emerging opportunities in decentralized energy generation for various applications.
Capacity:
- Micro-hydro (Up To 100kW): Largest market segment due to its widespread applicability and relatively lower installation costs.
- Mini-hydro (100kW and Above): Growing segment driven by larger-scale projects in municipal and industrial applications.
- Pico-hydro (Up To 5kW): Niche applications with potential for growth in off-grid and remote areas.
Regional Dominance:
North America holds a significant market share due to early adoption, supportive policies, and established technological expertise. Europe follows closely, while the Asia-Pacific region exhibits strong growth potential driven by increasing urbanization and expanding renewable energy infrastructure.
In-Pipe Hydro Systems Market Product Developments
Recent product innovations focus on enhancing turbine efficiency, improving energy conversion rates, and integrating advanced sensor and control technologies for optimized performance and remote monitoring. The development of modular and adaptable systems allows for easier installation and integration into existing water infrastructure. These advancements are expanding the applicability of in-pipe hydro systems to a wider range of applications and contexts, creating a strong market fit for sustainable and efficient energy generation from water flow.
Key Drivers of In-Pipe Hydro Systems Market Growth
Several factors are driving the expansion of the In-Pipe Hydro Systems market. Technological advancements are leading to higher efficiency and lower costs. Supportive government policies and incentives, such as tax breaks and renewable energy mandates, are promoting adoption. Increasing awareness of environmental sustainability and the need to reduce carbon emissions are further stimulating demand. The economic benefits associated with on-site renewable energy generation are also attracting significant interest from municipalities and industrial users.
Challenges in the In-Pipe Hydro Systems Market
Despite the significant growth potential, several challenges hinder the widespread adoption of in-pipe hydro systems. High initial investment costs can be a barrier for smaller projects. Regulatory hurdles and permitting processes can delay project implementation. The need for specialized installation and maintenance expertise can also pose a challenge. Supply chain disruptions and the availability of specialized components can impact project timelines and costs. Competition from other renewable energy technologies also presents a challenge. These factors are estimated to collectively impact market growth by approximately xx% over the next 5 years.
Emerging Opportunities in In-Pipe Hydro Systems Market
Significant opportunities exist for long-term growth in the In-Pipe Hydro Systems market. Technological advancements, such as the development of more durable and efficient turbines, are creating new possibilities. Strategic partnerships between technology providers and water management companies are fostering wider adoption. Expanding into new geographic markets, particularly in developing countries with growing urbanization and increasing energy demands, presents substantial opportunities. Innovative financing models and government support are also catalyzing market expansion.
Leading Players in the In-Pipe Hydro Systems Market Sector
- Natel Energy
- Leviathan Energy
- Tecnoturbines SL
- Xinda Green Energy Co Limited
- InPipe Energy
- HS Dynamic Energy Co Ltd
- GS-Hydro
- Rentricity Inc
- Lucid Energy Inc
Key Milestones in In-Pipe Hydro Systems Market Industry
- December 2023: InPipe Energy partners with EBMUD for the first California installation of its in-conduit hydroelectric system, marking a significant milestone in market expansion.
- July 2022: InPipe Energy launches the HydroXS, its latest generation micro-hydro energy recovery technology, enhancing market competitiveness and product offerings.
Strategic Outlook for In-Pipe Hydro Systems Market
The In-Pipe Hydro Systems market is poised for significant growth, driven by technological advancements, supportive policies, and increasing awareness of sustainable energy solutions. Strategic opportunities exist in developing innovative financing models, forging strategic partnerships, and expanding into new geographic markets. Focusing on optimizing system efficiency, reducing installation costs, and providing comprehensive lifecycle support will be crucial for maximizing market penetration and achieving long-term success. The future looks bright for this innovative sector with a projected market value exceeding xx Million by 2033.
In-Pipe Hydro Systems Market Segmentation
-
1. Application
- 1.1. Municipal Water or Wastewater Systems
- 1.2. Industrial Water Systems
- 1.3. Other Ap
-
2. Capacity
- 2.1. Pico-hydro (Up To 5kW)
- 2.2. Micro-hydro (Up To 100kW)
- 2.3. Mini-hydro (100kW and Above)
In-Pipe Hydro Systems Market Segmentation By Geography
-
1. North America
- 1.1. United States
- 1.2. Canada
- 1.3. Rest of North America
-
2. Asia Pacific
- 2.1. China
- 2.2. Japan
- 2.3. South Korea
- 2.4. India
- 2.5. Malaysia
- 2.6. Thailand
- 2.7. Indonesia
- 2.8. Vietnam
- 2.9. Rest of Asia Pacific
-
3. Europe
- 3.1. United Kingdom
- 3.2. Germany
- 3.3. France
- 3.4. Italy
- 3.5. Spain
- 3.6. Nordic Countries
- 3.7. Turkey
- 3.8. Russia
- 3.9. Rest of Europe
-
4. South America
- 4.1. Brazil
- 4.2. Argentina
- 4.3. Colombia
- 4.4. Rest of South America
-
5. Middle East and Africa
- 5.1. Saudi Arabia
- 5.2. United Arab Emirates
- 5.3. Nigeria
- 5.4. Qatar
- 5.5. Egypt
- 5.6. Rest of Middle East and Africa
In-Pipe Hydro Systems Market Regional Market Share
Geographic Coverage of In-Pipe Hydro Systems Market
In-Pipe Hydro Systems Market REPORT HIGHLIGHTS
| Aspects | Details |
|---|---|
| Study Period | 2020-2034 |
| Base Year | 2025 |
| Estimated Year | 2026 |
| Forecast Period | 2026-2034 |
| Historical Period | 2020-2025 |
| Growth Rate | CAGR of 3.87% from 2020-2034 |
| Segmentation |
|
Table of Contents
- 1. Introduction
- 1.1. Research Scope
- 1.2. Market Segmentation
- 1.3. Research Methodology
- 1.4. Definitions and Assumptions
- 2. Executive Summary
- 2.1. Introduction
- 3. Market Dynamics
- 3.1. Introduction
- 3.2. Market Drivers
- 3.2.1. Increased Focus on Renewable Power Generation4.; Rising Need for Efficient Power Generation
- 3.3. Market Restrains
- 3.3.1. High Initial Capital Investment
- 3.4. Market Trends
- 3.4.1. Industrial Water Systems to Witness Significant Demand
- 4. Market Factor Analysis
- 4.1. Porters Five Forces
- 4.2. Supply/Value Chain
- 4.3. PESTEL analysis
- 4.4. Market Entropy
- 4.5. Patent/Trademark Analysis
- 5. Global In-Pipe Hydro Systems Market Analysis, Insights and Forecast, 2020-2032
- 5.1. Market Analysis, Insights and Forecast - by Application
- 5.1.1. Municipal Water or Wastewater Systems
- 5.1.2. Industrial Water Systems
- 5.1.3. Other Ap
- 5.2. Market Analysis, Insights and Forecast - by Capacity
- 5.2.1. Pico-hydro (Up To 5kW)
- 5.2.2. Micro-hydro (Up To 100kW)
- 5.2.3. Mini-hydro (100kW and Above)
- 5.3. Market Analysis, Insights and Forecast - by Region
- 5.3.1. North America
- 5.3.2. Asia Pacific
- 5.3.3. Europe
- 5.3.4. South America
- 5.3.5. Middle East and Africa
- 5.1. Market Analysis, Insights and Forecast - by Application
- 6. North America In-Pipe Hydro Systems Market Analysis, Insights and Forecast, 2020-2032
- 6.1. Market Analysis, Insights and Forecast - by Application
- 6.1.1. Municipal Water or Wastewater Systems
- 6.1.2. Industrial Water Systems
- 6.1.3. Other Ap
- 6.2. Market Analysis, Insights and Forecast - by Capacity
- 6.2.1. Pico-hydro (Up To 5kW)
- 6.2.2. Micro-hydro (Up To 100kW)
- 6.2.3. Mini-hydro (100kW and Above)
- 6.1. Market Analysis, Insights and Forecast - by Application
- 7. Asia Pacific In-Pipe Hydro Systems Market Analysis, Insights and Forecast, 2020-2032
- 7.1. Market Analysis, Insights and Forecast - by Application
- 7.1.1. Municipal Water or Wastewater Systems
- 7.1.2. Industrial Water Systems
- 7.1.3. Other Ap
- 7.2. Market Analysis, Insights and Forecast - by Capacity
- 7.2.1. Pico-hydro (Up To 5kW)
- 7.2.2. Micro-hydro (Up To 100kW)
- 7.2.3. Mini-hydro (100kW and Above)
- 7.1. Market Analysis, Insights and Forecast - by Application
- 8. Europe In-Pipe Hydro Systems Market Analysis, Insights and Forecast, 2020-2032
- 8.1. Market Analysis, Insights and Forecast - by Application
- 8.1.1. Municipal Water or Wastewater Systems
- 8.1.2. Industrial Water Systems
- 8.1.3. Other Ap
- 8.2. Market Analysis, Insights and Forecast - by Capacity
- 8.2.1. Pico-hydro (Up To 5kW)
- 8.2.2. Micro-hydro (Up To 100kW)
- 8.2.3. Mini-hydro (100kW and Above)
- 8.1. Market Analysis, Insights and Forecast - by Application
- 9. South America In-Pipe Hydro Systems Market Analysis, Insights and Forecast, 2020-2032
- 9.1. Market Analysis, Insights and Forecast - by Application
- 9.1.1. Municipal Water or Wastewater Systems
- 9.1.2. Industrial Water Systems
- 9.1.3. Other Ap
- 9.2. Market Analysis, Insights and Forecast - by Capacity
- 9.2.1. Pico-hydro (Up To 5kW)
- 9.2.2. Micro-hydro (Up To 100kW)
- 9.2.3. Mini-hydro (100kW and Above)
- 9.1. Market Analysis, Insights and Forecast - by Application
- 10. Middle East and Africa In-Pipe Hydro Systems Market Analysis, Insights and Forecast, 2020-2032
- 10.1. Market Analysis, Insights and Forecast - by Application
- 10.1.1. Municipal Water or Wastewater Systems
- 10.1.2. Industrial Water Systems
- 10.1.3. Other Ap
- 10.2. Market Analysis, Insights and Forecast - by Capacity
- 10.2.1. Pico-hydro (Up To 5kW)
- 10.2.2. Micro-hydro (Up To 100kW)
- 10.2.3. Mini-hydro (100kW and Above)
- 10.1. Market Analysis, Insights and Forecast - by Application
- 11. Competitive Analysis
- 11.1. Global Market Share Analysis 2025
- 11.2. Company Profiles
- 11.2.1 Natel Energy
- 11.2.1.1. Overview
- 11.2.1.2. Products
- 11.2.1.3. SWOT Analysis
- 11.2.1.4. Recent Developments
- 11.2.1.5. Financials (Based on Availability)
- 11.2.2 Leviathan Energy
- 11.2.2.1. Overview
- 11.2.2.2. Products
- 11.2.2.3. SWOT Analysis
- 11.2.2.4. Recent Developments
- 11.2.2.5. Financials (Based on Availability)
- 11.2.3 Tecnoturbines SL
- 11.2.3.1. Overview
- 11.2.3.2. Products
- 11.2.3.3. SWOT Analysis
- 11.2.3.4. Recent Developments
- 11.2.3.5. Financials (Based on Availability)
- 11.2.4 Xinda Green Energy Co Limited
- 11.2.4.1. Overview
- 11.2.4.2. Products
- 11.2.4.3. SWOT Analysis
- 11.2.4.4. Recent Developments
- 11.2.4.5. Financials (Based on Availability)
- 11.2.5 InPipe Energy
- 11.2.5.1. Overview
- 11.2.5.2. Products
- 11.2.5.3. SWOT Analysis
- 11.2.5.4. Recent Developments
- 11.2.5.5. Financials (Based on Availability)
- 11.2.6 HS Dynamic Energy Co Ltd
- 11.2.6.1. Overview
- 11.2.6.2. Products
- 11.2.6.3. SWOT Analysis
- 11.2.6.4. Recent Developments
- 11.2.6.5. Financials (Based on Availability)
- 11.2.7 GS-Hydro
- 11.2.7.1. Overview
- 11.2.7.2. Products
- 11.2.7.3. SWOT Analysis
- 11.2.7.4. Recent Developments
- 11.2.7.5. Financials (Based on Availability)
- 11.2.8 Rentricity Inc
- 11.2.8.1. Overview
- 11.2.8.2. Products
- 11.2.8.3. SWOT Analysis
- 11.2.8.4. Recent Developments
- 11.2.8.5. Financials (Based on Availability)
- 11.2.9 Lucid Energy Inc
- 11.2.9.1. Overview
- 11.2.9.2. Products
- 11.2.9.3. SWOT Analysis
- 11.2.9.4. Recent Developments
- 11.2.9.5. Financials (Based on Availability)
- 11.2.1 Natel Energy
List of Figures
- Figure 1: Global In-Pipe Hydro Systems Market Revenue Breakdown (Million, %) by Region 2025 & 2033
- Figure 2: North America In-Pipe Hydro Systems Market Revenue (Million), by Application 2025 & 2033
- Figure 3: North America In-Pipe Hydro Systems Market Revenue Share (%), by Application 2025 & 2033
- Figure 4: North America In-Pipe Hydro Systems Market Revenue (Million), by Capacity 2025 & 2033
- Figure 5: North America In-Pipe Hydro Systems Market Revenue Share (%), by Capacity 2025 & 2033
- Figure 6: North America In-Pipe Hydro Systems Market Revenue (Million), by Country 2025 & 2033
- Figure 7: North America In-Pipe Hydro Systems Market Revenue Share (%), by Country 2025 & 2033
- Figure 8: Asia Pacific In-Pipe Hydro Systems Market Revenue (Million), by Application 2025 & 2033
- Figure 9: Asia Pacific In-Pipe Hydro Systems Market Revenue Share (%), by Application 2025 & 2033
- Figure 10: Asia Pacific In-Pipe Hydro Systems Market Revenue (Million), by Capacity 2025 & 2033
- Figure 11: Asia Pacific In-Pipe Hydro Systems Market Revenue Share (%), by Capacity 2025 & 2033
- Figure 12: Asia Pacific In-Pipe Hydro Systems Market Revenue (Million), by Country 2025 & 2033
- Figure 13: Asia Pacific In-Pipe Hydro Systems Market Revenue Share (%), by Country 2025 & 2033
- Figure 14: Europe In-Pipe Hydro Systems Market Revenue (Million), by Application 2025 & 2033
- Figure 15: Europe In-Pipe Hydro Systems Market Revenue Share (%), by Application 2025 & 2033
- Figure 16: Europe In-Pipe Hydro Systems Market Revenue (Million), by Capacity 2025 & 2033
- Figure 17: Europe In-Pipe Hydro Systems Market Revenue Share (%), by Capacity 2025 & 2033
- Figure 18: Europe In-Pipe Hydro Systems Market Revenue (Million), by Country 2025 & 2033
- Figure 19: Europe In-Pipe Hydro Systems Market Revenue Share (%), by Country 2025 & 2033
- Figure 20: South America In-Pipe Hydro Systems Market Revenue (Million), by Application 2025 & 2033
- Figure 21: South America In-Pipe Hydro Systems Market Revenue Share (%), by Application 2025 & 2033
- Figure 22: South America In-Pipe Hydro Systems Market Revenue (Million), by Capacity 2025 & 2033
- Figure 23: South America In-Pipe Hydro Systems Market Revenue Share (%), by Capacity 2025 & 2033
- Figure 24: South America In-Pipe Hydro Systems Market Revenue (Million), by Country 2025 & 2033
- Figure 25: South America In-Pipe Hydro Systems Market Revenue Share (%), by Country 2025 & 2033
- Figure 26: Middle East and Africa In-Pipe Hydro Systems Market Revenue (Million), by Application 2025 & 2033
- Figure 27: Middle East and Africa In-Pipe Hydro Systems Market Revenue Share (%), by Application 2025 & 2033
- Figure 28: Middle East and Africa In-Pipe Hydro Systems Market Revenue (Million), by Capacity 2025 & 2033
- Figure 29: Middle East and Africa In-Pipe Hydro Systems Market Revenue Share (%), by Capacity 2025 & 2033
- Figure 30: Middle East and Africa In-Pipe Hydro Systems Market Revenue (Million), by Country 2025 & 2033
- Figure 31: Middle East and Africa In-Pipe Hydro Systems Market Revenue Share (%), by Country 2025 & 2033
List of Tables
- Table 1: Global In-Pipe Hydro Systems Market Revenue Million Forecast, by Application 2020 & 2033
- Table 2: Global In-Pipe Hydro Systems Market Revenue Million Forecast, by Capacity 2020 & 2033
- Table 3: Global In-Pipe Hydro Systems Market Revenue Million Forecast, by Region 2020 & 2033
- Table 4: Global In-Pipe Hydro Systems Market Revenue Million Forecast, by Application 2020 & 2033
- Table 5: Global In-Pipe Hydro Systems Market Revenue Million Forecast, by Capacity 2020 & 2033
- Table 6: Global In-Pipe Hydro Systems Market Revenue Million Forecast, by Country 2020 & 2033
- Table 7: United States In-Pipe Hydro Systems Market Revenue (Million) Forecast, by Application 2020 & 2033
- Table 8: Canada In-Pipe Hydro Systems Market Revenue (Million) Forecast, by Application 2020 & 2033
- Table 9: Rest of North America In-Pipe Hydro Systems Market Revenue (Million) Forecast, by Application 2020 & 2033
- Table 10: Global In-Pipe Hydro Systems Market Revenue Million Forecast, by Application 2020 & 2033
- Table 11: Global In-Pipe Hydro Systems Market Revenue Million Forecast, by Capacity 2020 & 2033
- Table 12: Global In-Pipe Hydro Systems Market Revenue Million Forecast, by Country 2020 & 2033
- Table 13: China In-Pipe Hydro Systems Market Revenue (Million) Forecast, by Application 2020 & 2033
- Table 14: Japan In-Pipe Hydro Systems Market Revenue (Million) Forecast, by Application 2020 & 2033
- Table 15: South Korea In-Pipe Hydro Systems Market Revenue (Million) Forecast, by Application 2020 & 2033
- Table 16: India In-Pipe Hydro Systems Market Revenue (Million) Forecast, by Application 2020 & 2033
- Table 17: Malaysia In-Pipe Hydro Systems Market Revenue (Million) Forecast, by Application 2020 & 2033
- Table 18: Thailand In-Pipe Hydro Systems Market Revenue (Million) Forecast, by Application 2020 & 2033
- Table 19: Indonesia In-Pipe Hydro Systems Market Revenue (Million) Forecast, by Application 2020 & 2033
- Table 20: Vietnam In-Pipe Hydro Systems Market Revenue (Million) Forecast, by Application 2020 & 2033
- Table 21: Rest of Asia Pacific In-Pipe Hydro Systems Market Revenue (Million) Forecast, by Application 2020 & 2033
- Table 22: Global In-Pipe Hydro Systems Market Revenue Million Forecast, by Application 2020 & 2033
- Table 23: Global In-Pipe Hydro Systems Market Revenue Million Forecast, by Capacity 2020 & 2033
- Table 24: Global In-Pipe Hydro Systems Market Revenue Million Forecast, by Country 2020 & 2033
- Table 25: United Kingdom In-Pipe Hydro Systems Market Revenue (Million) Forecast, by Application 2020 & 2033
- Table 26: Germany In-Pipe Hydro Systems Market Revenue (Million) Forecast, by Application 2020 & 2033
- Table 27: France In-Pipe Hydro Systems Market Revenue (Million) Forecast, by Application 2020 & 2033
- Table 28: Italy In-Pipe Hydro Systems Market Revenue (Million) Forecast, by Application 2020 & 2033
- Table 29: Spain In-Pipe Hydro Systems Market Revenue (Million) Forecast, by Application 2020 & 2033
- Table 30: Nordic Countries In-Pipe Hydro Systems Market Revenue (Million) Forecast, by Application 2020 & 2033
- Table 31: Turkey In-Pipe Hydro Systems Market Revenue (Million) Forecast, by Application 2020 & 2033
- Table 32: Russia In-Pipe Hydro Systems Market Revenue (Million) Forecast, by Application 2020 & 2033
- Table 33: Rest of Europe In-Pipe Hydro Systems Market Revenue (Million) Forecast, by Application 2020 & 2033
- Table 34: Global In-Pipe Hydro Systems Market Revenue Million Forecast, by Application 2020 & 2033
- Table 35: Global In-Pipe Hydro Systems Market Revenue Million Forecast, by Capacity 2020 & 2033
- Table 36: Global In-Pipe Hydro Systems Market Revenue Million Forecast, by Country 2020 & 2033
- Table 37: Brazil In-Pipe Hydro Systems Market Revenue (Million) Forecast, by Application 2020 & 2033
- Table 38: Argentina In-Pipe Hydro Systems Market Revenue (Million) Forecast, by Application 2020 & 2033
- Table 39: Colombia In-Pipe Hydro Systems Market Revenue (Million) Forecast, by Application 2020 & 2033
- Table 40: Rest of South America In-Pipe Hydro Systems Market Revenue (Million) Forecast, by Application 2020 & 2033
- Table 41: Global In-Pipe Hydro Systems Market Revenue Million Forecast, by Application 2020 & 2033
- Table 42: Global In-Pipe Hydro Systems Market Revenue Million Forecast, by Capacity 2020 & 2033
- Table 43: Global In-Pipe Hydro Systems Market Revenue Million Forecast, by Country 2020 & 2033
- Table 44: Saudi Arabia In-Pipe Hydro Systems Market Revenue (Million) Forecast, by Application 2020 & 2033
- Table 45: United Arab Emirates In-Pipe Hydro Systems Market Revenue (Million) Forecast, by Application 2020 & 2033
- Table 46: Nigeria In-Pipe Hydro Systems Market Revenue (Million) Forecast, by Application 2020 & 2033
- Table 47: Qatar In-Pipe Hydro Systems Market Revenue (Million) Forecast, by Application 2020 & 2033
- Table 48: Egypt In-Pipe Hydro Systems Market Revenue (Million) Forecast, by Application 2020 & 2033
- Table 49: Rest of Middle East and Africa In-Pipe Hydro Systems Market Revenue (Million) Forecast, by Application 2020 & 2033
Frequently Asked Questions
1. What is the projected Compound Annual Growth Rate (CAGR) of the In-Pipe Hydro Systems Market?
The projected CAGR is approximately 3.87%.
2. Which companies are prominent players in the In-Pipe Hydro Systems Market?
Key companies in the market include Natel Energy, Leviathan Energy, Tecnoturbines SL, Xinda Green Energy Co Limited, InPipe Energy, HS Dynamic Energy Co Ltd, GS-Hydro, Rentricity Inc, Lucid Energy Inc.
3. What are the main segments of the In-Pipe Hydro Systems Market?
The market segments include Application, Capacity.
4. Can you provide details about the market size?
The market size is estimated to be USD 109.34 Million as of 2022.
5. What are some drivers contributing to market growth?
Increased Focus on Renewable Power Generation4.; Rising Need for Efficient Power Generation.
6. What are the notable trends driving market growth?
Industrial Water Systems to Witness Significant Demand.
7. Are there any restraints impacting market growth?
High Initial Capital Investment.
8. Can you provide examples of recent developments in the market?
December 2023: The East Bay Municipal Utility District (EBMUD) partnered with InPipe Energy to generate electricity from the flow of water in its water distribution system. According to a release, this is the first installation of the InPipe technology in California. The new in-conduit hydroelectric system works similarly to traditional pressure-regulating valves in EBMUD’s water distribution system. However, it uses a turbine to reduce water pressure while generating electricity and creating a reliable, clean source of power.
9. What pricing options are available for accessing the report?
Pricing options include single-user, multi-user, and enterprise licenses priced at USD 4750, USD 5250, and USD 8750 respectively.
10. Is the market size provided in terms of value or volume?
The market size is provided in terms of value, measured in Million.
11. Are there any specific market keywords associated with the report?
Yes, the market keyword associated with the report is "In-Pipe Hydro Systems Market," which aids in identifying and referencing the specific market segment covered.
12. How do I determine which pricing option suits my needs best?
The pricing options vary based on user requirements and access needs. Individual users may opt for single-user licenses, while businesses requiring broader access may choose multi-user or enterprise licenses for cost-effective access to the report.
13. Are there any additional resources or data provided in the In-Pipe Hydro Systems Market report?
While the report offers comprehensive insights, it's advisable to review the specific contents or supplementary materials provided to ascertain if additional resources or data are available.
14. How can I stay updated on further developments or reports in the In-Pipe Hydro Systems Market?
To stay informed about further developments, trends, and reports in the In-Pipe Hydro Systems Market, consider subscribing to industry newsletters, following relevant companies and organizations, or regularly checking reputable industry news sources and publications.
Methodology
Step 1 - Identification of Relevant Samples Size from Population Database


Step 2 - Approaches for Defining Global Market Size (Value, Volume* & Price*)

Note*: In applicable scenarios
Step 3 - Data Sources
Primary Research
- Web Analytics
- Survey Reports
- Research Institute
- Latest Research Reports
- Opinion Leaders
Secondary Research
- Annual Reports
- White Paper
- Latest Press Release
- Industry Association
- Paid Database
- Investor Presentations

Step 4 - Data Triangulation
Involves using different sources of information in order to increase the validity of a study
These sources are likely to be stakeholders in a program - participants, other researchers, program staff, other community members, and so on.
Then we put all data in single framework & apply various statistical tools to find out the dynamic on the market.
During the analysis stage, feedback from the stakeholder groups would be compared to determine areas of agreement as well as areas of divergence