

Key Insights
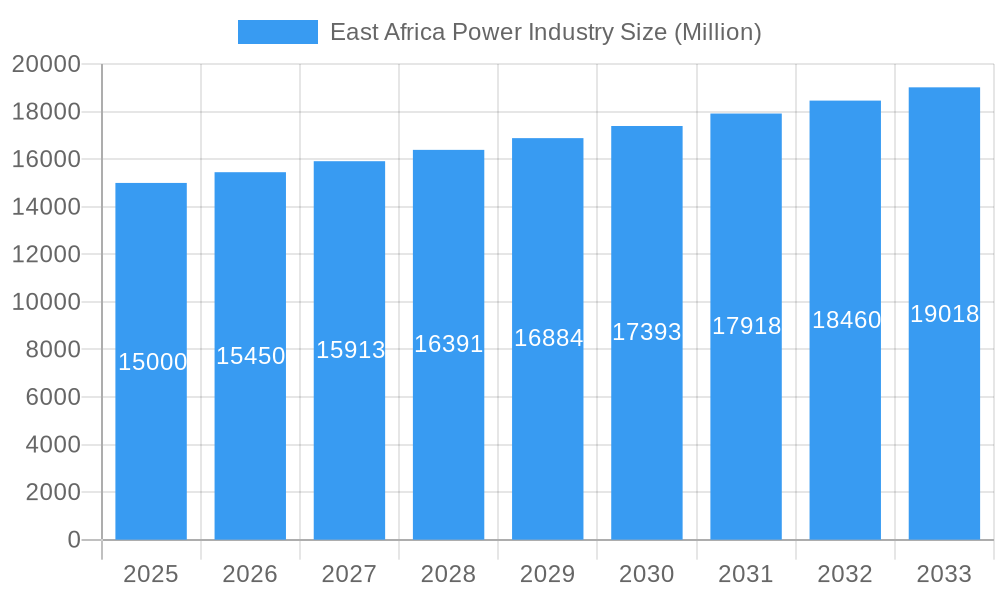
The East African power industry is experiencing significant expansion, propelled by increasing urbanization, industrialization, and escalating energy demands across residential, commercial, and industrial sectors. A compound annual growth rate (CAGR) of 4.7% from 2024 to 2033 indicates substantial market growth, projected to reach $21.99 billion by 2033. Key growth drivers include government initiatives supporting renewable energy sources such as hydro and solar power, aimed at diversifying energy generation and bolstering energy security. Investments in power transmission and distribution infrastructure further stimulate growth by enhancing grid reliability and expanding electricity access in underserved regions. However, persistent challenges include evolving regulatory frameworks, limited financing for large-scale projects, and the critical need for improved grid stability. The market is segmented by power generation (with hydro and non-hydro renewables playing a pivotal role), transmission and distribution, and end-user sectors. Leading market participants comprise national electricity utilities like Kenya Power and Lighting Company PLC, Tanzania Electric Supply Company, and Uganda Electricity Transmission Company Limited, alongside numerous regional transmission and distribution companies. The considerable growth potential is attracting significant domestic and international investment, with a focus on renewable energy projects and grid modernization. South Africa, due to its advanced infrastructure and economic influence, holds a dominant share of the regional market.
East Africa Power Industry Market Size (In Billion)
Continued advancement in the East African power industry is contingent upon overcoming existing limitations. This includes optimizing existing power plant efficiency, cultivating public-private partnerships for large-scale infrastructure development, and investing in smart grid technologies to enhance network efficiency and minimize transmission losses. The growing adoption of renewable energy, supported by governmental policies for sustainable energy projects, paints a positive sector outlook. This transition necessitates further investment in energy storage solutions and grid modernization to mitigate the intermittency challenges associated with renewable energy. The successful integration of distributed generation technologies, particularly in rural areas, offers a substantial opportunity to improve electrification across the region and foster inclusive economic growth. Prioritizing sustainable practices and developing climate-resilient infrastructure will be crucial for ensuring the long-term viability and sustainability of the East African power industry.
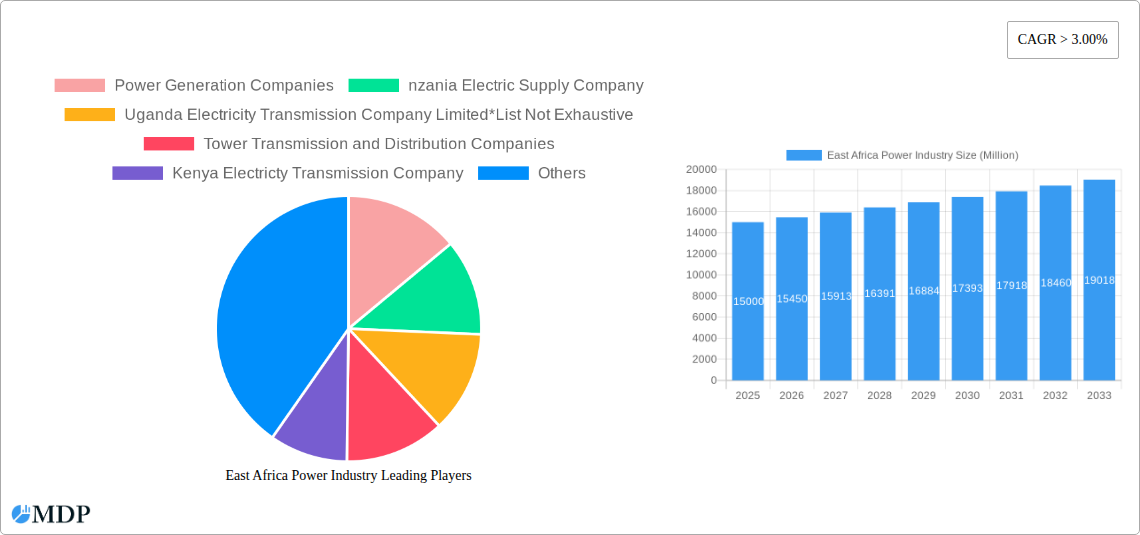
East Africa Power Industry Company Market Share
East Africa Power Industry: Market Analysis & Forecast (2024-2033)
This comprehensive report offers an in-depth analysis of the East African power industry, examining market dynamics, emerging trends, key players, and future growth prospects. Covering the period 2024-2033, with a base year of 2024 and a forecast period extending to 2033, this report serves as an essential resource for investors, industry stakeholders, and strategic decision-makers. The analysis is built upon extensive market research and data analytics, providing actionable insights for navigating this dynamic sector.
East Africa Power Industry Market Dynamics & Concentration
This section analyzes the competitive landscape of the East African power industry, exploring market concentration, innovation, regulatory frameworks, and market forces. The analysis covers the period from 2019 to 2024, providing historical context for future projections.
The East African power market demonstrates a moderately concentrated structure with a few dominant players and several smaller regional operators. Market share data reveals that Kenya Power and Lighting Company PLC and Tanzania Electric Supply Company (TANESCO) hold significant shares, exceeding xx% collectively. This dominance is attributed to their extensive infrastructure and established customer bases. However, increasing private sector participation and investments in renewable energy are gradually shifting the dynamics.
- Market Concentration: xx% of the market is controlled by the top 5 players.
- Innovation Drivers: Growing demand for reliable and affordable electricity, coupled with government initiatives promoting renewable energy, drives innovation in power generation and distribution technologies.
- Regulatory Frameworks: Varying regulatory environments across different East African countries impact market entry and investment decisions. Streamlining regulations and improving regulatory clarity are key factors for growth.
- Product Substitutes: While limited, distributed generation solutions such as rooftop solar PV systems present a growing substitute for grid-supplied electricity, particularly in remote areas.
- End-User Trends: The industrial sector is the largest consumer of electricity, followed by the commercial and residential sectors. Demand is expected to grow significantly across all segments due to rising populations and economic growth.
- M&A Activities: The number of M&A deals in the sector has increased gradually over the past five years, with xx deals recorded in 2024. These activities highlight the ongoing consolidation and strategic investments in the industry.
East Africa Power Industry Industry Trends & Analysis
This section offers a detailed analysis of the key trends shaping the East African power industry, including market growth drivers, technological advancements, evolving consumer preferences, and competitive dynamics. The analysis provides a comprehensive overview of the industry's trajectory from 2019 to 2024 and projects future growth based on several factors.
The East African power market is projected to experience robust growth over the forecast period (2025-2033). This growth is primarily driven by increasing industrialization, expanding urbanization, and a rising population. The sector's CAGR is expected to be xx% during this period. The increasing adoption of renewable energy technologies, supported by government policies, significantly contributes to this growth. However, challenges such as infrastructure gaps and fluctuating fuel prices pose significant challenges. Consumer preferences are shifting toward cleaner and more sustainable energy sources, influencing the market's transition towards renewable energy. The increased competition, particularly from independent power producers (IPPs), is driving innovation and efficiency improvements. Market penetration of renewable energy sources is expected to reach xx% by 2033.
Leading Markets & Segments in East Africa Power Industry
This section identifies and analyzes the dominant regions, countries, and segments within the East African power industry. The analysis is categorized by sector (Power Generation, Hydro and Non-Hydro Renewables, Power Transmission and Distribution) and end-user (Residential, Commercial, Industrial).
- Dominant Region/Country: Kenya and Tanzania represent the largest markets due to their advanced infrastructure and higher electricity consumption.
- Dominant Segment: Power generation is the largest segment. Within generation, Hydro and geothermal power currently dominate but Non-Hydro Renewables, particularly solar and wind, are experiencing rapid growth. Kenya's commitment to geothermal energy and its substantial investment are driving its dominance in this area.
Key Drivers:
- Economic Policies: Government support for renewable energy development and investment incentives.
- Infrastructure Development: Investments in transmission and distribution infrastructure are enhancing grid reliability.
- Population Growth: Rising populations in urban centers are creating higher demand for electricity.
The dominance analysis shows a correlation between economic growth, investment in infrastructure, and the size of each segment. Kenya’s active investment in geothermal power generation contributes to its leading position in the Power Generation segment. The expansion of transmission networks in Tanzania and Kenya supports their dominance in the transmission and distribution segment.
East Africa Power Industry Product Developments
The East African power industry is witnessing significant product innovations, primarily driven by advancements in renewable energy technologies. Smart grid technologies, improved energy storage solutions, and advanced metering infrastructure (AMI) are gaining traction, enhancing grid efficiency and reliability. These innovations are improving the sector's competitiveness and sustainability. The market fit for these products is strong due to increasing demand for reliable and affordable energy.
Key Drivers of East Africa Power Industry Growth
Several factors drive the growth of the East African power industry. Government initiatives promoting renewable energy development and investments in transmission and distribution infrastructure play a key role. The expanding industrialization and increasing urbanization are driving electricity demand. Technological advancements in renewable energy technologies and energy storage solutions further propel the market's expansion.
Challenges in the East Africa Power Industry Market
The East African power sector faces challenges, including regulatory complexities, limited access to finance, and infrastructure constraints. The lack of sufficient grid infrastructure in some areas hinders the expansion of renewable energy projects. These challenges directly impact the cost and reliability of electricity supply, impeding economic growth. Power losses due to aging infrastructure remain a significant hurdle. Competition from new entrants, especially in the renewable energy sector, can impact market share. The combined impact of these factors results in xx Million in lost revenue annually.
Emerging Opportunities in East Africa Power Industry
The East African power industry presents significant long-term growth opportunities. Technological breakthroughs in renewable energy, particularly advancements in storage solutions and cost reductions in solar and wind technologies, open new avenues for market expansion. Strategic partnerships between international investors and local players can unlock capital and expertise, driving large-scale projects. Furthermore, regional cooperation and cross-border power trading initiatives create opportunities for market growth.
Leading Players in the East Africa Power Industry Sector
- Kenya Power and Lighting Company PLC
- Kenya Electricity Generating Company Plc
- Tanzania Electric Supply Company (TANESCO)
- Uganda Electricity Transmission Company Limited
- Ethiopian Electric Company
- Uganda Electricity Generation Company Limited
- Tower Transmission and Distribution Companies
Key Milestones in East Africa Power Industry Industry
- September 2021: Safaricom's USD 300 Million smart meter proposal to Kenya Power to reduce power losses.
- November 2020: Kenya Electricity Generating Company PLC unveils a renewable energy project pipeline to support economic growth, including the Olkaria 1 Unit 6 geothermal plant (83.3 MW).
Strategic Outlook for East Africa Power Industry Market
The East African power industry holds immense growth potential, driven by strong economic growth, population increase, and a transition towards renewable energy. Strategic investments in infrastructure development, particularly in transmission and distribution networks, will be crucial. Collaborative efforts between governments, private sector players, and international development partners will be essential for maximizing the sector's potential and ensuring sustainable and affordable energy access for all.
East Africa Power Industry Segmentation
-
1. Sector
-
1.1. Power Generation
- 1.1.1. Thermal
- 1.1.2. Hydro and Non-Hydro Renewables
- 1.2. Power Transmission and Distribution
-
1.1. Power Generation
-
2. Geography
- 2.1. Kenya
- 2.2. Ethiopia
- 2.3. Tanzania
- 2.4. Uganda
- 2.5. Rest of East Africa
East Africa Power Industry Segmentation By Geography
- 1. Kenya
- 2. Ethiopia
- 3. Tanzania
- 4. Uganda
- 5. Rest of East Africa
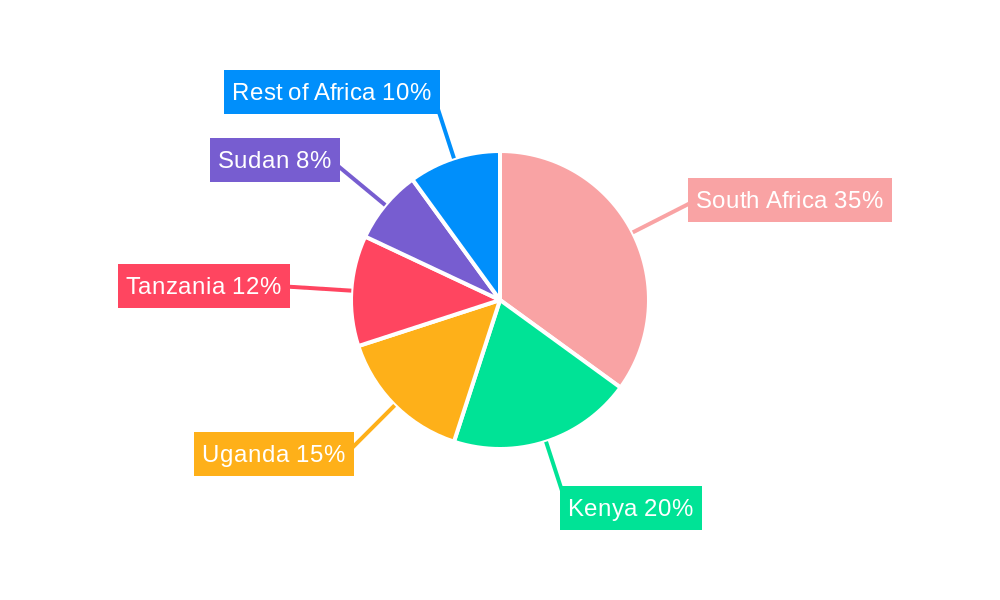
East Africa Power Industry Regional Market Share
Geographic Coverage of East Africa Power Industry
East Africa Power Industry REPORT HIGHLIGHTS
| Aspects | Details |
|---|---|
| Study Period | 2020-2034 |
| Base Year | 2025 |
| Estimated Year | 2026 |
| Forecast Period | 2026-2034 |
| Historical Period | 2020-2025 |
| Growth Rate | CAGR of 4.7% from 2020-2034 |
| Segmentation |
|
Table of Contents
- 1. Introduction
- 1.1. Research Scope
- 1.2. Market Segmentation
- 1.3. Research Methodology
- 1.4. Definitions and Assumptions
- 2. Executive Summary
- 2.1. Introduction
- 3. Market Dynamics
- 3.1. Introduction
- 3.2. Market Drivers
- 3.2.1. 4.; Expanding Pipeline Infrastructure4.; Growing Energy Demand
- 3.3. Market Restrains
- 3.3.1. 4.; Political Instability and Militant Attacks on Pipeline Infrastructure
- 3.4. Market Trends
- 3.4.1. Hydro and Non-Hydro Renewables are Expected to Witness Significant Growth
- 4. Market Factor Analysis
- 4.1. Porters Five Forces
- 4.2. Supply/Value Chain
- 4.3. PESTEL analysis
- 4.4. Market Entropy
- 4.5. Patent/Trademark Analysis
- 5. East Africa Power Industry Analysis, Insights and Forecast, 2020-2032
- 5.1. Market Analysis, Insights and Forecast - by Sector
- 5.1.1. Power Generation
- 5.1.1.1. Thermal
- 5.1.1.2. Hydro and Non-Hydro Renewables
- 5.1.2. Power Transmission and Distribution
- 5.1.1. Power Generation
- 5.2. Market Analysis, Insights and Forecast - by Geography
- 5.2.1. Kenya
- 5.2.2. Ethiopia
- 5.2.3. Tanzania
- 5.2.4. Uganda
- 5.2.5. Rest of East Africa
- 5.3. Market Analysis, Insights and Forecast - by Region
- 5.3.1. Kenya
- 5.3.2. Ethiopia
- 5.3.3. Tanzania
- 5.3.4. Uganda
- 5.3.5. Rest of East Africa
- 5.1. Market Analysis, Insights and Forecast - by Sector
- 6. Kenya East Africa Power Industry Analysis, Insights and Forecast, 2020-2032
- 6.1. Market Analysis, Insights and Forecast - by Sector
- 6.1.1. Power Generation
- 6.1.1.1. Thermal
- 6.1.1.2. Hydro and Non-Hydro Renewables
- 6.1.2. Power Transmission and Distribution
- 6.1.1. Power Generation
- 6.2. Market Analysis, Insights and Forecast - by Geography
- 6.2.1. Kenya
- 6.2.2. Ethiopia
- 6.2.3. Tanzania
- 6.2.4. Uganda
- 6.2.5. Rest of East Africa
- 6.1. Market Analysis, Insights and Forecast - by Sector
- 7. Ethiopia East Africa Power Industry Analysis, Insights and Forecast, 2020-2032
- 7.1. Market Analysis, Insights and Forecast - by Sector
- 7.1.1. Power Generation
- 7.1.1.1. Thermal
- 7.1.1.2. Hydro and Non-Hydro Renewables
- 7.1.2. Power Transmission and Distribution
- 7.1.1. Power Generation
- 7.2. Market Analysis, Insights and Forecast - by Geography
- 7.2.1. Kenya
- 7.2.2. Ethiopia
- 7.2.3. Tanzania
- 7.2.4. Uganda
- 7.2.5. Rest of East Africa
- 7.1. Market Analysis, Insights and Forecast - by Sector
- 8. Tanzania East Africa Power Industry Analysis, Insights and Forecast, 2020-2032
- 8.1. Market Analysis, Insights and Forecast - by Sector
- 8.1.1. Power Generation
- 8.1.1.1. Thermal
- 8.1.1.2. Hydro and Non-Hydro Renewables
- 8.1.2. Power Transmission and Distribution
- 8.1.1. Power Generation
- 8.2. Market Analysis, Insights and Forecast - by Geography
- 8.2.1. Kenya
- 8.2.2. Ethiopia
- 8.2.3. Tanzania
- 8.2.4. Uganda
- 8.2.5. Rest of East Africa
- 8.1. Market Analysis, Insights and Forecast - by Sector
- 9. Uganda East Africa Power Industry Analysis, Insights and Forecast, 2020-2032
- 9.1. Market Analysis, Insights and Forecast - by Sector
- 9.1.1. Power Generation
- 9.1.1.1. Thermal
- 9.1.1.2. Hydro and Non-Hydro Renewables
- 9.1.2. Power Transmission and Distribution
- 9.1.1. Power Generation
- 9.2. Market Analysis, Insights and Forecast - by Geography
- 9.2.1. Kenya
- 9.2.2. Ethiopia
- 9.2.3. Tanzania
- 9.2.4. Uganda
- 9.2.5. Rest of East Africa
- 9.1. Market Analysis, Insights and Forecast - by Sector
- 10. Rest of East Africa East Africa Power Industry Analysis, Insights and Forecast, 2020-2032
- 10.1. Market Analysis, Insights and Forecast - by Sector
- 10.1.1. Power Generation
- 10.1.1.1. Thermal
- 10.1.1.2. Hydro and Non-Hydro Renewables
- 10.1.2. Power Transmission and Distribution
- 10.1.1. Power Generation
- 10.2. Market Analysis, Insights and Forecast - by Geography
- 10.2.1. Kenya
- 10.2.2. Ethiopia
- 10.2.3. Tanzania
- 10.2.4. Uganda
- 10.2.5. Rest of East Africa
- 10.1. Market Analysis, Insights and Forecast - by Sector
- 11. Competitive Analysis
- 11.1. Market Share Analysis 2025
- 11.2. Company Profiles
- 11.2.1 Power Generation Companies
- 11.2.1.1. Overview
- 11.2.1.2. Products
- 11.2.1.3. SWOT Analysis
- 11.2.1.4. Recent Developments
- 11.2.1.5. Financials (Based on Availability)
- 11.2.2 nzania Electric Supply Company
- 11.2.2.1. Overview
- 11.2.2.2. Products
- 11.2.2.3. SWOT Analysis
- 11.2.2.4. Recent Developments
- 11.2.2.5. Financials (Based on Availability)
- 11.2.3 Uganda Electricity Transmission Company Limited*List Not Exhaustive
- 11.2.3.1. Overview
- 11.2.3.2. Products
- 11.2.3.3. SWOT Analysis
- 11.2.3.4. Recent Developments
- 11.2.3.5. Financials (Based on Availability)
- 11.2.4 Tower Transmission and Distribution Companies
- 11.2.4.1. Overview
- 11.2.4.2. Products
- 11.2.4.3. SWOT Analysis
- 11.2.4.4. Recent Developments
- 11.2.4.5. Financials (Based on Availability)
- 11.2.5 Kenya Electricty Transmission Company
- 11.2.5.1. Overview
- 11.2.5.2. Products
- 11.2.5.3. SWOT Analysis
- 11.2.5.4. Recent Developments
- 11.2.5.5. Financials (Based on Availability)
- 11.2.6 hiopian Electric Company
- 11.2.6.1. Overview
- 11.2.6.2. Products
- 11.2.6.3. SWOT Analysis
- 11.2.6.4. Recent Developments
- 11.2.6.5. Financials (Based on Availability)
- 11.2.7 Uganda Electricity Generation Company Limited
- 11.2.7.1. Overview
- 11.2.7.2. Products
- 11.2.7.3. SWOT Analysis
- 11.2.7.4. Recent Developments
- 11.2.7.5. Financials (Based on Availability)
- 11.2.8 Kenya Power and Lightinh Company PLC
- 11.2.8.1. Overview
- 11.2.8.2. Products
- 11.2.8.3. SWOT Analysis
- 11.2.8.4. Recent Developments
- 11.2.8.5. Financials (Based on Availability)
- 11.2.9 Kenya Electricity Generating Company Plc
- 11.2.9.1. Overview
- 11.2.9.2. Products
- 11.2.9.3. SWOT Analysis
- 11.2.9.4. Recent Developments
- 11.2.9.5. Financials (Based on Availability)
- 11.2.1 Power Generation Companies
List of Figures
- Figure 1: East Africa Power Industry Revenue Breakdown (billion, %) by Product 2025 & 2033
- Figure 2: East Africa Power Industry Share (%) by Company 2025
List of Tables
- Table 1: East Africa Power Industry Revenue billion Forecast, by Sector 2020 & 2033
- Table 2: East Africa Power Industry Volume Gigawatt Forecast, by Sector 2020 & 2033
- Table 3: East Africa Power Industry Revenue billion Forecast, by Geography 2020 & 2033
- Table 4: East Africa Power Industry Volume Gigawatt Forecast, by Geography 2020 & 2033
- Table 5: East Africa Power Industry Revenue billion Forecast, by Region 2020 & 2033
- Table 6: East Africa Power Industry Volume Gigawatt Forecast, by Region 2020 & 2033
- Table 7: East Africa Power Industry Revenue billion Forecast, by Sector 2020 & 2033
- Table 8: East Africa Power Industry Volume Gigawatt Forecast, by Sector 2020 & 2033
- Table 9: East Africa Power Industry Revenue billion Forecast, by Geography 2020 & 2033
- Table 10: East Africa Power Industry Volume Gigawatt Forecast, by Geography 2020 & 2033
- Table 11: East Africa Power Industry Revenue billion Forecast, by Country 2020 & 2033
- Table 12: East Africa Power Industry Volume Gigawatt Forecast, by Country 2020 & 2033
- Table 13: East Africa Power Industry Revenue billion Forecast, by Sector 2020 & 2033
- Table 14: East Africa Power Industry Volume Gigawatt Forecast, by Sector 2020 & 2033
- Table 15: East Africa Power Industry Revenue billion Forecast, by Geography 2020 & 2033
- Table 16: East Africa Power Industry Volume Gigawatt Forecast, by Geography 2020 & 2033
- Table 17: East Africa Power Industry Revenue billion Forecast, by Country 2020 & 2033
- Table 18: East Africa Power Industry Volume Gigawatt Forecast, by Country 2020 & 2033
- Table 19: East Africa Power Industry Revenue billion Forecast, by Sector 2020 & 2033
- Table 20: East Africa Power Industry Volume Gigawatt Forecast, by Sector 2020 & 2033
- Table 21: East Africa Power Industry Revenue billion Forecast, by Geography 2020 & 2033
- Table 22: East Africa Power Industry Volume Gigawatt Forecast, by Geography 2020 & 2033
- Table 23: East Africa Power Industry Revenue billion Forecast, by Country 2020 & 2033
- Table 24: East Africa Power Industry Volume Gigawatt Forecast, by Country 2020 & 2033
- Table 25: East Africa Power Industry Revenue billion Forecast, by Sector 2020 & 2033
- Table 26: East Africa Power Industry Volume Gigawatt Forecast, by Sector 2020 & 2033
- Table 27: East Africa Power Industry Revenue billion Forecast, by Geography 2020 & 2033
- Table 28: East Africa Power Industry Volume Gigawatt Forecast, by Geography 2020 & 2033
- Table 29: East Africa Power Industry Revenue billion Forecast, by Country 2020 & 2033
- Table 30: East Africa Power Industry Volume Gigawatt Forecast, by Country 2020 & 2033
- Table 31: East Africa Power Industry Revenue billion Forecast, by Sector 2020 & 2033
- Table 32: East Africa Power Industry Volume Gigawatt Forecast, by Sector 2020 & 2033
- Table 33: East Africa Power Industry Revenue billion Forecast, by Geography 2020 & 2033
- Table 34: East Africa Power Industry Volume Gigawatt Forecast, by Geography 2020 & 2033
- Table 35: East Africa Power Industry Revenue billion Forecast, by Country 2020 & 2033
- Table 36: East Africa Power Industry Volume Gigawatt Forecast, by Country 2020 & 2033
Frequently Asked Questions
1. What is the projected Compound Annual Growth Rate (CAGR) of the East Africa Power Industry?
The projected CAGR is approximately 4.7%.
2. Which companies are prominent players in the East Africa Power Industry?
Key companies in the market include Power Generation Companies, nzania Electric Supply Company, Uganda Electricity Transmission Company Limited*List Not Exhaustive, Tower Transmission and Distribution Companies, Kenya Electricty Transmission Company, hiopian Electric Company, Uganda Electricity Generation Company Limited, Kenya Power and Lightinh Company PLC, Kenya Electricity Generating Company Plc.
3. What are the main segments of the East Africa Power Industry?
The market segments include Sector, Geography.
4. Can you provide details about the market size?
The market size is estimated to be USD 21.99 billion as of 2022.
5. What are some drivers contributing to market growth?
4.; Expanding Pipeline Infrastructure4.; Growing Energy Demand.
6. What are the notable trends driving market growth?
Hydro and Non-Hydro Renewables are Expected to Witness Significant Growth.
7. Are there any restraints impacting market growth?
4.; Political Instability and Militant Attacks on Pipeline Infrastructure.
8. Can you provide examples of recent developments in the market?
In September 2021, Kenyan telecoms operator Safaricom, announced that the company has submitted a proposal to Kenya Power for the installation of a USD 300 million smart meter system at the utility, The main objective behind the proposal was to control power losses of the utility company.
9. What pricing options are available for accessing the report?
Pricing options include single-user, multi-user, and enterprise licenses priced at USD 4750, USD 5250, and USD 8750 respectively.
10. Is the market size provided in terms of value or volume?
The market size is provided in terms of value, measured in billion and volume, measured in Gigawatt.
11. Are there any specific market keywords associated with the report?
Yes, the market keyword associated with the report is "East Africa Power Industry," which aids in identifying and referencing the specific market segment covered.
12. How do I determine which pricing option suits my needs best?
The pricing options vary based on user requirements and access needs. Individual users may opt for single-user licenses, while businesses requiring broader access may choose multi-user or enterprise licenses for cost-effective access to the report.
13. Are there any additional resources or data provided in the East Africa Power Industry report?
While the report offers comprehensive insights, it's advisable to review the specific contents or supplementary materials provided to ascertain if additional resources or data are available.
14. How can I stay updated on further developments or reports in the East Africa Power Industry?
To stay informed about further developments, trends, and reports in the East Africa Power Industry, consider subscribing to industry newsletters, following relevant companies and organizations, or regularly checking reputable industry news sources and publications.
Methodology
Step 1 - Identification of Relevant Samples Size from Population Database


Step 2 - Approaches for Defining Global Market Size (Value, Volume* & Price*)

Note*: In applicable scenarios
Step 3 - Data Sources
Primary Research
- Web Analytics
- Survey Reports
- Research Institute
- Latest Research Reports
- Opinion Leaders
Secondary Research
- Annual Reports
- White Paper
- Latest Press Release
- Industry Association
- Paid Database
- Investor Presentations

Step 4 - Data Triangulation
Involves using different sources of information in order to increase the validity of a study
These sources are likely to be stakeholders in a program - participants, other researchers, program staff, other community members, and so on.
Then we put all data in single framework & apply various statistical tools to find out the dynamic on the market.
During the analysis stage, feedback from the stakeholder groups would be compared to determine areas of agreement as well as areas of divergence