

Key Insights
The digital graphic printing industry is poised for significant expansion, with a projected Compound Annual Growth Rate (CAGR) of 1.7% from 2025 to 2033. This growth is propelled by a confluence of factors, including the escalating demand for personalized marketing collateral and high-quality, on-demand printing solutions, particularly within the advertising and transactional printing sectors. Furthermore, the increasing imperative for secure document printing across governmental, financial, and healthcare domains is stimulating advancements in the security printing segment. Innovations in inkjet and electrophotography technologies are enhancing print quality, speed, and cost-efficiency, driving broader adoption in general commercial printing applications. The market is segmented by printing process (inkjet and electrophotography) and application (advertising print, transactional printing, security printing, and general commercial print). Leading entities such as Landa Corporation, Xerox Holdings Corporation, and Giesecke+Devrient are actively shaping the market through strategic innovations and acquisitions. Geographically, North America and Europe represent key markets, with Asia Pacific demonstrating considerable growth potential, driven by economic development and business expansion in countries like China and India.
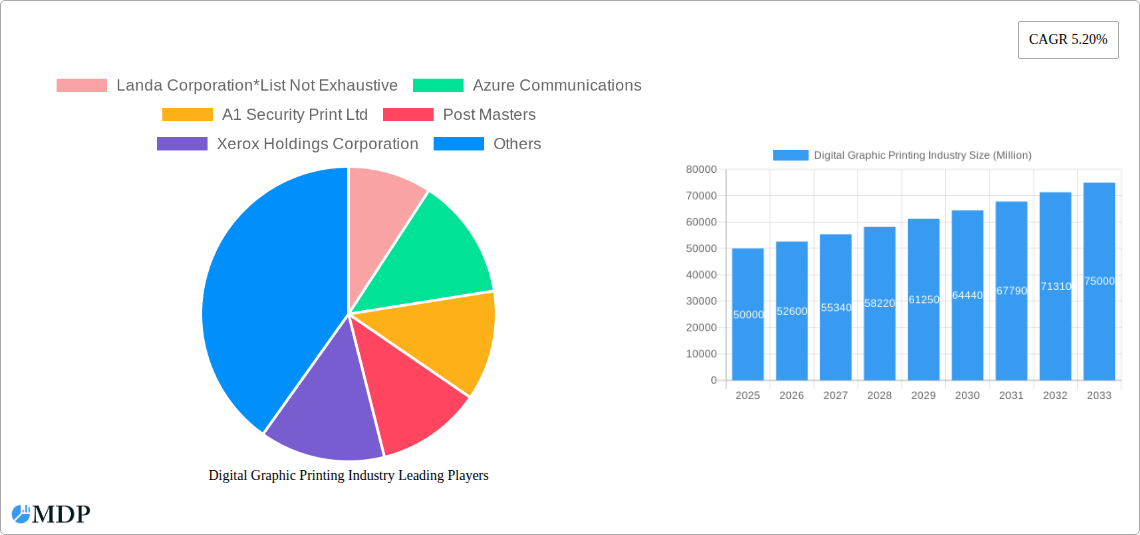
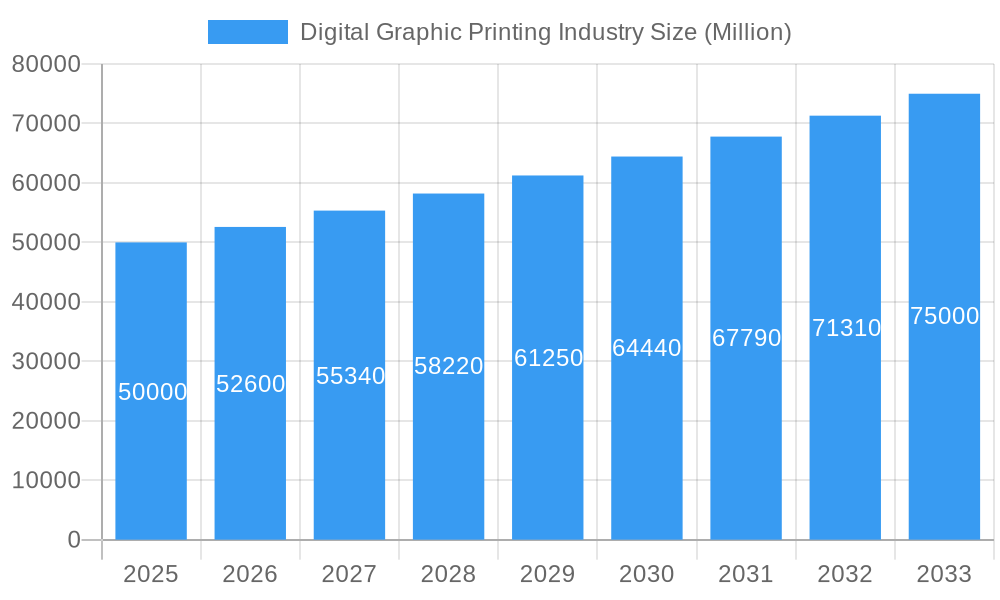
Digital Graphic Printing Industry Market Size (In Billion)
Despite robust growth prospects, the industry confronts challenges, including intensified pricing pressures stemming from fierce competition among established players and the emergence of new technology providers. Additionally, environmental sustainability concerns, specifically regarding the ecological impact of inks and toners, are influencing procurement strategies and prompting manufacturers to prioritize eco-friendly solutions. Nevertheless, the overall market outlook remains optimistic, fueled by ongoing technological advancements, the sustained demand for personalized and secure printing, and the pervasive integration of digital marketing strategies across diverse industries. Future market evolution will likely be characterized by the adoption of sustainable practices, the development of cutting-edge printing technologies, and the emergence of specialized print solutions for niche markets. For the forecast period of 2025-2033, the market size is estimated at approximately $14.9 billion in the base year of 2025, with substantial growth anticipated throughout the forecast period.
Digital Graphic Printing Industry Company Market Share
Digital Graphic Printing Industry: A Comprehensive Market Report (2019-2033)
This in-depth report provides a comprehensive analysis of the Digital Graphic Printing industry, projecting a market valued at $XX Billion by 2033. We delve into market dynamics, industry trends, leading players, and future opportunities, offering actionable insights for stakeholders across the value chain. The report covers the period 2019-2033, with a base year of 2025 and a forecast period of 2025-2033. Key segments analyzed include Inkjet and Electrophotography printing processes, and applications such as Advertising Print, Transactional Printing, Security Printing, and General Commercial Print.
Digital Graphic Printing Industry Market Dynamics & Concentration
The digital graphic printing market is characterized by moderate concentration, with several key players vying for market share. While precise market share figures for individual companies fluctuate, Xerox Holdings Corporation and Landa Corporation are consistently among the leading players, commanding a combined share estimated at approximately xx% in 2025. The industry witnesses continuous innovation driven by advancements in inkjet and electrophotography technologies, leading to increased print speeds, improved image quality, and reduced costs.
Regulatory frameworks, particularly concerning environmental compliance and data privacy, significantly impact industry operations. Product substitutes, such as digital signage and online advertising, exert competitive pressure, especially within the advertising print segment. End-user trends toward personalized and on-demand printing fuel market growth. The past five years have seen a moderate level of M&A activity, with an estimated xx major mergers and acquisitions in the Digital Graphic Printing sector from 2019-2024. This activity is expected to accelerate, driven by the need for expansion and technological advancement.
- Key Players: Xerox Holdings Corporation, Landa Corporation, and others.
- Market Concentration: Moderately concentrated.
- M&A Activity: xx major deals from 2019-2024, predicted to increase.
- Innovation Drivers: Advancements in inkjet and electrophotography technologies.
- Regulatory Influences: Environmental and data privacy regulations.
Digital Graphic Printing Industry Industry Trends & Analysis
The digital graphic printing market exhibits robust growth, projected to achieve a CAGR of xx% during the forecast period (2025-2033). Several factors contribute to this expansion. Technological disruptions, such as the development of high-speed inkjet printers and improved electrophotography systems, enhance productivity and efficiency. Growing consumer preferences for personalized marketing materials and customized products propel demand for digital printing solutions.
The competitive dynamics are shaped by factors such as price competitiveness, technological innovation, and the ability to deliver superior quality and efficiency. Market penetration of digital printing technologies continues to rise across various application segments, driven by the cost-effectiveness and flexibility offered. The adoption of these technologies is particularly prominent in transactional and security printing due to the need for high-volume and highly secure print operations. The overall market growth is also influenced by economic factors, including global economic growth and fluctuations in raw material prices.
Leading Markets & Segments in Digital Graphic Printing Industry
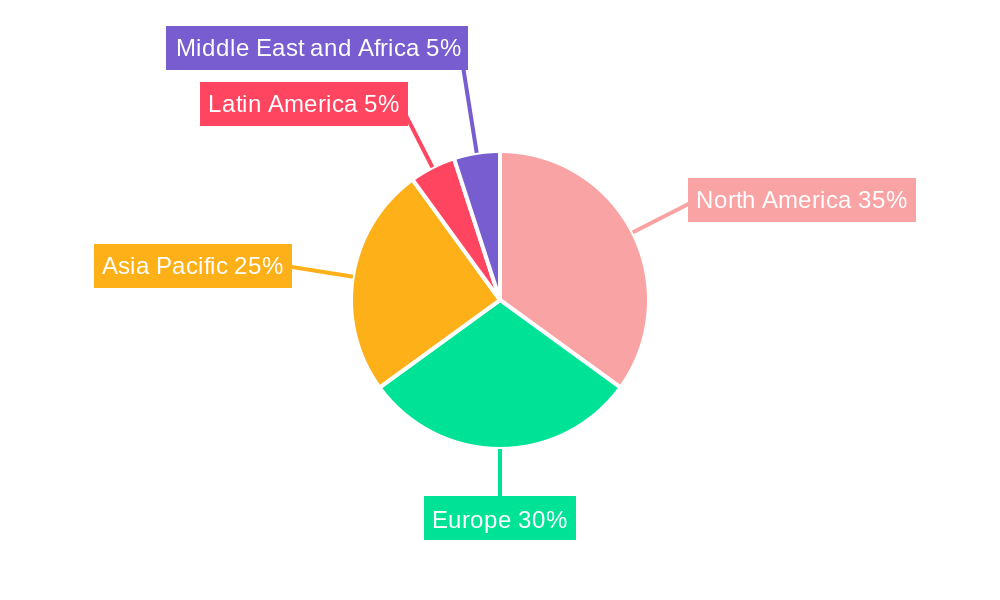
North America currently holds the dominant position in the global digital graphic printing market, driven by its robust economies, advanced infrastructure, and high adoption rates of digital printing technologies. Within the application segments, Transactional Printing and Security Printing exhibit significant growth potential due to their high volume requirements and the need for secure document production. In the printing process segment, Inkjet printing holds a significant market share.
- North America Dominance: Driven by strong economies and high tech adoption.
- High-Growth Segments:
- Transactional Printing: High demand for secure and efficient printing in banking and financial services.
- Security Printing: Increasing focus on preventing counterfeiting and ensuring document authenticity.
- Inkjet Printing's Market Share: Leading printing process due to advancements in quality and speed.
Key Drivers by Region/Segment:
- North America: Strong economic conditions, advanced infrastructure, high adoption of digital technologies.
- Europe: Growing emphasis on sustainability and environmentally friendly printing solutions.
- Asia-Pacific: Rapid industrialization and rising consumer demand, particularly in emerging economies.
- Transactional Printing: High-volume demand, need for efficiency, and security.
- Security Printing: Stringent regulations for anti-counterfeiting, emphasis on data protection.
Digital Graphic Printing Industry Product Developments
Recent product innovations focus on enhanced print quality, increased speed, and improved sustainability. New inkjet technologies offer higher resolutions and wider color gamuts. Developments in electrophotography aim to improve efficiency and reduce energy consumption. These innovations cater to various market demands, including higher volumes, shorter turnaround times, and reduced environmental impact. Competitive advantages are gained through superior print quality, speed, and cost-effectiveness.
Key Drivers of Digital Graphic Printing Industry Growth
The digital graphic printing industry's growth is propelled by several key factors. Technological advancements, particularly in inkjet and electrophotography, are driving efficiency and quality improvements. The rising demand for personalized marketing materials and on-demand printing fuels market expansion. Favorable economic conditions in several key regions further support growth. Government regulations promoting sustainability are also influencing the adoption of environmentally friendly printing solutions.
Challenges in the Digital Graphic Printing Industry Market
The industry faces challenges, including stringent environmental regulations that increase production costs. Fluctuations in raw material prices impact profitability. Intense competition from established players and new entrants puts pressure on pricing and margins. These challenges, if not managed effectively, can hinder industry growth by reducing profitability and limiting expansion potential.
Emerging Opportunities in Digital Graphic Printing Industry
Emerging opportunities lie in the development of eco-friendly inks and printing materials. Strategic partnerships between printing companies and software providers can create integrated solutions. Market expansion into developing economies with rising consumer demand offers significant potential for growth. Moreover, breakthroughs in printing technologies, including advancements in 3D printing, open up entirely new avenues for the industry.
Leading Players in the Digital Graphic Printing Industry Sector
- Landa Corporation
- Azure Communications
- A1 Security Print Ltd
- Post Masters
- Xerox Holdings Corporation
- Giesecke+Devrient Currency Technology GmbH
- Madras Security Printers Pvt Ltd
- Swiss Post Solutions
Key Milestones in Digital Graphic Printing Industry Industry
- 2020: Introduction of a new high-speed inkjet printer by Landa Corporation.
- 2021: Xerox Holdings Corporation launched a sustainable ink technology.
- 2022: A major merger between two mid-sized digital printing companies.
- 2023: Increased focus on environmentally friendly materials by several key players.
- 2024: Development of new security features for high-security printing.
(Note: Specific dates and details may vary depending on actual market data.)
Strategic Outlook for Digital Graphic Printing Industry Market
The digital graphic printing market is poised for continued growth, driven by ongoing technological advancements, increasing demand for personalized printing, and expansion into new markets. Strategic opportunities exist in developing sustainable printing solutions and in leveraging digital technologies for enhanced efficiency and cost-effectiveness. Companies that successfully adapt to evolving market needs and technological trends will be best positioned to capitalize on the industry's future potential.
Digital Graphic Printing Industry Segmentation
-
1. Printing Process
- 1.1. Inkjet
- 1.2. Electrophotography
-
2. Application
- 2.1. Advertising Print
- 2.2. Transactional Printing
- 2.3. Security Printing
- 2.4. General Commercial Print
Digital Graphic Printing Industry Segmentation By Geography
-
1. North America
- 1.1. United States
- 1.2. Canada
-
2. Europe
- 2.1. United kingdom
- 2.2. Germany
- 2.3. France
- 2.4. Spain
- 2.5. Italy
- 2.6. Poland
- 2.7. Netherlands
- 2.8. Rest of Europe
-
3. Asia Pacific
- 3.1. China
- 3.2. India
- 3.3. Japan
- 3.4. Rest of Asia Pacific
- 4. Latin America
- 5. Middle East and Africa
Digital Graphic Printing Industry Regional Market Share
Geographic Coverage of Digital Graphic Printing Industry
Digital Graphic Printing Industry REPORT HIGHLIGHTS
| Aspects | Details |
|---|---|
| Study Period | 2020-2034 |
| Base Year | 2025 |
| Estimated Year | 2026 |
| Forecast Period | 2026-2034 |
| Historical Period | 2020-2025 |
| Growth Rate | CAGR of 1.7% from 2020-2034 |
| Segmentation |
|
Table of Contents
- 1. Introduction
- 1.1. Research Scope
- 1.2. Market Segmentation
- 1.3. Research Objective
- 1.4. Definitions and Assumptions
- 2. Executive Summary
- 2.1. Market Snapshot
- 3. Market Dynamics
- 3.1. Market Drivers
- 3.2. Market Restrains
- 3.3. Market Trends
- 3.4. Market Opportunities
- 4. Market Factor Analysis
- 4.1. Porters Five Forces
- 4.1.1. Bargaining Power of Suppliers
- 4.1.2. Bargaining Power of Buyers
- 4.1.3. Threat of New Entrants
- 4.1.4. Threat of Substitutes
- 4.1.5. Competitive Rivalry
- 4.2. PESTEL analysis
- 4.3. BCG Analysis
- 4.3.1. Stars (High Growth, High Market Share)
- 4.3.2. Cash Cows (Low Growth, High Market Share)
- 4.3.3. Question Mark (High Growth, Low Market Share)
- 4.3.4. Dogs (Low Growth, Low Market Share)
- 4.4. Ansoff Matrix Analysis
- 4.5. Supply Chain Analysis
- 4.6. Regulatory Landscape
- 4.7. Current Market Potential and Opportunity Assessment (TAM–SAM–SOM Framework)
- 4.8. MDP Analyst Note
- 4.1. Porters Five Forces
- 5. Market Analysis, Insights and Forecast 2021-2033
- 5.1. Market Analysis, Insights and Forecast - by Printing Process
- 5.1.1. Inkjet
- 5.1.2. Electrophotography
- 5.2. Market Analysis, Insights and Forecast - by Application
- 5.2.1. Advertising Print
- 5.2.2. Transactional Printing
- 5.2.3. Security Printing
- 5.2.4. General Commercial Print
- 5.3. Market Analysis, Insights and Forecast - by Region
- 5.3.1. North America
- 5.3.2. Europe
- 5.3.3. Asia Pacific
- 5.3.4. Latin America
- 5.3.5. Middle East and Africa
- 5.1. Market Analysis, Insights and Forecast - by Printing Process
- 6. Global Digital Graphic Printing Industry Analysis, Insights and Forecast, 2021-2033
- 6.1. Market Analysis, Insights and Forecast - by Printing Process
- 6.1.1. Inkjet
- 6.1.2. Electrophotography
- 6.2. Market Analysis, Insights and Forecast - by Application
- 6.2.1. Advertising Print
- 6.2.2. Transactional Printing
- 6.2.3. Security Printing
- 6.2.4. General Commercial Print
- 6.1. Market Analysis, Insights and Forecast - by Printing Process
- 7. North America Digital Graphic Printing Industry Analysis, Insights and Forecast, 2020-2032
- 7.1. Market Analysis, Insights and Forecast - by Printing Process
- 7.1.1. Inkjet
- 7.1.2. Electrophotography
- 7.2. Market Analysis, Insights and Forecast - by Application
- 7.2.1. Advertising Print
- 7.2.2. Transactional Printing
- 7.2.3. Security Printing
- 7.2.4. General Commercial Print
- 7.1. Market Analysis, Insights and Forecast - by Printing Process
- 8. Europe Digital Graphic Printing Industry Analysis, Insights and Forecast, 2020-2032
- 8.1. Market Analysis, Insights and Forecast - by Printing Process
- 8.1.1. Inkjet
- 8.1.2. Electrophotography
- 8.2. Market Analysis, Insights and Forecast - by Application
- 8.2.1. Advertising Print
- 8.2.2. Transactional Printing
- 8.2.3. Security Printing
- 8.2.4. General Commercial Print
- 8.1. Market Analysis, Insights and Forecast - by Printing Process
- 9. Asia Pacific Digital Graphic Printing Industry Analysis, Insights and Forecast, 2020-2032
- 9.1. Market Analysis, Insights and Forecast - by Printing Process
- 9.1.1. Inkjet
- 9.1.2. Electrophotography
- 9.2. Market Analysis, Insights and Forecast - by Application
- 9.2.1. Advertising Print
- 9.2.2. Transactional Printing
- 9.2.3. Security Printing
- 9.2.4. General Commercial Print
- 9.1. Market Analysis, Insights and Forecast - by Printing Process
- 10. Latin America Digital Graphic Printing Industry Analysis, Insights and Forecast, 2020-2032
- 10.1. Market Analysis, Insights and Forecast - by Printing Process
- 10.1.1. Inkjet
- 10.1.2. Electrophotography
- 10.2. Market Analysis, Insights and Forecast - by Application
- 10.2.1. Advertising Print
- 10.2.2. Transactional Printing
- 10.2.3. Security Printing
- 10.2.4. General Commercial Print
- 10.1. Market Analysis, Insights and Forecast - by Printing Process
- 11. Middle East and Africa Digital Graphic Printing Industry Analysis, Insights and Forecast, 2020-2032
- 11.1. Market Analysis, Insights and Forecast - by Printing Process
- 11.1.1. Inkjet
- 11.1.2. Electrophotography
- 11.2. Market Analysis, Insights and Forecast - by Application
- 11.2.1. Advertising Print
- 11.2.2. Transactional Printing
- 11.2.3. Security Printing
- 11.2.4. General Commercial Print
- 11.1. Market Analysis, Insights and Forecast - by Printing Process
- 12. Competitive Analysis
- 12.1. Company Profiles
- 12.1.1 Landa Corporation*List Not Exhaustive
- 12.1.1.1. Company Overview
- 12.1.1.2. Products
- 12.1.1.3. Company Financials
- 12.1.1.4. SWOT Analysis
- 12.1.2 Azure Communications
- 12.1.2.1. Company Overview
- 12.1.2.2. Products
- 12.1.2.3. Company Financials
- 12.1.2.4. SWOT Analysis
- 12.1.3 A1 Security Print Ltd
- 12.1.3.1. Company Overview
- 12.1.3.2. Products
- 12.1.3.3. Company Financials
- 12.1.3.4. SWOT Analysis
- 12.1.4 Post Masters
- 12.1.4.1. Company Overview
- 12.1.4.2. Products
- 12.1.4.3. Company Financials
- 12.1.4.4. SWOT Analysis
- 12.1.5 Xerox Holdings Corporation
- 12.1.5.1. Company Overview
- 12.1.5.2. Products
- 12.1.5.3. Company Financials
- 12.1.5.4. SWOT Analysis
- 12.1.6 Giesecke+Devrient Currency Technology GmbH
- 12.1.6.1. Company Overview
- 12.1.6.2. Products
- 12.1.6.3. Company Financials
- 12.1.6.4. SWOT Analysis
- 12.1.7 Madras Security Printers Pvt Ltd
- 12.1.7.1. Company Overview
- 12.1.7.2. Products
- 12.1.7.3. Company Financials
- 12.1.7.4. SWOT Analysis
- 12.1.8 Swiss Post Solutions
- 12.1.8.1. Company Overview
- 12.1.8.2. Products
- 12.1.8.3. Company Financials
- 12.1.8.4. SWOT Analysis
- 12.1.1 Landa Corporation*List Not Exhaustive
- 12.2. Market Entropy
- 12.2.1 Company's Key Areas Served
- 12.2.2 Recent Developments
- 12.3. Company Market Share Analysis 2025
- 12.3.1 Top 5 Companies Market Share Analysis
- 12.3.2 Top 3 Companies Market Share Analysis
- 12.4. List of Potential Customers
- 13. Research Methodology
List of Figures
- Figure 1: Global Digital Graphic Printing Industry Revenue Breakdown (billion, %) by Region 2025 & 2033
- Figure 2: North America Digital Graphic Printing Industry Revenue (billion), by Printing Process 2025 & 2033
- Figure 3: North America Digital Graphic Printing Industry Revenue Share (%), by Printing Process 2025 & 2033
- Figure 4: North America Digital Graphic Printing Industry Revenue (billion), by Application 2025 & 2033
- Figure 5: North America Digital Graphic Printing Industry Revenue Share (%), by Application 2025 & 2033
- Figure 6: North America Digital Graphic Printing Industry Revenue (billion), by Country 2025 & 2033
- Figure 7: North America Digital Graphic Printing Industry Revenue Share (%), by Country 2025 & 2033
- Figure 8: Europe Digital Graphic Printing Industry Revenue (billion), by Printing Process 2025 & 2033
- Figure 9: Europe Digital Graphic Printing Industry Revenue Share (%), by Printing Process 2025 & 2033
- Figure 10: Europe Digital Graphic Printing Industry Revenue (billion), by Application 2025 & 2033
- Figure 11: Europe Digital Graphic Printing Industry Revenue Share (%), by Application 2025 & 2033
- Figure 12: Europe Digital Graphic Printing Industry Revenue (billion), by Country 2025 & 2033
- Figure 13: Europe Digital Graphic Printing Industry Revenue Share (%), by Country 2025 & 2033
- Figure 14: Asia Pacific Digital Graphic Printing Industry Revenue (billion), by Printing Process 2025 & 2033
- Figure 15: Asia Pacific Digital Graphic Printing Industry Revenue Share (%), by Printing Process 2025 & 2033
- Figure 16: Asia Pacific Digital Graphic Printing Industry Revenue (billion), by Application 2025 & 2033
- Figure 17: Asia Pacific Digital Graphic Printing Industry Revenue Share (%), by Application 2025 & 2033
- Figure 18: Asia Pacific Digital Graphic Printing Industry Revenue (billion), by Country 2025 & 2033
- Figure 19: Asia Pacific Digital Graphic Printing Industry Revenue Share (%), by Country 2025 & 2033
- Figure 20: Latin America Digital Graphic Printing Industry Revenue (billion), by Printing Process 2025 & 2033
- Figure 21: Latin America Digital Graphic Printing Industry Revenue Share (%), by Printing Process 2025 & 2033
- Figure 22: Latin America Digital Graphic Printing Industry Revenue (billion), by Application 2025 & 2033
- Figure 23: Latin America Digital Graphic Printing Industry Revenue Share (%), by Application 2025 & 2033
- Figure 24: Latin America Digital Graphic Printing Industry Revenue (billion), by Country 2025 & 2033
- Figure 25: Latin America Digital Graphic Printing Industry Revenue Share (%), by Country 2025 & 2033
- Figure 26: Middle East and Africa Digital Graphic Printing Industry Revenue (billion), by Printing Process 2025 & 2033
- Figure 27: Middle East and Africa Digital Graphic Printing Industry Revenue Share (%), by Printing Process 2025 & 2033
- Figure 28: Middle East and Africa Digital Graphic Printing Industry Revenue (billion), by Application 2025 & 2033
- Figure 29: Middle East and Africa Digital Graphic Printing Industry Revenue Share (%), by Application 2025 & 2033
- Figure 30: Middle East and Africa Digital Graphic Printing Industry Revenue (billion), by Country 2025 & 2033
- Figure 31: Middle East and Africa Digital Graphic Printing Industry Revenue Share (%), by Country 2025 & 2033
List of Tables
- Table 1: Global Digital Graphic Printing Industry Revenue billion Forecast, by Printing Process 2020 & 2033
- Table 2: Global Digital Graphic Printing Industry Revenue billion Forecast, by Application 2020 & 2033
- Table 3: Global Digital Graphic Printing Industry Revenue billion Forecast, by Region 2020 & 2033
- Table 4: Global Digital Graphic Printing Industry Revenue billion Forecast, by Printing Process 2020 & 2033
- Table 5: Global Digital Graphic Printing Industry Revenue billion Forecast, by Application 2020 & 2033
- Table 6: Global Digital Graphic Printing Industry Revenue billion Forecast, by Country 2020 & 2033
- Table 7: United States Digital Graphic Printing Industry Revenue (billion) Forecast, by Application 2020 & 2033
- Table 8: Canada Digital Graphic Printing Industry Revenue (billion) Forecast, by Application 2020 & 2033
- Table 9: Global Digital Graphic Printing Industry Revenue billion Forecast, by Printing Process 2020 & 2033
- Table 10: Global Digital Graphic Printing Industry Revenue billion Forecast, by Application 2020 & 2033
- Table 11: Global Digital Graphic Printing Industry Revenue billion Forecast, by Country 2020 & 2033
- Table 12: United kingdom Digital Graphic Printing Industry Revenue (billion) Forecast, by Application 2020 & 2033
- Table 13: Germany Digital Graphic Printing Industry Revenue (billion) Forecast, by Application 2020 & 2033
- Table 14: France Digital Graphic Printing Industry Revenue (billion) Forecast, by Application 2020 & 2033
- Table 15: Spain Digital Graphic Printing Industry Revenue (billion) Forecast, by Application 2020 & 2033
- Table 16: Italy Digital Graphic Printing Industry Revenue (billion) Forecast, by Application 2020 & 2033
- Table 17: Poland Digital Graphic Printing Industry Revenue (billion) Forecast, by Application 2020 & 2033
- Table 18: Netherlands Digital Graphic Printing Industry Revenue (billion) Forecast, by Application 2020 & 2033
- Table 19: Rest of Europe Digital Graphic Printing Industry Revenue (billion) Forecast, by Application 2020 & 2033
- Table 20: Global Digital Graphic Printing Industry Revenue billion Forecast, by Printing Process 2020 & 2033
- Table 21: Global Digital Graphic Printing Industry Revenue billion Forecast, by Application 2020 & 2033
- Table 22: Global Digital Graphic Printing Industry Revenue billion Forecast, by Country 2020 & 2033
- Table 23: China Digital Graphic Printing Industry Revenue (billion) Forecast, by Application 2020 & 2033
- Table 24: India Digital Graphic Printing Industry Revenue (billion) Forecast, by Application 2020 & 2033
- Table 25: Japan Digital Graphic Printing Industry Revenue (billion) Forecast, by Application 2020 & 2033
- Table 26: Rest of Asia Pacific Digital Graphic Printing Industry Revenue (billion) Forecast, by Application 2020 & 2033
- Table 27: Global Digital Graphic Printing Industry Revenue billion Forecast, by Printing Process 2020 & 2033
- Table 28: Global Digital Graphic Printing Industry Revenue billion Forecast, by Application 2020 & 2033
- Table 29: Global Digital Graphic Printing Industry Revenue billion Forecast, by Country 2020 & 2033
- Table 30: Global Digital Graphic Printing Industry Revenue billion Forecast, by Printing Process 2020 & 2033
- Table 31: Global Digital Graphic Printing Industry Revenue billion Forecast, by Application 2020 & 2033
- Table 32: Global Digital Graphic Printing Industry Revenue billion Forecast, by Country 2020 & 2033
Frequently Asked Questions
1. What is the projected Compound Annual Growth Rate (CAGR) of the Digital Graphic Printing Industry?
The projected CAGR is approximately 1.7%.
2. Which companies are prominent players in the Digital Graphic Printing Industry?
Key companies in the market include Landa Corporation*List Not Exhaustive, Azure Communications, A1 Security Print Ltd, Post Masters, Xerox Holdings Corporation, Giesecke+Devrient Currency Technology GmbH, Madras Security Printers Pvt Ltd, Swiss Post Solutions.
3. What are the main segments of the Digital Graphic Printing Industry?
The market segments include Printing Process, Application.
4. Can you provide details about the market size?
The market size is estimated to be USD 14.9 billion as of 2022.
5. What are some drivers contributing to market growth?
Glass containers for food and beverages are 100% recyclable and hence can be recycled endlessly without loss in quality or purity - something few food and beverage packaging options can claim. Manufacturers benefit from recycling in several ways: Recycled glass reduces emissions and consumption of raw materials. extends the life of plant equipment. such as furnaces. and saves energy.; The growth in population in the country in the recent years has led to a rise in the building & construction sector where soda-lime-silica-based glass is used in windowpanes. owing to their hardness and ease of workability..
6. What are the notable trends driving market growth?
Inkjet Printing Process is Expected to Hold a Significant Share in the Market Over the Forecast Period.
7. Are there any restraints impacting market growth?
However. container glass is manufactured by a process called annealing in which different air polluting compounds such as nitrogen oxides. sulfur dioxides. and other harmful particulates are released. Exposure to these harmful compounds at high concentrations can cause severe respiratory diseases such as asthma. chronic bronchitis. mucus secretion. and lung cancer..
8. Can you provide examples of recent developments in the market?
N/A
9. What pricing options are available for accessing the report?
Pricing options include single-user, multi-user, and enterprise licenses priced at USD 4750, USD 5250, and USD 8750 respectively.
10. Is the market size provided in terms of value or volume?
The market size is provided in terms of value, measured in billion.
11. Are there any specific market keywords associated with the report?
Yes, the market keyword associated with the report is "Digital Graphic Printing Industry," which aids in identifying and referencing the specific market segment covered.
12. How do I determine which pricing option suits my needs best?
The pricing options vary based on user requirements and access needs. Individual users may opt for single-user licenses, while businesses requiring broader access may choose multi-user or enterprise licenses for cost-effective access to the report.
13. Are there any additional resources or data provided in the Digital Graphic Printing Industry report?
While the report offers comprehensive insights, it's advisable to review the specific contents or supplementary materials provided to ascertain if additional resources or data are available.
14. How can I stay updated on further developments or reports in the Digital Graphic Printing Industry?
To stay informed about further developments, trends, and reports in the Digital Graphic Printing Industry, consider subscribing to industry newsletters, following relevant companies and organizations, or regularly checking reputable industry news sources and publications.
Methodology
Step 1 - Identification of Relevant Samples Size from Population Database


Step 2 - Approaches for Defining Global Market Size (Value, Volume* & Price*)

Note*: In applicable scenarios
Step 3 - Data Sources
Primary Research
- Web Analytics
- Survey Reports
- Research Institute
- Latest Research Reports
- Opinion Leaders
Secondary Research
- Annual Reports
- White Paper
- Latest Press Release
- Industry Association
- Paid Database
- Investor Presentations

Step 4 - Data Triangulation
Involves using different sources of information in order to increase the validity of a study
These sources are likely to be stakeholders in a program - participants, other researchers, program staff, other community members, and so on.
Then we put all data in single framework & apply various statistical tools to find out the dynamic on the market.
During the analysis stage, feedback from the stakeholder groups would be compared to determine areas of agreement as well as areas of divergence