

Key Insights
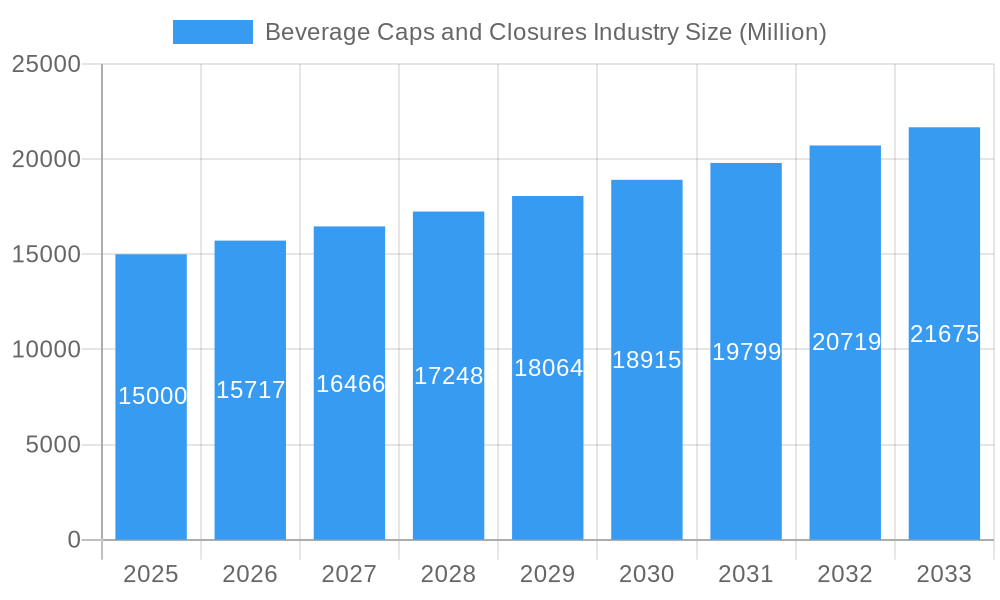
The global beverage caps and closures market, valued at approximately $13.3 billion in 2025, is projected for significant expansion, exhibiting a Compound Annual Growth Rate (CAGR) of 4.6% from 2025 to 2033. This growth is propelled by escalating demand for secure, tamper-evident packaging across diverse beverage segments such as soft drinks, juices, and alcoholic beverages. Increased consumer focus on hygiene and product safety further bolsters the need for reliable closures. The prominent trend towards sustainable packaging, with a focus on recyclable and eco-friendly materials, presents substantial market opportunities. Innovations in closure design, including resealable features and integrated tamper-evidence, also contribute to market advancement. While North America and Europe currently dominate market share, the Asia-Pacific region is poised for rapid growth due to rising disposable incomes and increased beverage consumption in emerging economies.
Beverage Caps and Closures Industry Market Size (In Billion)
Market growth faces challenges from fluctuating raw material costs, particularly for plastics and metals, impacting production expenses. Stringent regulatory requirements for packaging materials and environmental concerns necessitate continuous innovation and adaptation from manufacturers. Intense competition among established and new market entrants demands differentiation and cost-efficiency. Despite these hurdles, the beverage caps and closures market outlook remains optimistic, driven by evolving beverage consumption patterns, packaging innovation, and sustainability efforts. The utilization of a wide array of materials, including metal, plastic, and others like rubber and cork, caters to diverse industry needs, signaling further market segmentation potential.
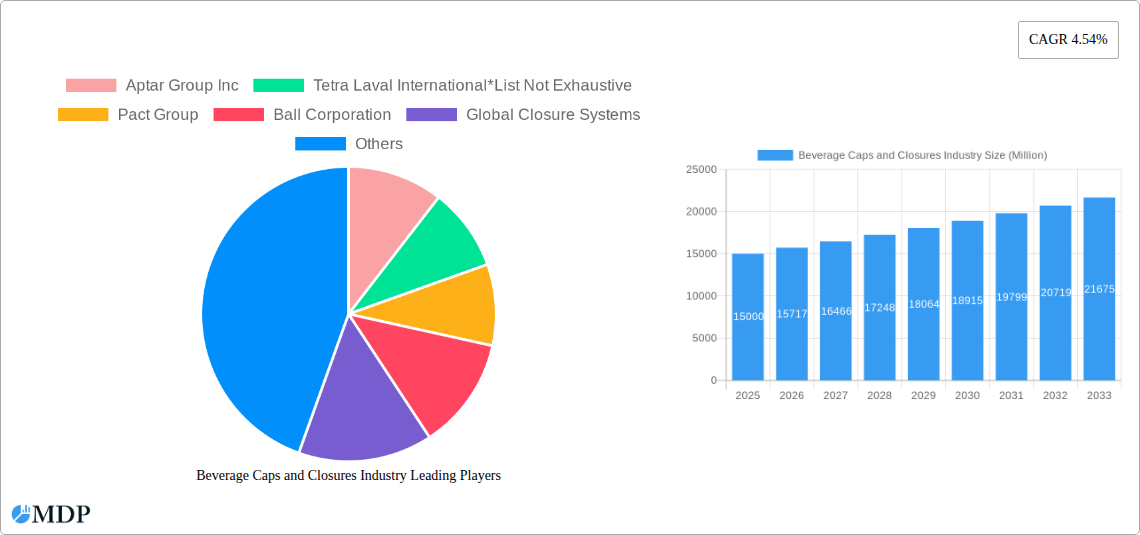
Beverage Caps and Closures Industry Company Market Share
Beverage Caps and Closures Industry Market Report: 2019-2033
This comprehensive report provides an in-depth analysis of the global beverage caps and closures industry, offering valuable insights for stakeholders, investors, and industry professionals. The study covers the period 2019-2033, with a focus on the forecast period 2025-2033 and a base year of 2025. The report’s findings are based on extensive market research, including analysis of key players, market trends, and future growth opportunities. The total market value is estimated at xx Million in 2025, projected to reach xx Million by 2033, representing a significant CAGR of xx%.
Beverage Caps and Closures Industry Market Dynamics & Concentration
The global beverage caps and closures market is characterized by a moderately concentrated landscape, with several major players holding significant market share. Aptar Group Inc, Tetra Laval International, Pact Group, Ball Corporation, Global Closure Systems, Bericap GmbH & Co KG, Guala Closures Group, Crown Holdings Inc, Albea Group, Evergreen Packaging Inc, Berry Global Inc, Silgan Holdings Inc, and Amcor Ltd are some of the key players shaping the market. These companies compete based on factors like product innovation, cost-effectiveness, and distribution networks. The market share of the top five players is estimated to be around xx% in 2025.
- Market Concentration: High, with a few dominant players.
- Innovation Drivers: Sustainability concerns (recyclable/bio-based materials), improved sealing technologies, and convenience features (e.g., tamper-evident closures).
- Regulatory Frameworks: Growing emphasis on food safety regulations and environmental standards influencing material choices and manufacturing processes.
- Product Substitutes: Limited direct substitutes, but pressure from alternative packaging solutions (e.g., pouches) exists.
- End-User Trends: Shifting consumer preferences towards convenience, sustainability, and premium packaging experiences.
- M&A Activities: A moderate level of merger and acquisition activity, driven by the need for expansion, diversification, and technological advancements. An estimated xx M&A deals occurred between 2019 and 2024.
Beverage Caps and Closures Industry Industry Trends & Analysis
The beverage caps and closures industry is experiencing robust growth, driven by several key factors. The rising demand for packaged beverages globally, coupled with increasing consumer preference for convenient and tamper-evident closures, is fueling market expansion. Technological advancements, particularly in sustainable materials and sealing technologies, are also significant drivers. Consumer preferences are shifting toward eco-friendly options, leading to increased demand for recyclable and compostable caps and closures. This trend is further intensified by stringent environmental regulations. Competitive dynamics involve intense rivalry among major players, with a focus on innovation, cost optimization, and expanding geographical reach. The market is witnessing a significant shift toward lightweight and sustainable materials, reducing the environmental impact of packaging. This transition presents both opportunities and challenges for manufacturers.
Leading Markets & Segments in Beverage Caps and Closures Industry
The Asia-Pacific region is projected to dominate the beverage caps and closures market during the forecast period, driven by a rapidly expanding beverage industry and rising disposable incomes. Within this region, China and India are expected to be key contributors.
By Material:
- Plastic: This segment holds the largest market share due to its cost-effectiveness, versatility, and ease of manufacturing. However, growing concerns about plastic pollution are driving innovation in recyclable and bio-based plastic alternatives.
- Metal: Metal caps and closures offer superior barrier properties and a premium feel, making them popular for high-value beverages. However, their higher cost and weight compared to plastic limit their broader market penetration.
- Other Materials (Rubber, Cork): This segment caters to niche applications, primarily for premium and specialty beverages, offering unique functionalities and sustainable attributes.
Key Drivers:
- Economic growth: Strong economic growth in developing countries fuels increased beverage consumption.
- Infrastructure development: Improved infrastructure facilitates efficient distribution of packaged beverages.
- Government support: Favorable government policies and incentives promote the growth of the beverage industry.
Beverage Caps and Closures Industry Product Developments
Recent innovations focus on sustainability, improved functionality, and enhanced consumer experience. This includes the development of recyclable and compostable caps and closures made from bio-based materials. Smart closures incorporating sensors and technologies for tamper evidence and traceability are gaining popularity, particularly in premium segments. These advancements improve product safety and enhance brand protection. The market sees a continuous development of lightweight designs, reducing material usage and transportation costs.
Key Drivers of Beverage Caps and Closures Industry Growth
Several factors contribute to the industry's growth. Technological advancements in materials science, leading to lighter, more sustainable packaging, is a major driver. Economic growth in developing nations fuels rising demand for packaged beverages. Stringent government regulations promoting sustainable packaging options are further boosting market expansion. Consumer preference for convenient and tamper-evident closures also plays a key role.
Challenges in the Beverage Caps and Closures Industry Market
The industry faces challenges including fluctuating raw material prices, impacting production costs. Stringent environmental regulations necessitate investments in sustainable solutions, presenting a significant cost burden for some manufacturers. Intense competition from both established and emerging players creates pressure on profit margins. Supply chain disruptions due to geopolitical instability or pandemic events can also severely impact operations. An estimated xx% increase in raw material prices was observed between 2021 and 2023.
Emerging Opportunities in Beverage Caps and Closures Industry
The industry is poised for growth through advancements in smart packaging technologies, allowing for enhanced product traceability and consumer engagement. Strategic partnerships between packaging companies and beverage manufacturers are fostering innovation and creating efficient supply chains. Expansion into emerging markets with growing beverage consumption presents significant potential for market penetration.
Leading Players in the Beverage Caps and Closures Industry Sector
- Aptar Group Inc
- Tetra Laval International
- Pact Group
- Ball Corporation
- Global Closure Systems
- Bericap GmbH & Co KG
- Guala Closures Group
- Crown Holdings Inc
- Albea Group
- Evergreen Packaging Inc
- Berry Global Inc
- Silgan Holdings Inc
- Amcor Ltd
Key Milestones in Beverage Caps and Closures Industry Industry
- 2020: Increased focus on sustainable packaging solutions due to growing environmental concerns.
- 2021: Several major players announced investments in new recycling technologies.
- 2022: Significant advancements in bio-based materials for caps and closures were observed.
- 2023: Several mergers and acquisitions consolidated market share among leading players.
Strategic Outlook for Beverage Caps and Closures Industry Market
The beverage caps and closures market is projected to witness sustained growth in the coming years, driven by the factors discussed earlier. Strategic investments in sustainable materials, smart packaging technologies, and expansion into new markets will be crucial for companies seeking to capitalize on emerging opportunities. Focusing on enhancing efficiency and optimizing supply chains will remain a critical factor for sustained success.
Beverage Caps and Closures Industry Segmentation
-
1. Material
- 1.1. Metal
- 1.2. Plastic
- 1.3. Other Materials (Rubber, Cork)
Beverage Caps and Closures Industry Segmentation By Geography
-
1. North America
- 1.1. US
- 1.2. Canada
-
2. Europe
- 2.1. Germany
- 2.2. UK
- 2.3. France
- 2.4. Rest of Europe
-
3. Asia Pacific
- 3.1. China
- 3.2. Japan
- 3.3. India
- 3.4. Rest of Asia Pacific
-
4. Latin America
- 4.1. Brazil
- 4.2. Mexico
- 4.3. Rest of Latin America
-
5. Middle East and Africa
- 5.1. UAE
- 5.2. Saudi Arabia
- 5.3. South Africa
- 5.4. Rest of Middle East
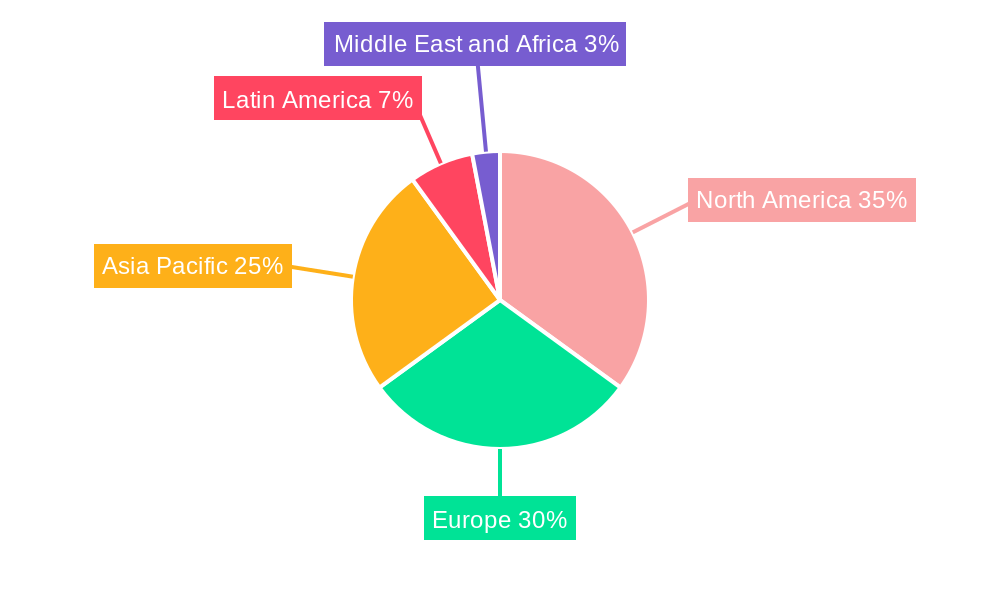
Beverage Caps and Closures Industry Regional Market Share
Geographic Coverage of Beverage Caps and Closures Industry
Beverage Caps and Closures Industry REPORT HIGHLIGHTS
| Aspects | Details |
|---|---|
| Study Period | 2020-2034 |
| Base Year | 2025 |
| Estimated Year | 2026 |
| Forecast Period | 2026-2034 |
| Historical Period | 2020-2025 |
| Growth Rate | CAGR of 4.6% from 2020-2034 |
| Segmentation |
|
Table of Contents
- 1. Introduction
- 1.1. Research Scope
- 1.2. Market Segmentation
- 1.3. Research Objective
- 1.4. Definitions and Assumptions
- 2. Executive Summary
- 2.1. Market Snapshot
- 3. Market Dynamics
- 3.1. Market Drivers
- 3.2. Market Restrains
- 3.3. Market Trends
- 3.4. Market Opportunities
- 4. Market Factor Analysis
- 4.1. Porters Five Forces
- 4.1.1. Bargaining Power of Suppliers
- 4.1.2. Bargaining Power of Buyers
- 4.1.3. Threat of New Entrants
- 4.1.4. Threat of Substitutes
- 4.1.5. Competitive Rivalry
- 4.2. PESTEL analysis
- 4.3. BCG Analysis
- 4.3.1. Stars (High Growth, High Market Share)
- 4.3.2. Cash Cows (Low Growth, High Market Share)
- 4.3.3. Question Mark (High Growth, Low Market Share)
- 4.3.4. Dogs (Low Growth, Low Market Share)
- 4.4. Ansoff Matrix Analysis
- 4.5. Supply Chain Analysis
- 4.6. Regulatory Landscape
- 4.7. Current Market Potential and Opportunity Assessment (TAM–SAM–SOM Framework)
- 4.8. MDP Analyst Note
- 4.1. Porters Five Forces
- 5. Market Analysis, Insights and Forecast 2021-2033
- 5.1. Market Analysis, Insights and Forecast - by Material
- 5.1.1. Metal
- 5.1.2. Plastic
- 5.1.3. Other Materials (Rubber, Cork)
- 5.2. Market Analysis, Insights and Forecast - by Region
- 5.2.1. North America
- 5.2.2. Europe
- 5.2.3. Asia Pacific
- 5.2.4. Latin America
- 5.2.5. Middle East and Africa
- 5.1. Market Analysis, Insights and Forecast - by Material
- 6. Global Beverage Caps and Closures Industry Analysis, Insights and Forecast, 2021-2033
- 6.1. Market Analysis, Insights and Forecast - by Material
- 6.1.1. Metal
- 6.1.2. Plastic
- 6.1.3. Other Materials (Rubber, Cork)
- 6.1. Market Analysis, Insights and Forecast - by Material
- 7. North America Beverage Caps and Closures Industry Analysis, Insights and Forecast, 2020-2032
- 7.1. Market Analysis, Insights and Forecast - by Material
- 7.1.1. Metal
- 7.1.2. Plastic
- 7.1.3. Other Materials (Rubber, Cork)
- 7.1. Market Analysis, Insights and Forecast - by Material
- 8. Europe Beverage Caps and Closures Industry Analysis, Insights and Forecast, 2020-2032
- 8.1. Market Analysis, Insights and Forecast - by Material
- 8.1.1. Metal
- 8.1.2. Plastic
- 8.1.3. Other Materials (Rubber, Cork)
- 8.1. Market Analysis, Insights and Forecast - by Material
- 9. Asia Pacific Beverage Caps and Closures Industry Analysis, Insights and Forecast, 2020-2032
- 9.1. Market Analysis, Insights and Forecast - by Material
- 9.1.1. Metal
- 9.1.2. Plastic
- 9.1.3. Other Materials (Rubber, Cork)
- 9.1. Market Analysis, Insights and Forecast - by Material
- 10. Latin America Beverage Caps and Closures Industry Analysis, Insights and Forecast, 2020-2032
- 10.1. Market Analysis, Insights and Forecast - by Material
- 10.1.1. Metal
- 10.1.2. Plastic
- 10.1.3. Other Materials (Rubber, Cork)
- 10.1. Market Analysis, Insights and Forecast - by Material
- 11. Middle East and Africa Beverage Caps and Closures Industry Analysis, Insights and Forecast, 2020-2032
- 11.1. Market Analysis, Insights and Forecast - by Material
- 11.1.1. Metal
- 11.1.2. Plastic
- 11.1.3. Other Materials (Rubber, Cork)
- 11.1. Market Analysis, Insights and Forecast - by Material
- 12. Competitive Analysis
- 12.1. Company Profiles
- 12.1.1 Aptar Group Inc
- 12.1.1.1. Company Overview
- 12.1.1.2. Products
- 12.1.1.3. Company Financials
- 12.1.1.4. SWOT Analysis
- 12.1.2 Tetra Laval International*List Not Exhaustive
- 12.1.2.1. Company Overview
- 12.1.2.2. Products
- 12.1.2.3. Company Financials
- 12.1.2.4. SWOT Analysis
- 12.1.3 Pact Group
- 12.1.3.1. Company Overview
- 12.1.3.2. Products
- 12.1.3.3. Company Financials
- 12.1.3.4. SWOT Analysis
- 12.1.4 Ball Corporation
- 12.1.4.1. Company Overview
- 12.1.4.2. Products
- 12.1.4.3. Company Financials
- 12.1.4.4. SWOT Analysis
- 12.1.5 Global Closure Systems
- 12.1.5.1. Company Overview
- 12.1.5.2. Products
- 12.1.5.3. Company Financials
- 12.1.5.4. SWOT Analysis
- 12.1.6 Bericap GmbH & Co KG
- 12.1.6.1. Company Overview
- 12.1.6.2. Products
- 12.1.6.3. Company Financials
- 12.1.6.4. SWOT Analysis
- 12.1.7 Guala Closures Group
- 12.1.7.1. Company Overview
- 12.1.7.2. Products
- 12.1.7.3. Company Financials
- 12.1.7.4. SWOT Analysis
- 12.1.8 Crown Holdings Inc
- 12.1.8.1. Company Overview
- 12.1.8.2. Products
- 12.1.8.3. Company Financials
- 12.1.8.4. SWOT Analysis
- 12.1.9 Albea Group
- 12.1.9.1. Company Overview
- 12.1.9.2. Products
- 12.1.9.3. Company Financials
- 12.1.9.4. SWOT Analysis
- 12.1.10 Evergreen Packaging Inc
- 12.1.10.1. Company Overview
- 12.1.10.2. Products
- 12.1.10.3. Company Financials
- 12.1.10.4. SWOT Analysis
- 12.1.11 Berry Global Inc
- 12.1.11.1. Company Overview
- 12.1.11.2. Products
- 12.1.11.3. Company Financials
- 12.1.11.4. SWOT Analysis
- 12.1.12 Silgan Holdings Inc
- 12.1.12.1. Company Overview
- 12.1.12.2. Products
- 12.1.12.3. Company Financials
- 12.1.12.4. SWOT Analysis
- 12.1.13 Amcor Ltd
- 12.1.13.1. Company Overview
- 12.1.13.2. Products
- 12.1.13.3. Company Financials
- 12.1.13.4. SWOT Analysis
- 12.1.1 Aptar Group Inc
- 12.2. Market Entropy
- 12.2.1 Company's Key Areas Served
- 12.2.2 Recent Developments
- 12.3. Company Market Share Analysis 2025
- 12.3.1 Top 5 Companies Market Share Analysis
- 12.3.2 Top 3 Companies Market Share Analysis
- 12.4. List of Potential Customers
- 13. Research Methodology
List of Figures
- Figure 1: Global Beverage Caps and Closures Industry Revenue Breakdown (billion, %) by Region 2025 & 2033
- Figure 2: North America Beverage Caps and Closures Industry Revenue (billion), by Material 2025 & 2033
- Figure 3: North America Beverage Caps and Closures Industry Revenue Share (%), by Material 2025 & 2033
- Figure 4: North America Beverage Caps and Closures Industry Revenue (billion), by Country 2025 & 2033
- Figure 5: North America Beverage Caps and Closures Industry Revenue Share (%), by Country 2025 & 2033
- Figure 6: Europe Beverage Caps and Closures Industry Revenue (billion), by Material 2025 & 2033
- Figure 7: Europe Beverage Caps and Closures Industry Revenue Share (%), by Material 2025 & 2033
- Figure 8: Europe Beverage Caps and Closures Industry Revenue (billion), by Country 2025 & 2033
- Figure 9: Europe Beverage Caps and Closures Industry Revenue Share (%), by Country 2025 & 2033
- Figure 10: Asia Pacific Beverage Caps and Closures Industry Revenue (billion), by Material 2025 & 2033
- Figure 11: Asia Pacific Beverage Caps and Closures Industry Revenue Share (%), by Material 2025 & 2033
- Figure 12: Asia Pacific Beverage Caps and Closures Industry Revenue (billion), by Country 2025 & 2033
- Figure 13: Asia Pacific Beverage Caps and Closures Industry Revenue Share (%), by Country 2025 & 2033
- Figure 14: Latin America Beverage Caps and Closures Industry Revenue (billion), by Material 2025 & 2033
- Figure 15: Latin America Beverage Caps and Closures Industry Revenue Share (%), by Material 2025 & 2033
- Figure 16: Latin America Beverage Caps and Closures Industry Revenue (billion), by Country 2025 & 2033
- Figure 17: Latin America Beverage Caps and Closures Industry Revenue Share (%), by Country 2025 & 2033
- Figure 18: Middle East and Africa Beverage Caps and Closures Industry Revenue (billion), by Material 2025 & 2033
- Figure 19: Middle East and Africa Beverage Caps and Closures Industry Revenue Share (%), by Material 2025 & 2033
- Figure 20: Middle East and Africa Beverage Caps and Closures Industry Revenue (billion), by Country 2025 & 2033
- Figure 21: Middle East and Africa Beverage Caps and Closures Industry Revenue Share (%), by Country 2025 & 2033
List of Tables
- Table 1: Global Beverage Caps and Closures Industry Revenue billion Forecast, by Material 2020 & 2033
- Table 2: Global Beverage Caps and Closures Industry Revenue billion Forecast, by Region 2020 & 2033
- Table 3: Global Beverage Caps and Closures Industry Revenue billion Forecast, by Material 2020 & 2033
- Table 4: Global Beverage Caps and Closures Industry Revenue billion Forecast, by Country 2020 & 2033
- Table 5: US Beverage Caps and Closures Industry Revenue (billion) Forecast, by Application 2020 & 2033
- Table 6: Canada Beverage Caps and Closures Industry Revenue (billion) Forecast, by Application 2020 & 2033
- Table 7: Global Beverage Caps and Closures Industry Revenue billion Forecast, by Material 2020 & 2033
- Table 8: Global Beverage Caps and Closures Industry Revenue billion Forecast, by Country 2020 & 2033
- Table 9: Germany Beverage Caps and Closures Industry Revenue (billion) Forecast, by Application 2020 & 2033
- Table 10: UK Beverage Caps and Closures Industry Revenue (billion) Forecast, by Application 2020 & 2033
- Table 11: France Beverage Caps and Closures Industry Revenue (billion) Forecast, by Application 2020 & 2033
- Table 12: Rest of Europe Beverage Caps and Closures Industry Revenue (billion) Forecast, by Application 2020 & 2033
- Table 13: Global Beverage Caps and Closures Industry Revenue billion Forecast, by Material 2020 & 2033
- Table 14: Global Beverage Caps and Closures Industry Revenue billion Forecast, by Country 2020 & 2033
- Table 15: China Beverage Caps and Closures Industry Revenue (billion) Forecast, by Application 2020 & 2033
- Table 16: Japan Beverage Caps and Closures Industry Revenue (billion) Forecast, by Application 2020 & 2033
- Table 17: India Beverage Caps and Closures Industry Revenue (billion) Forecast, by Application 2020 & 2033
- Table 18: Rest of Asia Pacific Beverage Caps and Closures Industry Revenue (billion) Forecast, by Application 2020 & 2033
- Table 19: Global Beverage Caps and Closures Industry Revenue billion Forecast, by Material 2020 & 2033
- Table 20: Global Beverage Caps and Closures Industry Revenue billion Forecast, by Country 2020 & 2033
- Table 21: Brazil Beverage Caps and Closures Industry Revenue (billion) Forecast, by Application 2020 & 2033
- Table 22: Mexico Beverage Caps and Closures Industry Revenue (billion) Forecast, by Application 2020 & 2033
- Table 23: Rest of Latin America Beverage Caps and Closures Industry Revenue (billion) Forecast, by Application 2020 & 2033
- Table 24: Global Beverage Caps and Closures Industry Revenue billion Forecast, by Material 2020 & 2033
- Table 25: Global Beverage Caps and Closures Industry Revenue billion Forecast, by Country 2020 & 2033
- Table 26: UAE Beverage Caps and Closures Industry Revenue (billion) Forecast, by Application 2020 & 2033
- Table 27: Saudi Arabia Beverage Caps and Closures Industry Revenue (billion) Forecast, by Application 2020 & 2033
- Table 28: South Africa Beverage Caps and Closures Industry Revenue (billion) Forecast, by Application 2020 & 2033
- Table 29: Rest of Middle East Beverage Caps and Closures Industry Revenue (billion) Forecast, by Application 2020 & 2033
Frequently Asked Questions
1. What is the projected Compound Annual Growth Rate (CAGR) of the Beverage Caps and Closures Industry?
The projected CAGR is approximately 4.6%.
2. Which companies are prominent players in the Beverage Caps and Closures Industry?
Key companies in the market include Aptar Group Inc, Tetra Laval International*List Not Exhaustive, Pact Group, Ball Corporation, Global Closure Systems, Bericap GmbH & Co KG, Guala Closures Group, Crown Holdings Inc, Albea Group, Evergreen Packaging Inc, Berry Global Inc, Silgan Holdings Inc, Amcor Ltd.
3. What are the main segments of the Beverage Caps and Closures Industry?
The market segments include Material.
4. Can you provide details about the market size?
The market size is estimated to be USD 13.3 billion as of 2022.
5. What are some drivers contributing to market growth?
; Increasing Beverage Consumption in Developing Economies; Technological Advancements and Innovative Packaging Solutions.
6. What are the notable trends driving market growth?
Plastic is Expected to Experience a Significant Market Share.
7. Are there any restraints impacting market growth?
; Stringent Regulations on the Usage of Plastic Bottles.
8. Can you provide examples of recent developments in the market?
N/A
9. What pricing options are available for accessing the report?
Pricing options include single-user, multi-user, and enterprise licenses priced at USD 4750, USD 5250, and USD 8750 respectively.
10. Is the market size provided in terms of value or volume?
The market size is provided in terms of value, measured in billion.
11. Are there any specific market keywords associated with the report?
Yes, the market keyword associated with the report is "Beverage Caps and Closures Industry," which aids in identifying and referencing the specific market segment covered.
12. How do I determine which pricing option suits my needs best?
The pricing options vary based on user requirements and access needs. Individual users may opt for single-user licenses, while businesses requiring broader access may choose multi-user or enterprise licenses for cost-effective access to the report.
13. Are there any additional resources or data provided in the Beverage Caps and Closures Industry report?
While the report offers comprehensive insights, it's advisable to review the specific contents or supplementary materials provided to ascertain if additional resources or data are available.
14. How can I stay updated on further developments or reports in the Beverage Caps and Closures Industry?
To stay informed about further developments, trends, and reports in the Beverage Caps and Closures Industry, consider subscribing to industry newsletters, following relevant companies and organizations, or regularly checking reputable industry news sources and publications.
Methodology
Step 1 - Identification of Relevant Samples Size from Population Database


Step 2 - Approaches for Defining Global Market Size (Value, Volume* & Price*)

Note*: In applicable scenarios
Step 3 - Data Sources
Primary Research
- Web Analytics
- Survey Reports
- Research Institute
- Latest Research Reports
- Opinion Leaders
Secondary Research
- Annual Reports
- White Paper
- Latest Press Release
- Industry Association
- Paid Database
- Investor Presentations

Step 4 - Data Triangulation
Involves using different sources of information in order to increase the validity of a study
These sources are likely to be stakeholders in a program - participants, other researchers, program staff, other community members, and so on.
Then we put all data in single framework & apply various statistical tools to find out the dynamic on the market.
During the analysis stage, feedback from the stakeholder groups would be compared to determine areas of agreement as well as areas of divergence