

Key Insights
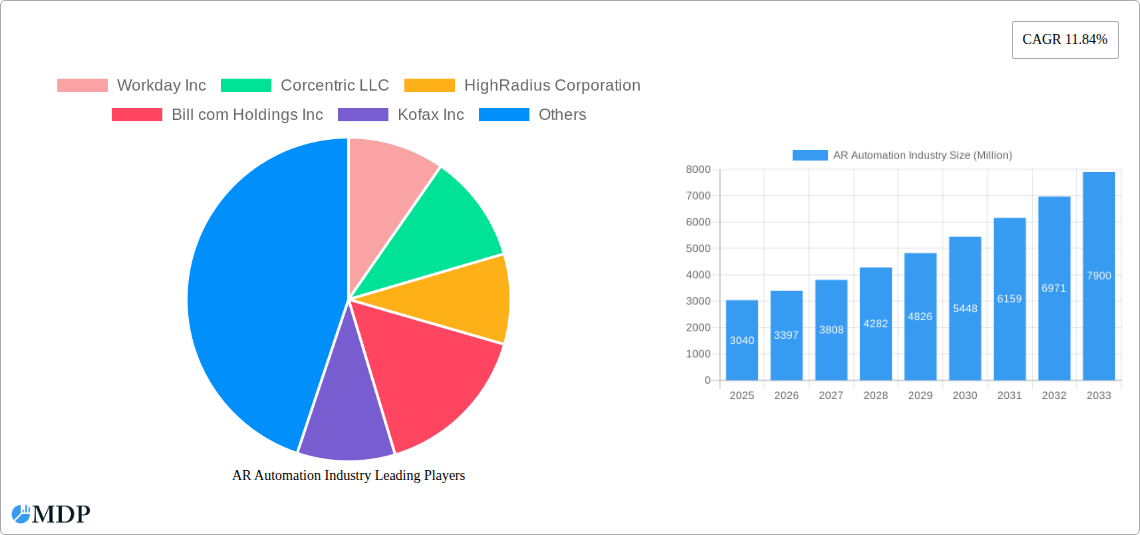
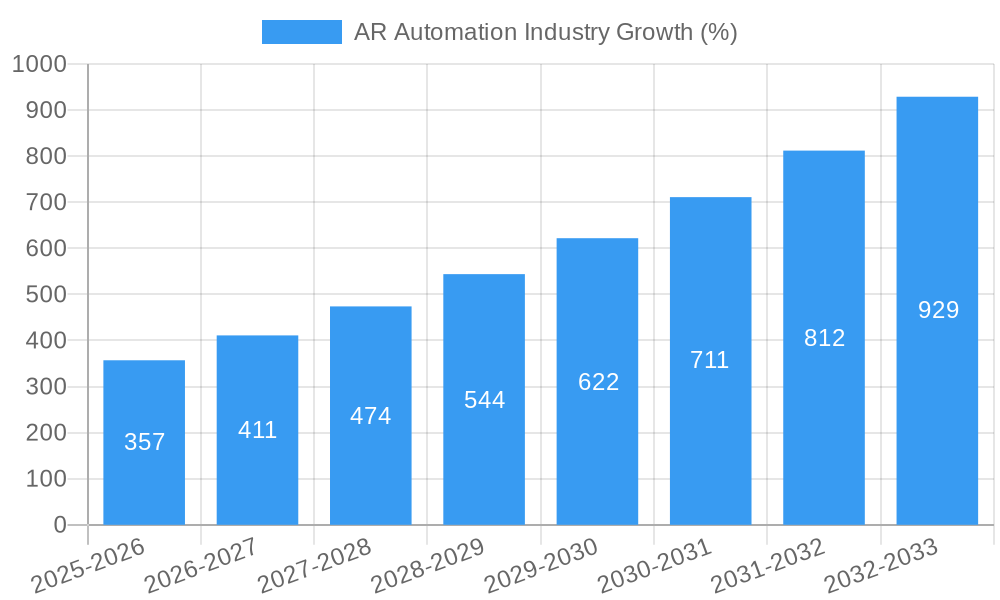
The Accounts Receivable (AR) automation market is experiencing robust growth, projected to reach \$3.04 billion in 2025 and maintain a Compound Annual Growth Rate (CAGR) of 11.84% from 2025 to 2033. This expansion is fueled by several key factors. Businesses across diverse sectors, including BFSI (Banking, Financial Services, and Insurance), IT and Telecom, Manufacturing, Healthcare, and Transportation and Logistics, are increasingly adopting AR automation solutions to streamline invoice processing, reduce manual errors, accelerate payment cycles, and improve cash flow. The shift towards cloud-based deployment models further contributes to market growth, offering scalability, accessibility, and reduced IT infrastructure costs. Large enterprises, possessing greater financial resources and complex AR processes, are leading the adoption, followed by a steadily growing segment of small and medium-sized enterprises (SMEs) seeking efficiency gains. The increasing complexity of regulatory compliance and the rising demand for enhanced customer experiences are also significant drivers, compelling businesses to invest in automated solutions. Competition among vendors like Workday, Corcentric, HighRadius, Bill.com, Kofax, and others is fostering innovation and driving down costs, making AR automation accessible to a wider range of businesses.
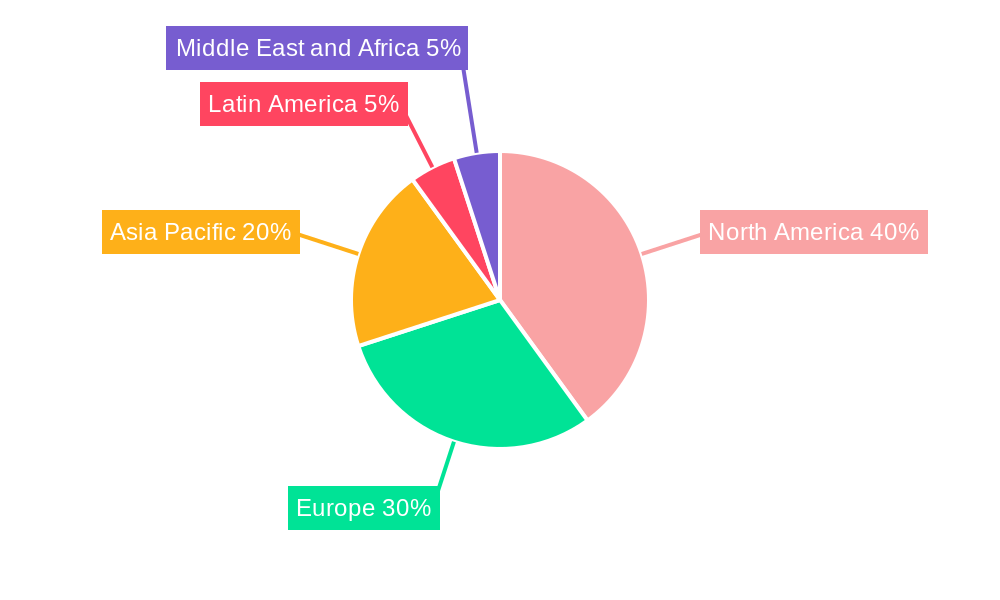
The market segmentation reveals a dynamic landscape. While solutions and services both contribute significantly to the market value, the increasing demand for integrated, comprehensive solutions is expected to fuel stronger growth in this segment compared to services alone. The on-premise deployment mode still holds a share, especially among large enterprises with stringent security concerns, but the cloud segment is anticipated to experience faster growth due to its inherent advantages. Geographical distribution shows a strong presence in North America and Europe, driven by early adoption and advanced technological infrastructure. However, the Asia-Pacific region exhibits substantial growth potential, with increasing digitalization and a burgeoning SME sector expected to propel significant market expansion in the coming years. Overall, the AR automation market presents a compelling investment opportunity, driven by strong underlying trends and a growing need for efficient, automated AR processes across various industries globally.
Unlock the Potential: A Comprehensive Report on the AR Automation Industry (2019-2033)
This in-depth report provides a comprehensive analysis of the AR Automation industry, encompassing market dynamics, leading players, emerging trends, and future growth projections. With a study period spanning 2019-2033, a base year of 2025, and a forecast period of 2025-2033, this report offers invaluable insights for industry stakeholders, investors, and businesses seeking to navigate this rapidly evolving landscape. The global AR Automation market is poised for significant growth, projected to reach xx Million by 2033.
AR Automation Industry Market Dynamics & Concentration
The AR Automation market is characterized by a dynamic interplay of several factors. Market concentration is moderate, with a few major players holding significant shares, while numerous smaller companies and niche players compete fiercely. Innovation is a key driver, with continuous advancements in AI, machine learning, and cloud computing fueling the development of more sophisticated and efficient AR automation solutions. Regulatory frameworks, particularly concerning data privacy and security, significantly influence market dynamics. The emergence of alternative solutions and the increasing adoption of cloud-based deployments are reshaping the competitive landscape. Furthermore, M&A activities are prevalent, with larger companies acquiring smaller firms to expand their market presence and technological capabilities.
- Market Share: The top 5 players hold approximately xx% of the market share in 2025.
- M&A Activity: An estimated xx M&A deals were recorded in the historical period (2019-2024), with a projected increase to xx deals during the forecast period (2025-2033).
- Innovation Drivers: Artificial Intelligence (AI), Machine Learning (ML), Cloud Computing, Robotic Process Automation (RPA).
- End-User Trends: Increasing adoption of digital transformation strategies across various industries.
AR Automation Industry Industry Trends & Analysis
The AR Automation industry is experiencing robust growth, driven by factors such as the rising demand for improved efficiency, reduced operational costs, and enhanced accuracy in accounts receivable processes. Technological disruptions, such as the increasing adoption of cloud-based solutions and the integration of AI and ML capabilities, are fundamentally altering how businesses manage their AR functions. Consumer preferences are shifting towards automated, self-service solutions, demanding greater transparency and faster payment processing. The competitive dynamics are intense, with companies constantly striving to differentiate their offerings through advanced features, superior customer support, and strategic partnerships. The market is expected to witness a CAGR of xx% during the forecast period (2025-2033), with market penetration expected to reach xx% by 2033.
Leading Markets & Segments in AR Automation Industry
North America currently dominates the AR Automation market, driven by high technological adoption rates and a strong presence of major industry players. However, the Asia-Pacific region is expected to show significant growth in the coming years.
Dominant Segments:
- Size of Organization: Large Enterprises currently represent the largest segment, with SMEs showing significant growth potential.
- End-user Industry: The BFSI and IT & Telecom sectors are leading adopters, followed by Manufacturing and Healthcare.
- Component: Solutions constitute a larger market share compared to services.
- Deployment Mode: Cloud-based deployments are gaining traction over on-premise solutions.
Key Drivers:
- North America: High technological maturity, robust IT infrastructure, and early adoption of AR automation solutions.
- Asia-Pacific: Rapid economic growth, increasing digitalization efforts, and a large pool of potential customers in emerging economies.
- Europe: Stringent regulatory frameworks promoting automation and a growing emphasis on digital transformation.
AR Automation Industry Product Developments
Recent product innovations focus on integrating AI and ML capabilities to enhance automation capabilities, improve accuracy, and provide predictive analytics. The integration of RPA tools automates routine tasks, while cloud-based solutions offer scalability and flexibility. Companies are differentiating their offerings through advanced features such as automated invoice processing, intelligent payment reminders, and robust reporting functionalities. These advancements are aligned with the market demand for increased efficiency, reduced manual intervention, and improved financial visibility.
Key Drivers of AR Automation Industry Growth
Several factors contribute to the AR Automation industry's growth. Technological advancements like AI and ML enable higher automation levels, reducing manual effort and improving accuracy. The increasing need for improved efficiency and reduced operational costs across various industries creates strong demand. Favorable regulatory environments supporting digital transformation further boost market expansion. Examples include government initiatives promoting digital payments and data security regulations driving the need for robust AR automation solutions.
Challenges in the AR Automation Industry Market
The AR Automation industry faces several challenges. High initial investment costs for implementing automation solutions can be a barrier for smaller companies. Integration complexities with existing legacy systems and the need for skilled professionals to manage these systems pose significant hurdles. Maintaining data security and privacy compliance amid increasing cyber threats is crucial. The competitive landscape, with many established and emerging players, intensifies market pressures.
Emerging Opportunities in AR Automation Industry
The long-term growth of the AR Automation industry is driven by technological breakthroughs such as advanced AI algorithms, the integration of blockchain technology for enhanced security, and the expansion into new application areas. Strategic partnerships between AR automation providers and other technology companies create synergistic opportunities for market expansion. Growing adoption in emerging economies presents a considerable market opportunity, driving future growth.
Leading Players in the AR Automation Industry Sector
- Workday Inc
- Corcentric LLC
- HighRadius Corporation
- Bill.com Holdings Inc
- Kofax Inc
- Qvalia AB
- Quadient (YayPay Inc)
- Esker Inc
- Oracle Corporation
- Comarch SA
- MHC Automation
- SK Global Software
- SAP SE
Key Milestones in AR Automation Industry Industry
- September 2022: Regate secures USD 20 Million in Series A funding, expanding its SaaS platform for finance automation targeting SMEs.
- March 2022: Esker partners with Fujitsu Asia, expanding its Procure-to-Pay and Order-to-Cash suites in Singapore.
Strategic Outlook for AR Automation Industry Market
The AR Automation market is poised for sustained growth, driven by increasing demand for efficient and accurate AR management across industries. Strategic opportunities lie in developing innovative solutions leveraging AI and ML, focusing on seamless integration with existing systems, and expanding into untapped markets. A focus on data security and compliance will be crucial for maintaining market trust and driving further adoption.
AR Automation Industry Segmentation
-
1. Component
- 1.1. Solutions
- 1.2. Services
-
2. Deployment Mode
- 2.1. On-premise
- 2.2. Cloud
-
3. Size of the Organization
- 3.1. Small and Medium Enterprises
- 3.2. Large Enterprises
-
4. End-user Industry
- 4.1. BFSI
- 4.2. IT and Telecom
- 4.3. Manufacturing
- 4.4. Healthcare
- 4.5. Transportation and Logistics
- 4.6. Other End-user Industries
AR Automation Industry Segmentation By Geography
- 1. North America
- 2. Europe
- 3. Asia
- 4. Australia and New Zealand
- 5. Latin America
- 6. Middle East and Africa
AR Automation Industry REPORT HIGHLIGHTS
| Aspects | Details |
|---|---|
| Study Period | 2019-2033 |
| Base Year | 2024 |
| Estimated Year | 2025 |
| Forecast Period | 2025-2033 |
| Historical Period | 2019-2024 |
| Growth Rate | CAGR of 11.84% from 2019-2033 |
| Segmentation |
|
Table of Contents
- 1. Introduction
- 1.1. Research Scope
- 1.2. Market Segmentation
- 1.3. Research Methodology
- 1.4. Definitions and Assumptions
- 2. Executive Summary
- 2.1. Introduction
- 3. Market Dynamics
- 3.1. Introduction
- 3.2. Market Drivers
- 3.2.1. Improve Business Efficiency by Improving Cash Flow and Reducing Costs and Accounting Cycle Time; Increasing Adoption of Technologies like Cloud Computing and AI
- 3.3. Market Restrains
- 3.3.1. Complex Procedure of Invoicing and Payment Management; Privacy and Security Concerns
- 3.4. Market Trends
- 3.4.1. Increasing Adoption of Technologies Such as Cloud Computing and AI
- 4. Market Factor Analysis
- 4.1. Porters Five Forces
- 4.2. Supply/Value Chain
- 4.3. PESTEL analysis
- 4.4. Market Entropy
- 4.5. Patent/Trademark Analysis
- 5. Global AR Automation Industry Analysis, Insights and Forecast, 2019-2031
- 5.1. Market Analysis, Insights and Forecast - by Component
- 5.1.1. Solutions
- 5.1.2. Services
- 5.2. Market Analysis, Insights and Forecast - by Deployment Mode
- 5.2.1. On-premise
- 5.2.2. Cloud
- 5.3. Market Analysis, Insights and Forecast - by Size of the Organization
- 5.3.1. Small and Medium Enterprises
- 5.3.2. Large Enterprises
- 5.4. Market Analysis, Insights and Forecast - by End-user Industry
- 5.4.1. BFSI
- 5.4.2. IT and Telecom
- 5.4.3. Manufacturing
- 5.4.4. Healthcare
- 5.4.5. Transportation and Logistics
- 5.4.6. Other End-user Industries
- 5.5. Market Analysis, Insights and Forecast - by Region
- 5.5.1. North America
- 5.5.2. Europe
- 5.5.3. Asia
- 5.5.4. Australia and New Zealand
- 5.5.5. Latin America
- 5.5.6. Middle East and Africa
- 5.1. Market Analysis, Insights and Forecast - by Component
- 6. North America AR Automation Industry Analysis, Insights and Forecast, 2019-2031
- 6.1. Market Analysis, Insights and Forecast - by Component
- 6.1.1. Solutions
- 6.1.2. Services
- 6.2. Market Analysis, Insights and Forecast - by Deployment Mode
- 6.2.1. On-premise
- 6.2.2. Cloud
- 6.3. Market Analysis, Insights and Forecast - by Size of the Organization
- 6.3.1. Small and Medium Enterprises
- 6.3.2. Large Enterprises
- 6.4. Market Analysis, Insights and Forecast - by End-user Industry
- 6.4.1. BFSI
- 6.4.2. IT and Telecom
- 6.4.3. Manufacturing
- 6.4.4. Healthcare
- 6.4.5. Transportation and Logistics
- 6.4.6. Other End-user Industries
- 6.1. Market Analysis, Insights and Forecast - by Component
- 7. Europe AR Automation Industry Analysis, Insights and Forecast, 2019-2031
- 7.1. Market Analysis, Insights and Forecast - by Component
- 7.1.1. Solutions
- 7.1.2. Services
- 7.2. Market Analysis, Insights and Forecast - by Deployment Mode
- 7.2.1. On-premise
- 7.2.2. Cloud
- 7.3. Market Analysis, Insights and Forecast - by Size of the Organization
- 7.3.1. Small and Medium Enterprises
- 7.3.2. Large Enterprises
- 7.4. Market Analysis, Insights and Forecast - by End-user Industry
- 7.4.1. BFSI
- 7.4.2. IT and Telecom
- 7.4.3. Manufacturing
- 7.4.4. Healthcare
- 7.4.5. Transportation and Logistics
- 7.4.6. Other End-user Industries
- 7.1. Market Analysis, Insights and Forecast - by Component
- 8. Asia AR Automation Industry Analysis, Insights and Forecast, 2019-2031
- 8.1. Market Analysis, Insights and Forecast - by Component
- 8.1.1. Solutions
- 8.1.2. Services
- 8.2. Market Analysis, Insights and Forecast - by Deployment Mode
- 8.2.1. On-premise
- 8.2.2. Cloud
- 8.3. Market Analysis, Insights and Forecast - by Size of the Organization
- 8.3.1. Small and Medium Enterprises
- 8.3.2. Large Enterprises
- 8.4. Market Analysis, Insights and Forecast - by End-user Industry
- 8.4.1. BFSI
- 8.4.2. IT and Telecom
- 8.4.3. Manufacturing
- 8.4.4. Healthcare
- 8.4.5. Transportation and Logistics
- 8.4.6. Other End-user Industries
- 8.1. Market Analysis, Insights and Forecast - by Component
- 9. Australia and New Zealand AR Automation Industry Analysis, Insights and Forecast, 2019-2031
- 9.1. Market Analysis, Insights and Forecast - by Component
- 9.1.1. Solutions
- 9.1.2. Services
- 9.2. Market Analysis, Insights and Forecast - by Deployment Mode
- 9.2.1. On-premise
- 9.2.2. Cloud
- 9.3. Market Analysis, Insights and Forecast - by Size of the Organization
- 9.3.1. Small and Medium Enterprises
- 9.3.2. Large Enterprises
- 9.4. Market Analysis, Insights and Forecast - by End-user Industry
- 9.4.1. BFSI
- 9.4.2. IT and Telecom
- 9.4.3. Manufacturing
- 9.4.4. Healthcare
- 9.4.5. Transportation and Logistics
- 9.4.6. Other End-user Industries
- 9.1. Market Analysis, Insights and Forecast - by Component
- 10. Latin America AR Automation Industry Analysis, Insights and Forecast, 2019-2031
- 10.1. Market Analysis, Insights and Forecast - by Component
- 10.1.1. Solutions
- 10.1.2. Services
- 10.2. Market Analysis, Insights and Forecast - by Deployment Mode
- 10.2.1. On-premise
- 10.2.2. Cloud
- 10.3. Market Analysis, Insights and Forecast - by Size of the Organization
- 10.3.1. Small and Medium Enterprises
- 10.3.2. Large Enterprises
- 10.4. Market Analysis, Insights and Forecast - by End-user Industry
- 10.4.1. BFSI
- 10.4.2. IT and Telecom
- 10.4.3. Manufacturing
- 10.4.4. Healthcare
- 10.4.5. Transportation and Logistics
- 10.4.6. Other End-user Industries
- 10.1. Market Analysis, Insights and Forecast - by Component
- 11. Middle East and Africa AR Automation Industry Analysis, Insights and Forecast, 2019-2031
- 11.1. Market Analysis, Insights and Forecast - by Component
- 11.1.1. Solutions
- 11.1.2. Services
- 11.2. Market Analysis, Insights and Forecast - by Deployment Mode
- 11.2.1. On-premise
- 11.2.2. Cloud
- 11.3. Market Analysis, Insights and Forecast - by Size of the Organization
- 11.3.1. Small and Medium Enterprises
- 11.3.2. Large Enterprises
- 11.4. Market Analysis, Insights and Forecast - by End-user Industry
- 11.4.1. BFSI
- 11.4.2. IT and Telecom
- 11.4.3. Manufacturing
- 11.4.4. Healthcare
- 11.4.5. Transportation and Logistics
- 11.4.6. Other End-user Industries
- 11.1. Market Analysis, Insights and Forecast - by Component
- 12. North America AR Automation Industry Analysis, Insights and Forecast, 2019-2031
- 12.1. Market Analysis, Insights and Forecast - By Country/Sub-region
- 12.1.1.
- 13. Europe AR Automation Industry Analysis, Insights and Forecast, 2019-2031
- 13.1. Market Analysis, Insights and Forecast - By Country/Sub-region
- 13.1.1.
- 14. Asia Pacific AR Automation Industry Analysis, Insights and Forecast, 2019-2031
- 14.1. Market Analysis, Insights and Forecast - By Country/Sub-region
- 14.1.1.
- 15. Latin America AR Automation Industry Analysis, Insights and Forecast, 2019-2031
- 15.1. Market Analysis, Insights and Forecast - By Country/Sub-region
- 15.1.1.
- 16. Middle East and Africa AR Automation Industry Analysis, Insights and Forecast, 2019-2031
- 16.1. Market Analysis, Insights and Forecast - By Country/Sub-region
- 16.1.1.
- 17. Competitive Analysis
- 17.1. Global Market Share Analysis 2024
- 17.2. Company Profiles
- 17.2.1 Workday Inc
- 17.2.1.1. Overview
- 17.2.1.2. Products
- 17.2.1.3. SWOT Analysis
- 17.2.1.4. Recent Developments
- 17.2.1.5. Financials (Based on Availability)
- 17.2.2 Corcentric LLC
- 17.2.2.1. Overview
- 17.2.2.2. Products
- 17.2.2.3. SWOT Analysis
- 17.2.2.4. Recent Developments
- 17.2.2.5. Financials (Based on Availability)
- 17.2.3 HighRadius Corporation
- 17.2.3.1. Overview
- 17.2.3.2. Products
- 17.2.3.3. SWOT Analysis
- 17.2.3.4. Recent Developments
- 17.2.3.5. Financials (Based on Availability)
- 17.2.4 Bill com Holdings Inc
- 17.2.4.1. Overview
- 17.2.4.2. Products
- 17.2.4.3. SWOT Analysis
- 17.2.4.4. Recent Developments
- 17.2.4.5. Financials (Based on Availability)
- 17.2.5 Kofax Inc
- 17.2.5.1. Overview
- 17.2.5.2. Products
- 17.2.5.3. SWOT Analysis
- 17.2.5.4. Recent Developments
- 17.2.5.5. Financials (Based on Availability)
- 17.2.6 Qvalia AB
- 17.2.6.1. Overview
- 17.2.6.2. Products
- 17.2.6.3. SWOT Analysis
- 17.2.6.4. Recent Developments
- 17.2.6.5. Financials (Based on Availability)
- 17.2.7 Quadient (YayPay Inc )
- 17.2.7.1. Overview
- 17.2.7.2. Products
- 17.2.7.3. SWOT Analysis
- 17.2.7.4. Recent Developments
- 17.2.7.5. Financials (Based on Availability)
- 17.2.8 Esker Inc *List Not Exhaustive
- 17.2.8.1. Overview
- 17.2.8.2. Products
- 17.2.8.3. SWOT Analysis
- 17.2.8.4. Recent Developments
- 17.2.8.5. Financials (Based on Availability)
- 17.2.9 Oracle Corporation
- 17.2.9.1. Overview
- 17.2.9.2. Products
- 17.2.9.3. SWOT Analysis
- 17.2.9.4. Recent Developments
- 17.2.9.5. Financials (Based on Availability)
- 17.2.10 Comarch SA
- 17.2.10.1. Overview
- 17.2.10.2. Products
- 17.2.10.3. SWOT Analysis
- 17.2.10.4. Recent Developments
- 17.2.10.5. Financials (Based on Availability)
- 17.2.11 MHC Automation
- 17.2.11.1. Overview
- 17.2.11.2. Products
- 17.2.11.3. SWOT Analysis
- 17.2.11.4. Recent Developments
- 17.2.11.5. Financials (Based on Availability)
- 17.2.12 SK Global Software
- 17.2.12.1. Overview
- 17.2.12.2. Products
- 17.2.12.3. SWOT Analysis
- 17.2.12.4. Recent Developments
- 17.2.12.5. Financials (Based on Availability)
- 17.2.13 SAP SE
- 17.2.13.1. Overview
- 17.2.13.2. Products
- 17.2.13.3. SWOT Analysis
- 17.2.13.4. Recent Developments
- 17.2.13.5. Financials (Based on Availability)
- 17.2.1 Workday Inc
List of Figures
- Figure 1: Global AR Automation Industry Revenue Breakdown (Million, %) by Region 2024 & 2032
- Figure 2: North America AR Automation Industry Revenue (Million), by Country 2024 & 2032
- Figure 3: North America AR Automation Industry Revenue Share (%), by Country 2024 & 2032
- Figure 4: Europe AR Automation Industry Revenue (Million), by Country 2024 & 2032
- Figure 5: Europe AR Automation Industry Revenue Share (%), by Country 2024 & 2032
- Figure 6: Asia Pacific AR Automation Industry Revenue (Million), by Country 2024 & 2032
- Figure 7: Asia Pacific AR Automation Industry Revenue Share (%), by Country 2024 & 2032
- Figure 8: Latin America AR Automation Industry Revenue (Million), by Country 2024 & 2032
- Figure 9: Latin America AR Automation Industry Revenue Share (%), by Country 2024 & 2032
- Figure 10: Middle East and Africa AR Automation Industry Revenue (Million), by Country 2024 & 2032
- Figure 11: Middle East and Africa AR Automation Industry Revenue Share (%), by Country 2024 & 2032
- Figure 12: North America AR Automation Industry Revenue (Million), by Component 2024 & 2032
- Figure 13: North America AR Automation Industry Revenue Share (%), by Component 2024 & 2032
- Figure 14: North America AR Automation Industry Revenue (Million), by Deployment Mode 2024 & 2032
- Figure 15: North America AR Automation Industry Revenue Share (%), by Deployment Mode 2024 & 2032
- Figure 16: North America AR Automation Industry Revenue (Million), by Size of the Organization 2024 & 2032
- Figure 17: North America AR Automation Industry Revenue Share (%), by Size of the Organization 2024 & 2032
- Figure 18: North America AR Automation Industry Revenue (Million), by End-user Industry 2024 & 2032
- Figure 19: North America AR Automation Industry Revenue Share (%), by End-user Industry 2024 & 2032
- Figure 20: North America AR Automation Industry Revenue (Million), by Country 2024 & 2032
- Figure 21: North America AR Automation Industry Revenue Share (%), by Country 2024 & 2032
- Figure 22: Europe AR Automation Industry Revenue (Million), by Component 2024 & 2032
- Figure 23: Europe AR Automation Industry Revenue Share (%), by Component 2024 & 2032
- Figure 24: Europe AR Automation Industry Revenue (Million), by Deployment Mode 2024 & 2032
- Figure 25: Europe AR Automation Industry Revenue Share (%), by Deployment Mode 2024 & 2032
- Figure 26: Europe AR Automation Industry Revenue (Million), by Size of the Organization 2024 & 2032
- Figure 27: Europe AR Automation Industry Revenue Share (%), by Size of the Organization 2024 & 2032
- Figure 28: Europe AR Automation Industry Revenue (Million), by End-user Industry 2024 & 2032
- Figure 29: Europe AR Automation Industry Revenue Share (%), by End-user Industry 2024 & 2032
- Figure 30: Europe AR Automation Industry Revenue (Million), by Country 2024 & 2032
- Figure 31: Europe AR Automation Industry Revenue Share (%), by Country 2024 & 2032
- Figure 32: Asia AR Automation Industry Revenue (Million), by Component 2024 & 2032
- Figure 33: Asia AR Automation Industry Revenue Share (%), by Component 2024 & 2032
- Figure 34: Asia AR Automation Industry Revenue (Million), by Deployment Mode 2024 & 2032
- Figure 35: Asia AR Automation Industry Revenue Share (%), by Deployment Mode 2024 & 2032
- Figure 36: Asia AR Automation Industry Revenue (Million), by Size of the Organization 2024 & 2032
- Figure 37: Asia AR Automation Industry Revenue Share (%), by Size of the Organization 2024 & 2032
- Figure 38: Asia AR Automation Industry Revenue (Million), by End-user Industry 2024 & 2032
- Figure 39: Asia AR Automation Industry Revenue Share (%), by End-user Industry 2024 & 2032
- Figure 40: Asia AR Automation Industry Revenue (Million), by Country 2024 & 2032
- Figure 41: Asia AR Automation Industry Revenue Share (%), by Country 2024 & 2032
- Figure 42: Australia and New Zealand AR Automation Industry Revenue (Million), by Component 2024 & 2032
- Figure 43: Australia and New Zealand AR Automation Industry Revenue Share (%), by Component 2024 & 2032
- Figure 44: Australia and New Zealand AR Automation Industry Revenue (Million), by Deployment Mode 2024 & 2032
- Figure 45: Australia and New Zealand AR Automation Industry Revenue Share (%), by Deployment Mode 2024 & 2032
- Figure 46: Australia and New Zealand AR Automation Industry Revenue (Million), by Size of the Organization 2024 & 2032
- Figure 47: Australia and New Zealand AR Automation Industry Revenue Share (%), by Size of the Organization 2024 & 2032
- Figure 48: Australia and New Zealand AR Automation Industry Revenue (Million), by End-user Industry 2024 & 2032
- Figure 49: Australia and New Zealand AR Automation Industry Revenue Share (%), by End-user Industry 2024 & 2032
- Figure 50: Australia and New Zealand AR Automation Industry Revenue (Million), by Country 2024 & 2032
- Figure 51: Australia and New Zealand AR Automation Industry Revenue Share (%), by Country 2024 & 2032
- Figure 52: Latin America AR Automation Industry Revenue (Million), by Component 2024 & 2032
- Figure 53: Latin America AR Automation Industry Revenue Share (%), by Component 2024 & 2032
- Figure 54: Latin America AR Automation Industry Revenue (Million), by Deployment Mode 2024 & 2032
- Figure 55: Latin America AR Automation Industry Revenue Share (%), by Deployment Mode 2024 & 2032
- Figure 56: Latin America AR Automation Industry Revenue (Million), by Size of the Organization 2024 & 2032
- Figure 57: Latin America AR Automation Industry Revenue Share (%), by Size of the Organization 2024 & 2032
- Figure 58: Latin America AR Automation Industry Revenue (Million), by End-user Industry 2024 & 2032
- Figure 59: Latin America AR Automation Industry Revenue Share (%), by End-user Industry 2024 & 2032
- Figure 60: Latin America AR Automation Industry Revenue (Million), by Country 2024 & 2032
- Figure 61: Latin America AR Automation Industry Revenue Share (%), by Country 2024 & 2032
- Figure 62: Middle East and Africa AR Automation Industry Revenue (Million), by Component 2024 & 2032
- Figure 63: Middle East and Africa AR Automation Industry Revenue Share (%), by Component 2024 & 2032
- Figure 64: Middle East and Africa AR Automation Industry Revenue (Million), by Deployment Mode 2024 & 2032
- Figure 65: Middle East and Africa AR Automation Industry Revenue Share (%), by Deployment Mode 2024 & 2032
- Figure 66: Middle East and Africa AR Automation Industry Revenue (Million), by Size of the Organization 2024 & 2032
- Figure 67: Middle East and Africa AR Automation Industry Revenue Share (%), by Size of the Organization 2024 & 2032
- Figure 68: Middle East and Africa AR Automation Industry Revenue (Million), by End-user Industry 2024 & 2032
- Figure 69: Middle East and Africa AR Automation Industry Revenue Share (%), by End-user Industry 2024 & 2032
- Figure 70: Middle East and Africa AR Automation Industry Revenue (Million), by Country 2024 & 2032
- Figure 71: Middle East and Africa AR Automation Industry Revenue Share (%), by Country 2024 & 2032
List of Tables
- Table 1: Global AR Automation Industry Revenue Million Forecast, by Region 2019 & 2032
- Table 2: Global AR Automation Industry Revenue Million Forecast, by Component 2019 & 2032
- Table 3: Global AR Automation Industry Revenue Million Forecast, by Deployment Mode 2019 & 2032
- Table 4: Global AR Automation Industry Revenue Million Forecast, by Size of the Organization 2019 & 2032
- Table 5: Global AR Automation Industry Revenue Million Forecast, by End-user Industry 2019 & 2032
- Table 6: Global AR Automation Industry Revenue Million Forecast, by Region 2019 & 2032
- Table 7: Global AR Automation Industry Revenue Million Forecast, by Country 2019 & 2032
- Table 8: AR Automation Industry Revenue (Million) Forecast, by Application 2019 & 2032
- Table 9: Global AR Automation Industry Revenue Million Forecast, by Country 2019 & 2032
- Table 10: AR Automation Industry Revenue (Million) Forecast, by Application 2019 & 2032
- Table 11: Global AR Automation Industry Revenue Million Forecast, by Country 2019 & 2032
- Table 12: AR Automation Industry Revenue (Million) Forecast, by Application 2019 & 2032
- Table 13: Global AR Automation Industry Revenue Million Forecast, by Country 2019 & 2032
- Table 14: AR Automation Industry Revenue (Million) Forecast, by Application 2019 & 2032
- Table 15: Global AR Automation Industry Revenue Million Forecast, by Country 2019 & 2032
- Table 16: AR Automation Industry Revenue (Million) Forecast, by Application 2019 & 2032
- Table 17: Global AR Automation Industry Revenue Million Forecast, by Component 2019 & 2032
- Table 18: Global AR Automation Industry Revenue Million Forecast, by Deployment Mode 2019 & 2032
- Table 19: Global AR Automation Industry Revenue Million Forecast, by Size of the Organization 2019 & 2032
- Table 20: Global AR Automation Industry Revenue Million Forecast, by End-user Industry 2019 & 2032
- Table 21: Global AR Automation Industry Revenue Million Forecast, by Country 2019 & 2032
- Table 22: Global AR Automation Industry Revenue Million Forecast, by Component 2019 & 2032
- Table 23: Global AR Automation Industry Revenue Million Forecast, by Deployment Mode 2019 & 2032
- Table 24: Global AR Automation Industry Revenue Million Forecast, by Size of the Organization 2019 & 2032
- Table 25: Global AR Automation Industry Revenue Million Forecast, by End-user Industry 2019 & 2032
- Table 26: Global AR Automation Industry Revenue Million Forecast, by Country 2019 & 2032
- Table 27: Global AR Automation Industry Revenue Million Forecast, by Component 2019 & 2032
- Table 28: Global AR Automation Industry Revenue Million Forecast, by Deployment Mode 2019 & 2032
- Table 29: Global AR Automation Industry Revenue Million Forecast, by Size of the Organization 2019 & 2032
- Table 30: Global AR Automation Industry Revenue Million Forecast, by End-user Industry 2019 & 2032
- Table 31: Global AR Automation Industry Revenue Million Forecast, by Country 2019 & 2032
- Table 32: Global AR Automation Industry Revenue Million Forecast, by Component 2019 & 2032
- Table 33: Global AR Automation Industry Revenue Million Forecast, by Deployment Mode 2019 & 2032
- Table 34: Global AR Automation Industry Revenue Million Forecast, by Size of the Organization 2019 & 2032
- Table 35: Global AR Automation Industry Revenue Million Forecast, by End-user Industry 2019 & 2032
- Table 36: Global AR Automation Industry Revenue Million Forecast, by Country 2019 & 2032
- Table 37: Global AR Automation Industry Revenue Million Forecast, by Component 2019 & 2032
- Table 38: Global AR Automation Industry Revenue Million Forecast, by Deployment Mode 2019 & 2032
- Table 39: Global AR Automation Industry Revenue Million Forecast, by Size of the Organization 2019 & 2032
- Table 40: Global AR Automation Industry Revenue Million Forecast, by End-user Industry 2019 & 2032
- Table 41: Global AR Automation Industry Revenue Million Forecast, by Country 2019 & 2032
- Table 42: Global AR Automation Industry Revenue Million Forecast, by Component 2019 & 2032
- Table 43: Global AR Automation Industry Revenue Million Forecast, by Deployment Mode 2019 & 2032
- Table 44: Global AR Automation Industry Revenue Million Forecast, by Size of the Organization 2019 & 2032
- Table 45: Global AR Automation Industry Revenue Million Forecast, by End-user Industry 2019 & 2032
- Table 46: Global AR Automation Industry Revenue Million Forecast, by Country 2019 & 2032
Frequently Asked Questions
1. What is the projected Compound Annual Growth Rate (CAGR) of the AR Automation Industry?
The projected CAGR is approximately 11.84%.
2. Which companies are prominent players in the AR Automation Industry?
Key companies in the market include Workday Inc, Corcentric LLC, HighRadius Corporation, Bill com Holdings Inc, Kofax Inc, Qvalia AB, Quadient (YayPay Inc ), Esker Inc *List Not Exhaustive, Oracle Corporation, Comarch SA, MHC Automation, SK Global Software, SAP SE.
3. What are the main segments of the AR Automation Industry?
The market segments include Component, Deployment Mode, Size of the Organization, End-user Industry.
4. Can you provide details about the market size?
The market size is estimated to be USD 3.04 Million as of 2022.
5. What are some drivers contributing to market growth?
Improve Business Efficiency by Improving Cash Flow and Reducing Costs and Accounting Cycle Time; Increasing Adoption of Technologies like Cloud Computing and AI.
6. What are the notable trends driving market growth?
Increasing Adoption of Technologies Such as Cloud Computing and AI.
7. Are there any restraints impacting market growth?
Complex Procedure of Invoicing and Payment Management; Privacy and Security Concerns.
8. Can you provide examples of recent developments in the market?
September 2022 - Regate, a Paris-based Software-as-a-Service (SaaS) platform for finance automation, secured a USD 20 million Series A funding round led by Valar Ventures. By automating repetitive operations, compiling financial data onto a single platform, and enhancing team communication, Regate assists accounting firms and finance departments in saving time. The platform used by Regate offers features including virtual and physical bank cards, payments, reconciliation, accounts payable and receivable, and budget and purchase requests. The company would use this money to expand its business further by developing software for small and medium enterprises.
9. What pricing options are available for accessing the report?
Pricing options include single-user, multi-user, and enterprise licenses priced at USD 4750, USD 5250, and USD 8750 respectively.
10. Is the market size provided in terms of value or volume?
The market size is provided in terms of value, measured in Million.
11. Are there any specific market keywords associated with the report?
Yes, the market keyword associated with the report is "AR Automation Industry," which aids in identifying and referencing the specific market segment covered.
12. How do I determine which pricing option suits my needs best?
The pricing options vary based on user requirements and access needs. Individual users may opt for single-user licenses, while businesses requiring broader access may choose multi-user or enterprise licenses for cost-effective access to the report.
13. Are there any additional resources or data provided in the AR Automation Industry report?
While the report offers comprehensive insights, it's advisable to review the specific contents or supplementary materials provided to ascertain if additional resources or data are available.
14. How can I stay updated on further developments or reports in the AR Automation Industry?
To stay informed about further developments, trends, and reports in the AR Automation Industry, consider subscribing to industry newsletters, following relevant companies and organizations, or regularly checking reputable industry news sources and publications.
Methodology
Step 1 - Identification of Relevant Samples Size from Population Database


Step 2 - Approaches for Defining Global Market Size (Value, Volume* & Price*)

Note*: In applicable scenarios
Step 3 - Data Sources
Primary Research
- Web Analytics
- Survey Reports
- Research Institute
- Latest Research Reports
- Opinion Leaders
Secondary Research
- Annual Reports
- White Paper
- Latest Press Release
- Industry Association
- Paid Database
- Investor Presentations

Step 4 - Data Triangulation
Involves using different sources of information in order to increase the validity of a study
These sources are likely to be stakeholders in a program - participants, other researchers, program staff, other community members, and so on.
Then we put all data in single framework & apply various statistical tools to find out the dynamic on the market.
During the analysis stage, feedback from the stakeholder groups would be compared to determine areas of agreement as well as areas of divergence
