

Key Insights
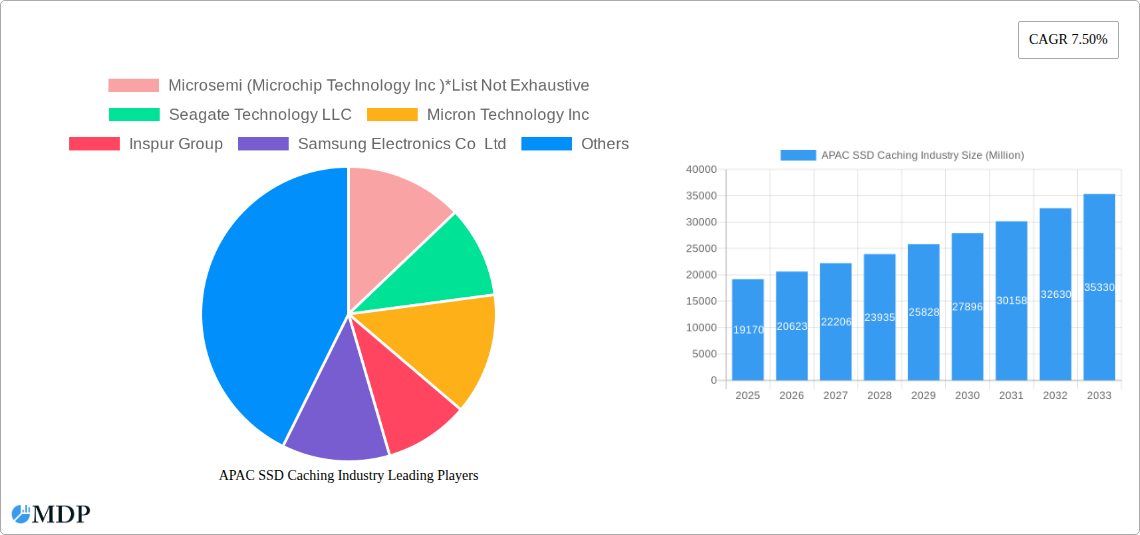
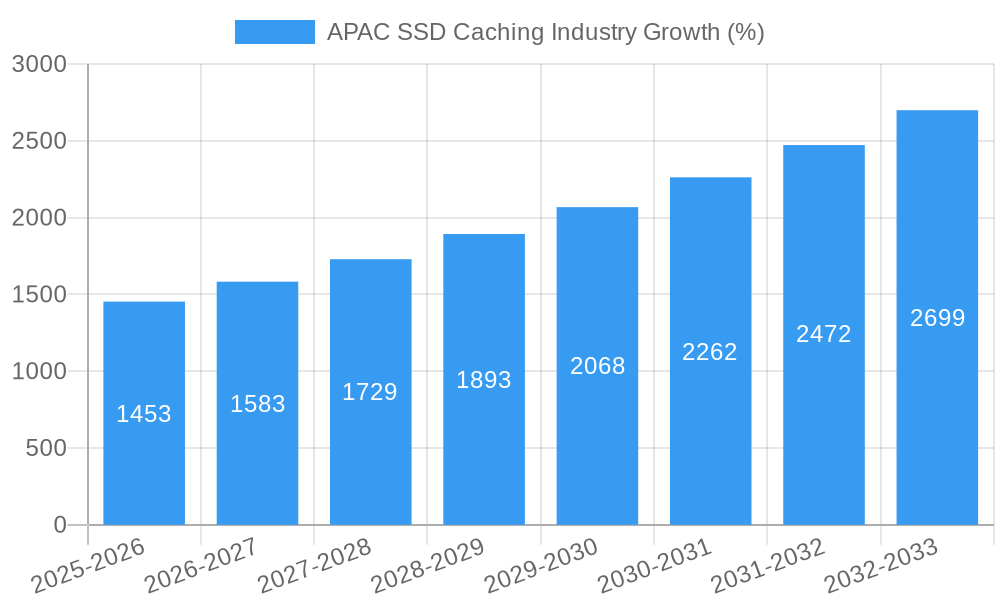
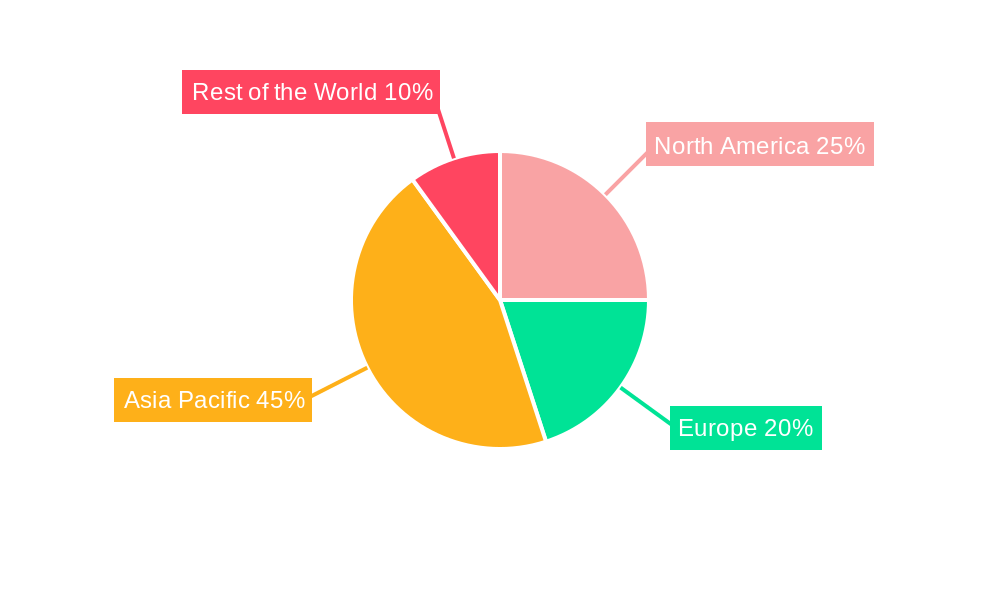
The Asia-Pacific (APAC) SSD caching market, valued at approximately $19.17 billion in 2025, is poised for robust growth, exhibiting a Compound Annual Growth Rate (CAGR) of 7.50% from 2025 to 2033. This expansion is driven by several key factors. The increasing adoption of cloud computing and big data analytics necessitates high-speed data storage and retrieval, making SSD caching a crucial technology. Furthermore, the rising demand for faster data processing across diverse sectors, including enterprise storage and personal use, fuels market growth. China, Japan, South Korea, and India are major contributors to the APAC market, reflecting the region's technological advancement and expanding digital economy. However, potential restraints include the relatively high initial investment cost associated with SSD caching solutions and the emergence of alternative technologies competing for market share. The market segmentation reveals a significant share held by the enterprise storage sector, driven by the substantial data processing needs of large organizations. Key players like Seagate, Micron, Samsung, and Western Digital are at the forefront of innovation and competition, continuously improving SSD caching technology to meet evolving market demands.
The forecast period of 2025-2033 promises sustained growth, with significant opportunities in emerging economies within APAC. The expansion of 5G networks and the Internet of Things (IoT) will further augment demand for efficient data management solutions, underpinning the continued growth trajectory of the SSD caching market. However, companies must adapt to address cost considerations and competition from other storage technologies. A focus on developing energy-efficient and scalable solutions will be critical for long-term success in this dynamic and evolving market. Strategic partnerships and collaborations among technology providers and end-users will play a pivotal role in shaping the landscape of the APAC SSD caching market in the coming years.
APAC SSD Caching Industry: A Comprehensive Market Report (2019-2033)
This comprehensive report provides an in-depth analysis of the Asia-Pacific (APAC) Solid State Drive (SSD) caching industry, offering invaluable insights for stakeholders across the value chain. From market size and segmentation to key players and future trends, this report equips you with the data-driven intelligence needed to navigate this rapidly evolving landscape. The study period covers 2019-2033, with a base year of 2025 and a forecast period of 2025-2033.
APAC SSD Caching Industry Market Dynamics & Concentration
The APAC SSD caching market is characterized by a moderately concentrated landscape, with several multinational corporations and regional players vying for market share. The market’s dynamics are shaped by several key factors:
- Market Concentration: While precise market share figures for individual companies are unavailable publicly (xx%), leading players like Samsung Electronics Co Ltd, Western Digital Corporation, and Micron Technology Inc. hold significant positions. However, the market also features numerous smaller, specialized players, fostering competition and innovation.
- Innovation Drivers: The relentless pursuit of faster data processing speeds and lower latency drives innovation in SSD caching technologies. Advancements in NVMe technology, higher storage densities, and improved controller designs are key drivers.
- Regulatory Frameworks: Government initiatives promoting digital infrastructure development and data center modernization across APAC nations (e.g., China's "Digital China" initiative) create favorable conditions for SSD caching adoption. However, data privacy regulations in some countries may present challenges.
- Product Substitutes: While SSDs are currently the dominant technology, other storage technologies like HDDs continue to compete in certain segments, particularly those with less demanding performance requirements. Emerging technologies like Optane memory might pose future challenges.
- End-User Trends: The increasing adoption of cloud computing, big data analytics, and artificial intelligence (AI) is fueling demand for high-performance storage solutions, including SSD caching. The rise of edge computing is further contributing to SSD caching demand.
- M&A Activities: The SSD caching industry has witnessed a moderate level of merger and acquisition (M&A) activity in recent years (xx M&A deals between 2019-2024). These activities are expected to reshape the competitive landscape and drive consolidation.
APAC SSD Caching Industry Industry Trends & Analysis
The APAC SSD caching market is experiencing robust growth, driven by several key trends:
The market is projected to register a Compound Annual Growth Rate (CAGR) of xx% during the forecast period (2025-2033). Market penetration of SSD caching solutions across various industries is increasing, particularly within the enterprise storage segment. Technological advancements such as NVMe over Fabrics are further driving higher speeds and scalability. Consumer preferences shift toward faster boot times and application loading in personal devices further boosts the market for personal storage. The competitive dynamics are intense, with major players focusing on product differentiation, technological innovation, and strategic partnerships. Price competition remains significant, especially in the consumer segment. The overall market demonstrates a positive outlook, propelled by growing data volumes, cloud adoption, and ongoing technological progress.
Leading Markets & Segments in APAC SSD Caching Industry
China currently holds the dominant position in the APAC SSD caching market, accounting for a significant market share (xx%). This dominance stems from a combination of factors:
China: Large and rapidly growing data center infrastructure, strong government support for digital transformation, and a large domestic market for consumer electronics.
Japan: A well-established technology sector and high adoption of advanced technologies contribute to solid market growth.
India: A rapidly expanding digital economy and increasing government investment in digital infrastructure position it for significant growth, albeit from a smaller base.
South Korea: A hub for advanced technology manufacturing and strong domestic demand for high-performance storage.
Rest of Asia Pacific: While individually smaller, these markets collectively represent a substantial portion of the regional market, driven by varying levels of economic growth and digital adoption.
By Application: The enterprise storage segment is currently the largest, given the high demand for improved performance in data centers and corporate IT environments. The personal storage segment is growing rapidly fueled by consumer preferences for faster and more responsive computing devices.
APAC SSD Caching Industry Product Developments
Recent product developments highlight the ongoing drive towards higher performance, greater capacity, and enhanced features. Examples include Lenovo's ThinkSystem DM5000H with its significant storage scalability and QNAP's TS-1655 2.5GbE NAS, offering a hybrid storage architecture for balanced performance and cost. These advancements underscore the industry's focus on meeting the demands of increasingly data-intensive applications and diverse user needs. Technological advancements like NVMe SSDs and advanced RAID configurations are key differentiators.
Key Drivers of APAC SSD Caching Industry Growth
Several key factors are driving the growth of the APAC SSD caching industry:
- Technological advancements: The ongoing development of faster and more efficient SSD technologies, including NVMe, continues to enhance performance and reduce latency.
- Economic growth: The strong economic growth across many APAC nations fuels increased investment in IT infrastructure and data center expansion.
- Government initiatives: Government policies promoting digitalization and cloud computing adoption in numerous APAC countries provide a favorable regulatory environment for growth.
- Data explosion: The exponential growth of data necessitates advanced storage solutions capable of handling large volumes of information quickly and efficiently.
Challenges in the APAC SSD Caching Industry Market
The APAC SSD caching market faces several challenges:
- Supply chain disruptions: Global supply chain instability can impact the availability and pricing of SSD components, impacting profitability and market stability. (Estimated impact: xx% fluctuation in pricing in 2024)
- Price competition: Intense competition, particularly among larger players, can lead to price wars, reducing profit margins.
- Regulatory hurdles: Varying data privacy and security regulations across APAC nations present compliance challenges.
Emerging Opportunities in APAC SSD Caching Industry
Several promising opportunities exist within the APAC SSD caching market:
The convergence of 5G and edge computing creates enormous opportunities for innovative SSD caching solutions tailored for low-latency applications. Strategic partnerships between SSD manufacturers and cloud service providers will further enable the expansion of SSD caching capabilities within cloud environments. Expanding into emerging markets within APAC and focusing on niche applications, particularly those with stringent performance requirements (high-frequency trading, AI applications), offers substantial growth potential.
Leading Players in the APAC SSD Caching Industry Sector
- Micron Technology Inc
- Seagate Technology LLC
- Samsung Electronics Co Ltd
- Transcend Information Inc
- Kioxia (Toshiba Memory Corporation)
- ADATA Technology Co Ltd
- Western Digital Corporation
- SK Hynix Inc
- NetApp Inc
- Intel Corporation
- QNAP Systems Inc
- Inspur Group
- Microsemi (Microchip Technology Inc)
Key Milestones in APAC SSD Caching Industry Industry
- July 2023: Lenovo launched the updated ThinkSystem DM5000H, significantly increasing storage capacity and offering unified file and block storage connectivity. This highlights the trend towards higher capacity and more versatile storage solutions.
- January 2023: QNAP Systems, Inc. introduced the high-capacity TS-1655 tower 2.5GbE NAS with a hybrid storage architecture, demonstrating a focus on balancing performance and cost-effectiveness.
Strategic Outlook for APAC SSD Caching Industry Market
The APAC SSD caching market exhibits strong growth potential, driven by continuous technological advancements, increasing demand from diverse industries, and supportive government policies. Companies focused on innovation, strategic partnerships, and efficient supply chain management will be best positioned to capitalize on the numerous growth opportunities across diverse APAC nations. The continued shift towards cloud computing and the expansion of edge computing applications will present key avenues for future expansion and innovation in the coming years.
APAC SSD Caching Industry Segmentation
-
1. Application
- 1.1. Enterprise Storage
- 1.2. Personal Storage
APAC SSD Caching Industry Segmentation By Geography
-
1. North America
- 1.1. United States
- 1.2. Canada
- 1.3. Mexico
-
2. South America
- 2.1. Brazil
- 2.2. Argentina
- 2.3. Rest of South America
-
3. Europe
- 3.1. United Kingdom
- 3.2. Germany
- 3.3. France
- 3.4. Italy
- 3.5. Spain
- 3.6. Russia
- 3.7. Benelux
- 3.8. Nordics
- 3.9. Rest of Europe
-
4. Middle East & Africa
- 4.1. Turkey
- 4.2. Israel
- 4.3. GCC
- 4.4. North Africa
- 4.5. South Africa
- 4.6. Rest of Middle East & Africa
-
5. Asia Pacific
- 5.1. China
- 5.2. India
- 5.3. Japan
- 5.4. South Korea
- 5.5. ASEAN
- 5.6. Oceania
- 5.7. Rest of Asia Pacific
APAC SSD Caching Industry REPORT HIGHLIGHTS
| Aspects | Details |
|---|---|
| Study Period | 2019-2033 |
| Base Year | 2024 |
| Estimated Year | 2025 |
| Forecast Period | 2025-2033 |
| Historical Period | 2019-2024 |
| Growth Rate | CAGR of 7.50% from 2019-2033 |
| Segmentation |
|
Table of Contents
- 1. Introduction
- 1.1. Research Scope
- 1.2. Market Segmentation
- 1.3. Research Methodology
- 1.4. Definitions and Assumptions
- 2. Executive Summary
- 2.1. Introduction
- 3. Market Dynamics
- 3.1. Introduction
- 3.2. Market Drivers
- 3.2.1. Improvements Offered by SSDs Over Conventional HDDs
- 3.3. Market Restrains
- 3.3.1. Slow Pace in Development of Applications Despite Heavy investments in R&D; Commplexities in Hardware Designing
- 3.4. Market Trends
- 3.4.1. Enterprise Storage Application Segment is Expected to Hold Significant Market Share
- 4. Market Factor Analysis
- 4.1. Porters Five Forces
- 4.2. Supply/Value Chain
- 4.3. PESTEL analysis
- 4.4. Market Entropy
- 4.5. Patent/Trademark Analysis
- 5. Global APAC SSD Caching Industry Analysis, Insights and Forecast, 2019-2031
- 5.1. Market Analysis, Insights and Forecast - by Application
- 5.1.1. Enterprise Storage
- 5.1.2. Personal Storage
- 5.2. Market Analysis, Insights and Forecast - by Region
- 5.2.1. North America
- 5.2.2. South America
- 5.2.3. Europe
- 5.2.4. Middle East & Africa
- 5.2.5. Asia Pacific
- 5.1. Market Analysis, Insights and Forecast - by Application
- 6. North America APAC SSD Caching Industry Analysis, Insights and Forecast, 2019-2031
- 6.1. Market Analysis, Insights and Forecast - by Application
- 6.1.1. Enterprise Storage
- 6.1.2. Personal Storage
- 6.1. Market Analysis, Insights and Forecast - by Application
- 7. South America APAC SSD Caching Industry Analysis, Insights and Forecast, 2019-2031
- 7.1. Market Analysis, Insights and Forecast - by Application
- 7.1.1. Enterprise Storage
- 7.1.2. Personal Storage
- 7.1. Market Analysis, Insights and Forecast - by Application
- 8. Europe APAC SSD Caching Industry Analysis, Insights and Forecast, 2019-2031
- 8.1. Market Analysis, Insights and Forecast - by Application
- 8.1.1. Enterprise Storage
- 8.1.2. Personal Storage
- 8.1. Market Analysis, Insights and Forecast - by Application
- 9. Middle East & Africa APAC SSD Caching Industry Analysis, Insights and Forecast, 2019-2031
- 9.1. Market Analysis, Insights and Forecast - by Application
- 9.1.1. Enterprise Storage
- 9.1.2. Personal Storage
- 9.1. Market Analysis, Insights and Forecast - by Application
- 10. Asia Pacific APAC SSD Caching Industry Analysis, Insights and Forecast, 2019-2031
- 10.1. Market Analysis, Insights and Forecast - by Application
- 10.1.1. Enterprise Storage
- 10.1.2. Personal Storage
- 10.1. Market Analysis, Insights and Forecast - by Application
- 11. North America APAC SSD Caching Industry Analysis, Insights and Forecast, 2019-2031
- 11.1. Market Analysis, Insights and Forecast - By Country/Sub-region
- 11.1.1 United States
- 11.1.2 Canada
- 12. Europe APAC SSD Caching Industry Analysis, Insights and Forecast, 2019-2031
- 12.1. Market Analysis, Insights and Forecast - By Country/Sub-region
- 12.1.1 Germany
- 12.1.2 United Kingdom
- 12.1.3 France
- 12.1.4 Rest of Europe
- 13. Asia Pacific APAC SSD Caching Industry Analysis, Insights and Forecast, 2019-2031
- 13.1. Market Analysis, Insights and Forecast - By Country/Sub-region
- 13.1.1 China
- 13.1.2 Taiwan
- 13.1.3 South Korea
- 13.1.4 Rest of Asia Pacific
- 14. Rest of the World APAC SSD Caching Industry Analysis, Insights and Forecast, 2019-2031
- 14.1. Market Analysis, Insights and Forecast - By Country/Sub-region
- 14.1.1.
- 15. Competitive Analysis
- 15.1. Global Market Share Analysis 2024
- 15.2. Company Profiles
- 15.2.1 Microsemi (Microchip Technology Inc )*List Not Exhaustive
- 15.2.1.1. Overview
- 15.2.1.2. Products
- 15.2.1.3. SWOT Analysis
- 15.2.1.4. Recent Developments
- 15.2.1.5. Financials (Based on Availability)
- 15.2.2 Seagate Technology LLC
- 15.2.2.1. Overview
- 15.2.2.2. Products
- 15.2.2.3. SWOT Analysis
- 15.2.2.4. Recent Developments
- 15.2.2.5. Financials (Based on Availability)
- 15.2.3 Micron Technology Inc
- 15.2.3.1. Overview
- 15.2.3.2. Products
- 15.2.3.3. SWOT Analysis
- 15.2.3.4. Recent Developments
- 15.2.3.5. Financials (Based on Availability)
- 15.2.4 Inspur Group
- 15.2.4.1. Overview
- 15.2.4.2. Products
- 15.2.4.3. SWOT Analysis
- 15.2.4.4. Recent Developments
- 15.2.4.5. Financials (Based on Availability)
- 15.2.5 Samsung Electronics Co Ltd
- 15.2.5.1. Overview
- 15.2.5.2. Products
- 15.2.5.3. SWOT Analysis
- 15.2.5.4. Recent Developments
- 15.2.5.5. Financials (Based on Availability)
- 15.2.6 Transcend Information Inc
- 15.2.6.1. Overview
- 15.2.6.2. Products
- 15.2.6.3. SWOT Analysis
- 15.2.6.4. Recent Developments
- 15.2.6.5. Financials (Based on Availability)
- 15.2.7 Kioxia (Toshiba Memory Corporation)
- 15.2.7.1. Overview
- 15.2.7.2. Products
- 15.2.7.3. SWOT Analysis
- 15.2.7.4. Recent Developments
- 15.2.7.5. Financials (Based on Availability)
- 15.2.8 ADATA Technology Co Ltd
- 15.2.8.1. Overview
- 15.2.8.2. Products
- 15.2.8.3. SWOT Analysis
- 15.2.8.4. Recent Developments
- 15.2.8.5. Financials (Based on Availability)
- 15.2.9 Western Digital Corporation
- 15.2.9.1. Overview
- 15.2.9.2. Products
- 15.2.9.3. SWOT Analysis
- 15.2.9.4. Recent Developments
- 15.2.9.5. Financials (Based on Availability)
- 15.2.10 SK Hynix Inc
- 15.2.10.1. Overview
- 15.2.10.2. Products
- 15.2.10.3. SWOT Analysis
- 15.2.10.4. Recent Developments
- 15.2.10.5. Financials (Based on Availability)
- 15.2.11 NetApp Inc
- 15.2.11.1. Overview
- 15.2.11.2. Products
- 15.2.11.3. SWOT Analysis
- 15.2.11.4. Recent Developments
- 15.2.11.5. Financials (Based on Availability)
- 15.2.12 Intel Corporation
- 15.2.12.1. Overview
- 15.2.12.2. Products
- 15.2.12.3. SWOT Analysis
- 15.2.12.4. Recent Developments
- 15.2.12.5. Financials (Based on Availability)
- 15.2.13 QNAP Systems Inc
- 15.2.13.1. Overview
- 15.2.13.2. Products
- 15.2.13.3. SWOT Analysis
- 15.2.13.4. Recent Developments
- 15.2.13.5. Financials (Based on Availability)
- 15.2.1 Microsemi (Microchip Technology Inc )*List Not Exhaustive
List of Figures
- Figure 1: Global APAC SSD Caching Industry Revenue Breakdown (Million, %) by Region 2024 & 2032
- Figure 2: North America APAC SSD Caching Industry Revenue (Million), by Country 2024 & 2032
- Figure 3: North America APAC SSD Caching Industry Revenue Share (%), by Country 2024 & 2032
- Figure 4: Europe APAC SSD Caching Industry Revenue (Million), by Country 2024 & 2032
- Figure 5: Europe APAC SSD Caching Industry Revenue Share (%), by Country 2024 & 2032
- Figure 6: Asia Pacific APAC SSD Caching Industry Revenue (Million), by Country 2024 & 2032
- Figure 7: Asia Pacific APAC SSD Caching Industry Revenue Share (%), by Country 2024 & 2032
- Figure 8: Rest of the World APAC SSD Caching Industry Revenue (Million), by Country 2024 & 2032
- Figure 9: Rest of the World APAC SSD Caching Industry Revenue Share (%), by Country 2024 & 2032
- Figure 10: North America APAC SSD Caching Industry Revenue (Million), by Application 2024 & 2032
- Figure 11: North America APAC SSD Caching Industry Revenue Share (%), by Application 2024 & 2032
- Figure 12: North America APAC SSD Caching Industry Revenue (Million), by Country 2024 & 2032
- Figure 13: North America APAC SSD Caching Industry Revenue Share (%), by Country 2024 & 2032
- Figure 14: South America APAC SSD Caching Industry Revenue (Million), by Application 2024 & 2032
- Figure 15: South America APAC SSD Caching Industry Revenue Share (%), by Application 2024 & 2032
- Figure 16: South America APAC SSD Caching Industry Revenue (Million), by Country 2024 & 2032
- Figure 17: South America APAC SSD Caching Industry Revenue Share (%), by Country 2024 & 2032
- Figure 18: Europe APAC SSD Caching Industry Revenue (Million), by Application 2024 & 2032
- Figure 19: Europe APAC SSD Caching Industry Revenue Share (%), by Application 2024 & 2032
- Figure 20: Europe APAC SSD Caching Industry Revenue (Million), by Country 2024 & 2032
- Figure 21: Europe APAC SSD Caching Industry Revenue Share (%), by Country 2024 & 2032
- Figure 22: Middle East & Africa APAC SSD Caching Industry Revenue (Million), by Application 2024 & 2032
- Figure 23: Middle East & Africa APAC SSD Caching Industry Revenue Share (%), by Application 2024 & 2032
- Figure 24: Middle East & Africa APAC SSD Caching Industry Revenue (Million), by Country 2024 & 2032
- Figure 25: Middle East & Africa APAC SSD Caching Industry Revenue Share (%), by Country 2024 & 2032
- Figure 26: Asia Pacific APAC SSD Caching Industry Revenue (Million), by Application 2024 & 2032
- Figure 27: Asia Pacific APAC SSD Caching Industry Revenue Share (%), by Application 2024 & 2032
- Figure 28: Asia Pacific APAC SSD Caching Industry Revenue (Million), by Country 2024 & 2032
- Figure 29: Asia Pacific APAC SSD Caching Industry Revenue Share (%), by Country 2024 & 2032
List of Tables
- Table 1: Global APAC SSD Caching Industry Revenue Million Forecast, by Region 2019 & 2032
- Table 2: Global APAC SSD Caching Industry Revenue Million Forecast, by Application 2019 & 2032
- Table 3: Global APAC SSD Caching Industry Revenue Million Forecast, by Region 2019 & 2032
- Table 4: Global APAC SSD Caching Industry Revenue Million Forecast, by Country 2019 & 2032
- Table 5: United States APAC SSD Caching Industry Revenue (Million) Forecast, by Application 2019 & 2032
- Table 6: Canada APAC SSD Caching Industry Revenue (Million) Forecast, by Application 2019 & 2032
- Table 7: Global APAC SSD Caching Industry Revenue Million Forecast, by Country 2019 & 2032
- Table 8: Germany APAC SSD Caching Industry Revenue (Million) Forecast, by Application 2019 & 2032
- Table 9: United Kingdom APAC SSD Caching Industry Revenue (Million) Forecast, by Application 2019 & 2032
- Table 10: France APAC SSD Caching Industry Revenue (Million) Forecast, by Application 2019 & 2032
- Table 11: Rest of Europe APAC SSD Caching Industry Revenue (Million) Forecast, by Application 2019 & 2032
- Table 12: Global APAC SSD Caching Industry Revenue Million Forecast, by Country 2019 & 2032
- Table 13: China APAC SSD Caching Industry Revenue (Million) Forecast, by Application 2019 & 2032
- Table 14: Taiwan APAC SSD Caching Industry Revenue (Million) Forecast, by Application 2019 & 2032
- Table 15: South Korea APAC SSD Caching Industry Revenue (Million) Forecast, by Application 2019 & 2032
- Table 16: Rest of Asia Pacific APAC SSD Caching Industry Revenue (Million) Forecast, by Application 2019 & 2032
- Table 17: Global APAC SSD Caching Industry Revenue Million Forecast, by Country 2019 & 2032
- Table 18: APAC SSD Caching Industry Revenue (Million) Forecast, by Application 2019 & 2032
- Table 19: Global APAC SSD Caching Industry Revenue Million Forecast, by Application 2019 & 2032
- Table 20: Global APAC SSD Caching Industry Revenue Million Forecast, by Country 2019 & 2032
- Table 21: United States APAC SSD Caching Industry Revenue (Million) Forecast, by Application 2019 & 2032
- Table 22: Canada APAC SSD Caching Industry Revenue (Million) Forecast, by Application 2019 & 2032
- Table 23: Mexico APAC SSD Caching Industry Revenue (Million) Forecast, by Application 2019 & 2032
- Table 24: Global APAC SSD Caching Industry Revenue Million Forecast, by Application 2019 & 2032
- Table 25: Global APAC SSD Caching Industry Revenue Million Forecast, by Country 2019 & 2032
- Table 26: Brazil APAC SSD Caching Industry Revenue (Million) Forecast, by Application 2019 & 2032
- Table 27: Argentina APAC SSD Caching Industry Revenue (Million) Forecast, by Application 2019 & 2032
- Table 28: Rest of South America APAC SSD Caching Industry Revenue (Million) Forecast, by Application 2019 & 2032
- Table 29: Global APAC SSD Caching Industry Revenue Million Forecast, by Application 2019 & 2032
- Table 30: Global APAC SSD Caching Industry Revenue Million Forecast, by Country 2019 & 2032
- Table 31: United Kingdom APAC SSD Caching Industry Revenue (Million) Forecast, by Application 2019 & 2032
- Table 32: Germany APAC SSD Caching Industry Revenue (Million) Forecast, by Application 2019 & 2032
- Table 33: France APAC SSD Caching Industry Revenue (Million) Forecast, by Application 2019 & 2032
- Table 34: Italy APAC SSD Caching Industry Revenue (Million) Forecast, by Application 2019 & 2032
- Table 35: Spain APAC SSD Caching Industry Revenue (Million) Forecast, by Application 2019 & 2032
- Table 36: Russia APAC SSD Caching Industry Revenue (Million) Forecast, by Application 2019 & 2032
- Table 37: Benelux APAC SSD Caching Industry Revenue (Million) Forecast, by Application 2019 & 2032
- Table 38: Nordics APAC SSD Caching Industry Revenue (Million) Forecast, by Application 2019 & 2032
- Table 39: Rest of Europe APAC SSD Caching Industry Revenue (Million) Forecast, by Application 2019 & 2032
- Table 40: Global APAC SSD Caching Industry Revenue Million Forecast, by Application 2019 & 2032
- Table 41: Global APAC SSD Caching Industry Revenue Million Forecast, by Country 2019 & 2032
- Table 42: Turkey APAC SSD Caching Industry Revenue (Million) Forecast, by Application 2019 & 2032
- Table 43: Israel APAC SSD Caching Industry Revenue (Million) Forecast, by Application 2019 & 2032
- Table 44: GCC APAC SSD Caching Industry Revenue (Million) Forecast, by Application 2019 & 2032
- Table 45: North Africa APAC SSD Caching Industry Revenue (Million) Forecast, by Application 2019 & 2032
- Table 46: South Africa APAC SSD Caching Industry Revenue (Million) Forecast, by Application 2019 & 2032
- Table 47: Rest of Middle East & Africa APAC SSD Caching Industry Revenue (Million) Forecast, by Application 2019 & 2032
- Table 48: Global APAC SSD Caching Industry Revenue Million Forecast, by Application 2019 & 2032
- Table 49: Global APAC SSD Caching Industry Revenue Million Forecast, by Country 2019 & 2032
- Table 50: China APAC SSD Caching Industry Revenue (Million) Forecast, by Application 2019 & 2032
- Table 51: India APAC SSD Caching Industry Revenue (Million) Forecast, by Application 2019 & 2032
- Table 52: Japan APAC SSD Caching Industry Revenue (Million) Forecast, by Application 2019 & 2032
- Table 53: South Korea APAC SSD Caching Industry Revenue (Million) Forecast, by Application 2019 & 2032
- Table 54: ASEAN APAC SSD Caching Industry Revenue (Million) Forecast, by Application 2019 & 2032
- Table 55: Oceania APAC SSD Caching Industry Revenue (Million) Forecast, by Application 2019 & 2032
- Table 56: Rest of Asia Pacific APAC SSD Caching Industry Revenue (Million) Forecast, by Application 2019 & 2032
Frequently Asked Questions
1. What is the projected Compound Annual Growth Rate (CAGR) of the APAC SSD Caching Industry?
The projected CAGR is approximately 7.50%.
2. Which companies are prominent players in the APAC SSD Caching Industry?
Key companies in the market include Microsemi (Microchip Technology Inc )*List Not Exhaustive, Seagate Technology LLC, Micron Technology Inc, Inspur Group, Samsung Electronics Co Ltd, Transcend Information Inc, Kioxia (Toshiba Memory Corporation), ADATA Technology Co Ltd, Western Digital Corporation, SK Hynix Inc, NetApp Inc, Intel Corporation, QNAP Systems Inc.
3. What are the main segments of the APAC SSD Caching Industry?
The market segments include Application.
4. Can you provide details about the market size?
The market size is estimated to be USD 19.17 Million as of 2022.
5. What are some drivers contributing to market growth?
Improvements Offered by SSDs Over Conventional HDDs.
6. What are the notable trends driving market growth?
Enterprise Storage Application Segment is Expected to Hold Significant Market Share.
7. Are there any restraints impacting market growth?
Slow Pace in Development of Applications Despite Heavy investments in R&D; Commplexities in Hardware Designing.
8. Can you provide examples of recent developments in the market?
July 2023: Lenovo updated ThinkSystem DM5000H can scale up to 1.96 PB of raw storage capacity. A cluster of the DM5000H storage systems can scale up to 23.5 PB for NAS or up to 11.7 PB for SAN environments. The ThinkSystem DM5000H offers unified file and block storage connectivity with support for 1 GbE or 10 GbE NAS and iSCSI and 8 Gb or 16 Gb Fibre Channel protocols simultaneously. Acceleration of read-centric workloads with the high-speed, low-latency onboard NVMe SSD caching.
9. What pricing options are available for accessing the report?
Pricing options include single-user, multi-user, and enterprise licenses priced at USD 4750, USD 4950, and USD 6800 respectively.
10. Is the market size provided in terms of value or volume?
The market size is provided in terms of value, measured in Million.
11. Are there any specific market keywords associated with the report?
Yes, the market keyword associated with the report is "APAC SSD Caching Industry," which aids in identifying and referencing the specific market segment covered.
12. How do I determine which pricing option suits my needs best?
The pricing options vary based on user requirements and access needs. Individual users may opt for single-user licenses, while businesses requiring broader access may choose multi-user or enterprise licenses for cost-effective access to the report.
13. Are there any additional resources or data provided in the APAC SSD Caching Industry report?
While the report offers comprehensive insights, it's advisable to review the specific contents or supplementary materials provided to ascertain if additional resources or data are available.
14. How can I stay updated on further developments or reports in the APAC SSD Caching Industry?
To stay informed about further developments, trends, and reports in the APAC SSD Caching Industry, consider subscribing to industry newsletters, following relevant companies and organizations, or regularly checking reputable industry news sources and publications.
Methodology
Step 1 - Identification of Relevant Samples Size from Population Database


Step 2 - Approaches for Defining Global Market Size (Value, Volume* & Price*)

Note*: In applicable scenarios
Step 3 - Data Sources
Primary Research
- Web Analytics
- Survey Reports
- Research Institute
- Latest Research Reports
- Opinion Leaders
Secondary Research
- Annual Reports
- White Paper
- Latest Press Release
- Industry Association
- Paid Database
- Investor Presentations

Step 4 - Data Triangulation
Involves using different sources of information in order to increase the validity of a study
These sources are likely to be stakeholders in a program - participants, other researchers, program staff, other community members, and so on.
Then we put all data in single framework & apply various statistical tools to find out the dynamic on the market.
During the analysis stage, feedback from the stakeholder groups would be compared to determine areas of agreement as well as areas of divergence
