

Key Insights
The global anti-counterfeit measures in packaging market is poised for significant expansion, driven by escalating product counterfeiting across diverse industries. Projected to reach $204.08 billion by 2025, the market is forecast to grow at a Compound Annual Growth Rate (CAGR) of 9.4% from 2025 to 2033. This growth is underpinned by a rising demand for product authenticity and robust brand protection, particularly within the pharmaceutical, food & beverage, and consumer electronics sectors. Consumers' increasing desire for genuine products is accelerating the adoption of advanced solutions such as track and trace systems, tamper-evident packaging, and forensic markers. Furthermore, stringent regulatory mandates and heightened consumer awareness are key market accelerators. Innovations like blockchain integration and digital watermarking are enhancing the security and sophistication of anti-counterfeit solutions.
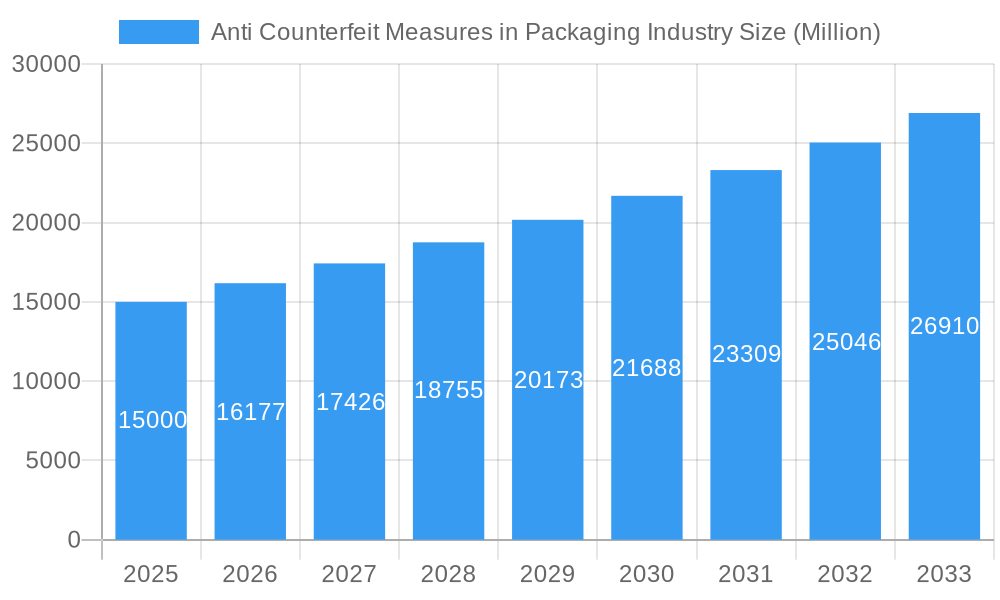
Anti Counterfeit Measures in Packaging Industry Market Size (In Billion)
Despite these positive trends, market growth is tempered by restraints. High initial implementation costs for advanced technologies can present a barrier for small and medium-sized enterprises (SMEs). The complexity of integrating these solutions into existing packaging workflows also poses a challenge. Nevertheless, the market outlook remains optimistic, fueled by the persistent need for effective brand protection and consumer safety. The market, segmented by technology and end-user industry, highlights the broad applicability of these measures. North America and Europe currently lead market share, with the Asia-Pacific region expected to experience substantial growth due to economic development and increasing consumer expenditure. Leading market participants are continuously innovating to deliver more efficient and cost-effective anti-counterfeiting solutions, further stimulating market expansion.
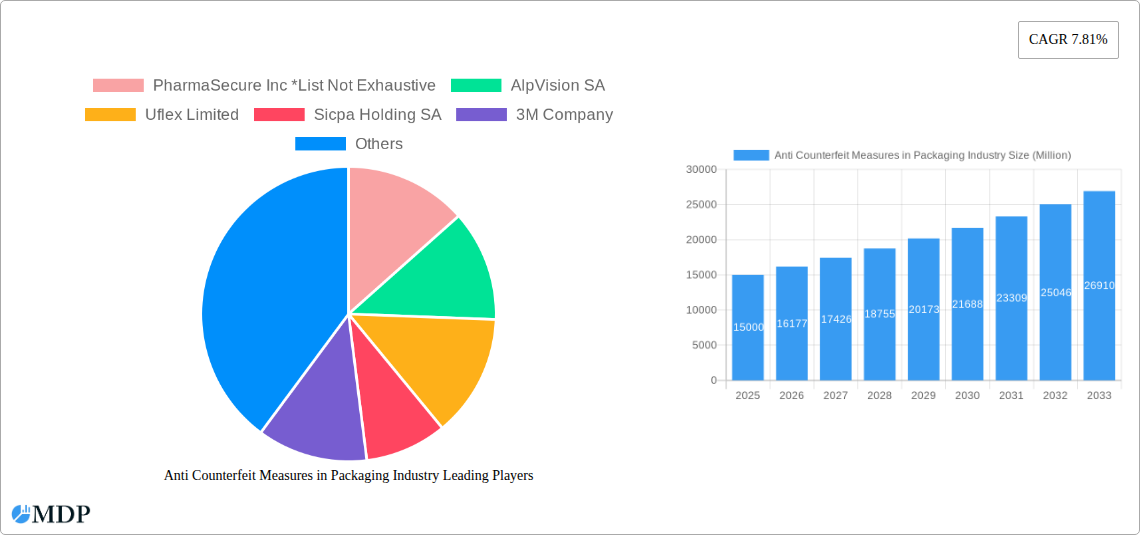
Anti Counterfeit Measures in Packaging Industry Company Market Share
Anti-Counterfeit Measures in Packaging Industry: A Comprehensive Market Report (2019-2033)
This comprehensive report provides a detailed analysis of the Anti-Counterfeit Measures in Packaging Industry, offering invaluable insights for stakeholders across the value chain. From market dynamics and leading players to emerging trends and future opportunities, this report is an essential resource for navigating this rapidly evolving landscape. The study period covers 2019-2033, with a base year of 2025 and a forecast period of 2025-2033. The global market size in 2025 is estimated at USD xx Billion.
Anti-Counterfeit Measures in Packaging Industry Market Dynamics & Concentration
The Anti-Counterfeit Measures in Packaging Industry is experiencing robust growth, driven by increasing consumer awareness of counterfeit products and stringent government regulations. Market concentration is moderately high, with several large multinational companies holding significant market share. However, the presence of numerous smaller, specialized players indicates a competitive landscape. Innovation is a key driver, with continuous advancements in technologies like Trace and Track, Tamper-evident, Covert, Overt, and Forensic Markers pushing the boundaries of product authentication. The industry is also shaped by evolving regulatory frameworks aimed at combating counterfeiting across diverse sectors. Mergers and acquisitions (M&A) activity is significant, with larger players strategically acquiring smaller companies to expand their product portfolio and market reach. For instance, Avery Dennison Corporation's USD 1.45 Billion acquisition of Vestcom in August 2021 illustrates this trend. The market is also witnessing the emergence of product substitutes, such as advanced digital authentication methods, posing both challenges and opportunities for traditional packaging solutions. End-user trends, particularly in the healthcare and pharmaceuticals sector, are significantly impacting market growth, demanding increasingly sophisticated and reliable anti-counterfeit solutions.
- Market Concentration: Moderately High (xx%)
- M&A Deal Count (2019-2024): xx
- Innovation Drivers: Advancements in digital technologies, material science, and printing techniques.
- Regulatory Impact: Increasingly stringent regulations across various industries are driving market adoption.
Anti-Counterfeit Measures in Packaging Industry Industry Trends & Analysis
The Anti-Counterfeit Measures in Packaging Industry is characterized by a robust CAGR of xx% during the forecast period (2025-2033), driven by several key factors. Rising consumer demand for authentic products, coupled with the increasing prevalence of counterfeiting across various industries, is a major impetus. Technological advancements, particularly in digital authentication and traceability technologies, are significantly enhancing the effectiveness and affordability of anti-counterfeit measures. Consumer preference for transparency and brand trust is also pushing brands to adopt robust authentication solutions. Intense competition amongst players is leading to continuous innovation and a wider range of solutions available to brands. Market penetration is expected to increase significantly, particularly in developing economies, as awareness of counterfeiting grows. This growth is not uniform across all technologies; Trace and Track solutions are currently experiencing faster adoption compared to more niche technologies like Forensic Markers. The market exhibits regional variations, with developed economies showing higher adoption rates than developing ones.
Leading Markets & Segments in Anti-Counterfeit Measures in Packaging Industry
The Healthcare and Pharmaceuticals segment dominates the end-user landscape, owing to stringent regulatory requirements and the high value of products. The Trace and Track technology segment holds the largest market share, due to its ability to provide comprehensive product tracking and authentication throughout the supply chain.
Leading Regions: North America and Europe currently hold significant market share, driven by high consumer awareness and stringent regulations. Asia-Pacific is projected to experience the fastest growth due to increasing economic development and rising awareness of counterfeiting.
Key Drivers by Segment:
- Healthcare and Pharmaceuticals: Stringent regulations, high product value, and consumer safety concerns.
- Food and Beverage: Brand protection, consumer safety, and preventing food fraud.
- Trace and Track: Ability to track products throughout the supply chain, enhancing traceability and authentication.
- Tamper-evident: Provides visual indication of tampering, enhancing consumer confidence.
Dominance Analysis:
North America and Europe benefit from established regulatory frameworks and higher consumer awareness. The Asia-Pacific region demonstrates strong growth potential driven by increasing economic activity and a rising middle class.
Anti-Counterfeit Measures in Packaging Industry Product Developments
Recent innovations focus on integrating advanced technologies like blockchain, RFID, and digital watermarks into packaging solutions. These developments enhance product traceability, tamper evidence, and authentication capabilities. Companies are also focusing on developing cost-effective and user-friendly solutions to broaden market adoption, particularly in developing economies. The competitive advantage lies in offering superior traceability, security, and convenience to consumers and brands.
Key Drivers of Anti-Counterfeit Measures in Packaging Industry Growth
Several factors fuel the growth of this market. Technological advancements, such as the integration of AI and machine learning in authentication systems, are enhancing accuracy and efficiency. Stringent government regulations in various industries, aiming to combat counterfeiting, are also driving demand. Rising consumer awareness of counterfeit products and a growing preference for genuine, authentic products increase demand for these solutions. The increasing adoption of e-commerce further intensifies the need for reliable anti-counterfeit measures.
Challenges in the Anti-Counterfeit Measures in Packaging Industry Market
High implementation costs can hinder adoption, particularly for small and medium-sized enterprises (SMEs). Supply chain complexities and the need for coordination across multiple stakeholders present logistical challenges. Counterfeiters constantly evolve their techniques, necessitating continuous innovation in anti-counterfeit solutions. Competitive pressures and the need for continuous innovation add to the market's complexity. Estimated loss due to counterfeiting is USD xx Billion annually, highlighting the magnitude of this challenge.
Emerging Opportunities in Anti-Counterfeit Measures in Packaging Industry
The integration of IoT and AI offers significant opportunities for enhanced product tracking and authentication. Strategic partnerships between packaging companies, technology providers, and brands can lead to innovative solutions. Expansion into developing economies with rising consumer awareness and stricter regulations presents substantial growth potential. Market expansion into new sectors, such as cosmetics and luxury goods, also offers significant growth avenues.
Leading Players in the Anti-Counterfeit Measures in Packaging Industry Sector
- PharmaSecure Inc
- AlpVision SA
- Uflex Limited
- Sicpa Holding SA
- 3M Company
- CCL Industries Inc
- Avery Dennison Corporation
- Applied DNA Sciences Inc
- Authentix Inc
- Zebra Technologies Corporation
- E I Du Pont De Nemours and Company
- Ampacet Corporation
Key Milestones in Anti-Counterfeit Measures in Packaging Industry Industry
- August 2021: Avery Dennison Corporation acquired Vestcom for USD 1.45 Billion, expanding its branded labeling offerings. This acquisition significantly strengthened Avery Dennison's position in the market.
Strategic Outlook for Anti-Counterfeit Measures in Packaging Industry Market
The Anti-Counterfeit Measures in Packaging Industry is poised for continued growth, driven by technological innovation, increasing regulatory scrutiny, and heightened consumer awareness. Strategic partnerships and investments in R&D will be critical for companies seeking to capitalize on this growth. Focus on developing cost-effective and user-friendly solutions will be crucial for expanding market penetration, especially in emerging economies. Companies that can effectively address the challenges of counterfeiting and offer integrated, comprehensive solutions will be best positioned for success.
Anti Counterfeit Measures in Packaging Industry Segmentation
-
1. Technology
- 1.1. Trace and Track
- 1.2. Tamper-evident
- 1.3. Covert
- 1.4. Overt
- 1.5. Forensic Markers
-
2. End User
- 2.1. Food and Beverage
- 2.2. Healthcare and Pharmaceuticals
- 2.3. Industrial and Automotive
- 2.4. Consumer Electronics
- 2.5. Other End Users
Anti Counterfeit Measures in Packaging Industry Segmentation By Geography
-
1. North America
- 1.1. United States
- 1.2. Canada
-
2. Europe
- 2.1. United Kingdom
- 2.2. Germany
- 2.3. France
- 2.4. Italy
- 2.5. Spain
- 2.6. Rest of Europe
-
3. Asia Pacific
- 3.1. China
- 3.2. India
- 3.3. Japan
- 3.4. Australia
- 3.5. Rest of Asia Pacific
-
4. Latin America
- 4.1. Brazil
- 4.2. Argentina
- 4.3. Rest of Latin America
- 5. Middle East
-
6. South Africa
- 6.1. United Arab Emirates
- 6.2. Rest of Middle East
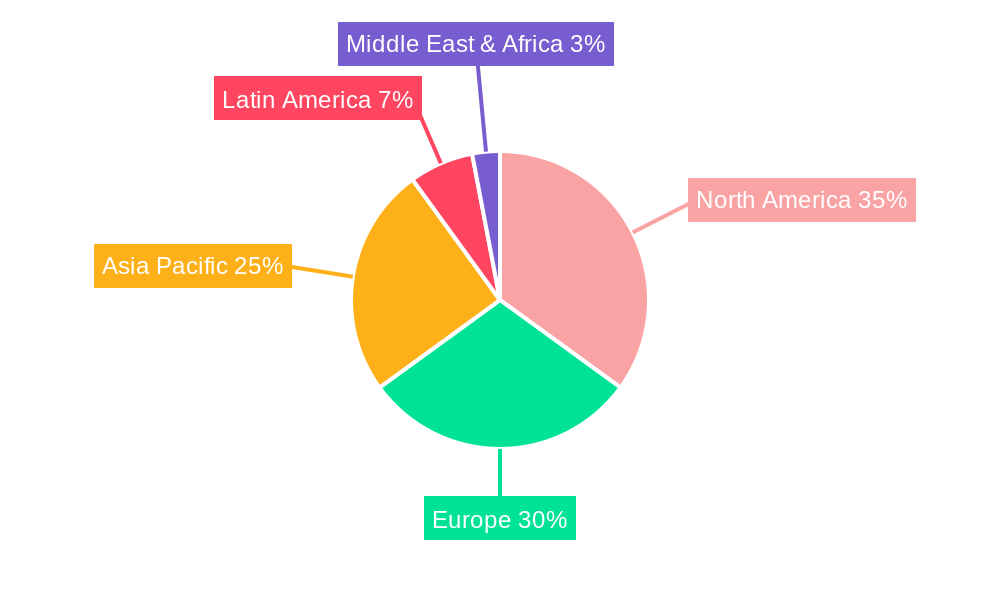
Anti Counterfeit Measures in Packaging Industry Regional Market Share
Geographic Coverage of Anti Counterfeit Measures in Packaging Industry
Anti Counterfeit Measures in Packaging Industry REPORT HIGHLIGHTS
| Aspects | Details |
|---|---|
| Study Period | 2020-2034 |
| Base Year | 2025 |
| Estimated Year | 2026 |
| Forecast Period | 2026-2034 |
| Historical Period | 2020-2025 |
| Growth Rate | CAGR of 9.4% from 2020-2034 |
| Segmentation |
|
Table of Contents
- 1. Introduction
- 1.1. Research Scope
- 1.2. Market Segmentation
- 1.3. Research Objective
- 1.4. Definitions and Assumptions
- 2. Executive Summary
- 2.1. Market Snapshot
- 3. Market Dynamics
- 3.1. Market Drivers
- 3.2. Market Restrains
- 3.3. Market Trends
- 3.4. Market Opportunities
- 4. Market Factor Analysis
- 4.1. Porters Five Forces
- 4.1.1. Bargaining Power of Suppliers
- 4.1.2. Bargaining Power of Buyers
- 4.1.3. Threat of New Entrants
- 4.1.4. Threat of Substitutes
- 4.1.5. Competitive Rivalry
- 4.2. PESTEL analysis
- 4.3. BCG Analysis
- 4.3.1. Stars (High Growth, High Market Share)
- 4.3.2. Cash Cows (Low Growth, High Market Share)
- 4.3.3. Question Mark (High Growth, Low Market Share)
- 4.3.4. Dogs (Low Growth, Low Market Share)
- 4.4. Ansoff Matrix Analysis
- 4.5. Supply Chain Analysis
- 4.6. Regulatory Landscape
- 4.7. Current Market Potential and Opportunity Assessment (TAM–SAM–SOM Framework)
- 4.8. MDP Analyst Note
- 4.1. Porters Five Forces
- 5. Market Analysis, Insights and Forecast 2021-2033
- 5.1. Market Analysis, Insights and Forecast - by Technology
- 5.1.1. Trace and Track
- 5.1.2. Tamper-evident
- 5.1.3. Covert
- 5.1.4. Overt
- 5.1.5. Forensic Markers
- 5.2. Market Analysis, Insights and Forecast - by End User
- 5.2.1. Food and Beverage
- 5.2.2. Healthcare and Pharmaceuticals
- 5.2.3. Industrial and Automotive
- 5.2.4. Consumer Electronics
- 5.2.5. Other End Users
- 5.3. Market Analysis, Insights and Forecast - by Region
- 5.3.1. North America
- 5.3.2. Europe
- 5.3.3. Asia Pacific
- 5.3.4. Latin America
- 5.3.5. Middle East
- 5.3.6. South Africa
- 5.1. Market Analysis, Insights and Forecast - by Technology
- 6. Global Anti Counterfeit Measures in Packaging Industry Analysis, Insights and Forecast, 2021-2033
- 6.1. Market Analysis, Insights and Forecast - by Technology
- 6.1.1. Trace and Track
- 6.1.2. Tamper-evident
- 6.1.3. Covert
- 6.1.4. Overt
- 6.1.5. Forensic Markers
- 6.2. Market Analysis, Insights and Forecast - by End User
- 6.2.1. Food and Beverage
- 6.2.2. Healthcare and Pharmaceuticals
- 6.2.3. Industrial and Automotive
- 6.2.4. Consumer Electronics
- 6.2.5. Other End Users
- 6.1. Market Analysis, Insights and Forecast - by Technology
- 7. North America Anti Counterfeit Measures in Packaging Industry Analysis, Insights and Forecast, 2020-2032
- 7.1. Market Analysis, Insights and Forecast - by Technology
- 7.1.1. Trace and Track
- 7.1.2. Tamper-evident
- 7.1.3. Covert
- 7.1.4. Overt
- 7.1.5. Forensic Markers
- 7.2. Market Analysis, Insights and Forecast - by End User
- 7.2.1. Food and Beverage
- 7.2.2. Healthcare and Pharmaceuticals
- 7.2.3. Industrial and Automotive
- 7.2.4. Consumer Electronics
- 7.2.5. Other End Users
- 7.1. Market Analysis, Insights and Forecast - by Technology
- 8. Europe Anti Counterfeit Measures in Packaging Industry Analysis, Insights and Forecast, 2020-2032
- 8.1. Market Analysis, Insights and Forecast - by Technology
- 8.1.1. Trace and Track
- 8.1.2. Tamper-evident
- 8.1.3. Covert
- 8.1.4. Overt
- 8.1.5. Forensic Markers
- 8.2. Market Analysis, Insights and Forecast - by End User
- 8.2.1. Food and Beverage
- 8.2.2. Healthcare and Pharmaceuticals
- 8.2.3. Industrial and Automotive
- 8.2.4. Consumer Electronics
- 8.2.5. Other End Users
- 8.1. Market Analysis, Insights and Forecast - by Technology
- 9. Asia Pacific Anti Counterfeit Measures in Packaging Industry Analysis, Insights and Forecast, 2020-2032
- 9.1. Market Analysis, Insights and Forecast - by Technology
- 9.1.1. Trace and Track
- 9.1.2. Tamper-evident
- 9.1.3. Covert
- 9.1.4. Overt
- 9.1.5. Forensic Markers
- 9.2. Market Analysis, Insights and Forecast - by End User
- 9.2.1. Food and Beverage
- 9.2.2. Healthcare and Pharmaceuticals
- 9.2.3. Industrial and Automotive
- 9.2.4. Consumer Electronics
- 9.2.5. Other End Users
- 9.1. Market Analysis, Insights and Forecast - by Technology
- 10. Latin America Anti Counterfeit Measures in Packaging Industry Analysis, Insights and Forecast, 2020-2032
- 10.1. Market Analysis, Insights and Forecast - by Technology
- 10.1.1. Trace and Track
- 10.1.2. Tamper-evident
- 10.1.3. Covert
- 10.1.4. Overt
- 10.1.5. Forensic Markers
- 10.2. Market Analysis, Insights and Forecast - by End User
- 10.2.1. Food and Beverage
- 10.2.2. Healthcare and Pharmaceuticals
- 10.2.3. Industrial and Automotive
- 10.2.4. Consumer Electronics
- 10.2.5. Other End Users
- 10.1. Market Analysis, Insights and Forecast - by Technology
- 11. Middle East Anti Counterfeit Measures in Packaging Industry Analysis, Insights and Forecast, 2020-2032
- 11.1. Market Analysis, Insights and Forecast - by Technology
- 11.1.1. Trace and Track
- 11.1.2. Tamper-evident
- 11.1.3. Covert
- 11.1.4. Overt
- 11.1.5. Forensic Markers
- 11.2. Market Analysis, Insights and Forecast - by End User
- 11.2.1. Food and Beverage
- 11.2.2. Healthcare and Pharmaceuticals
- 11.2.3. Industrial and Automotive
- 11.2.4. Consumer Electronics
- 11.2.5. Other End Users
- 11.1. Market Analysis, Insights and Forecast - by Technology
- 12. South Africa Anti Counterfeit Measures in Packaging Industry Analysis, Insights and Forecast, 2020-2032
- 12.1. Market Analysis, Insights and Forecast - by Technology
- 12.1.1. Trace and Track
- 12.1.2. Tamper-evident
- 12.1.3. Covert
- 12.1.4. Overt
- 12.1.5. Forensic Markers
- 12.2. Market Analysis, Insights and Forecast - by End User
- 12.2.1. Food and Beverage
- 12.2.2. Healthcare and Pharmaceuticals
- 12.2.3. Industrial and Automotive
- 12.2.4. Consumer Electronics
- 12.2.5. Other End Users
- 12.1. Market Analysis, Insights and Forecast - by Technology
- 13. Competitive Analysis
- 13.1. Company Profiles
- 13.1.1 PharmaSecure Inc *List Not Exhaustive
- 13.1.1.1. Company Overview
- 13.1.1.2. Products
- 13.1.1.3. Company Financials
- 13.1.1.4. SWOT Analysis
- 13.1.2 AlpVision SA
- 13.1.2.1. Company Overview
- 13.1.2.2. Products
- 13.1.2.3. Company Financials
- 13.1.2.4. SWOT Analysis
- 13.1.3 Uflex Limited
- 13.1.3.1. Company Overview
- 13.1.3.2. Products
- 13.1.3.3. Company Financials
- 13.1.3.4. SWOT Analysis
- 13.1.4 Sicpa Holding SA
- 13.1.4.1. Company Overview
- 13.1.4.2. Products
- 13.1.4.3. Company Financials
- 13.1.4.4. SWOT Analysis
- 13.1.5 3M Company
- 13.1.5.1. Company Overview
- 13.1.5.2. Products
- 13.1.5.3. Company Financials
- 13.1.5.4. SWOT Analysis
- 13.1.6 CCL Industries Inc
- 13.1.6.1. Company Overview
- 13.1.6.2. Products
- 13.1.6.3. Company Financials
- 13.1.6.4. SWOT Analysis
- 13.1.7 Avery Dennison Corporation
- 13.1.7.1. Company Overview
- 13.1.7.2. Products
- 13.1.7.3. Company Financials
- 13.1.7.4. SWOT Analysis
- 13.1.8 Applied Dna Sciences Inc
- 13.1.8.1. Company Overview
- 13.1.8.2. Products
- 13.1.8.3. Company Financials
- 13.1.8.4. SWOT Analysis
- 13.1.9 Authentix Inc
- 13.1.9.1. Company Overview
- 13.1.9.2. Products
- 13.1.9.3. Company Financials
- 13.1.9.4. SWOT Analysis
- 13.1.10 Zebra Technologies Corporation
- 13.1.10.1. Company Overview
- 13.1.10.2. Products
- 13.1.10.3. Company Financials
- 13.1.10.4. SWOT Analysis
- 13.1.11 E I Du Pont De Nemours and Company
- 13.1.11.1. Company Overview
- 13.1.11.2. Products
- 13.1.11.3. Company Financials
- 13.1.11.4. SWOT Analysis
- 13.1.12 Ampacet Corporation
- 13.1.12.1. Company Overview
- 13.1.12.2. Products
- 13.1.12.3. Company Financials
- 13.1.12.4. SWOT Analysis
- 13.1.1 PharmaSecure Inc *List Not Exhaustive
- 13.2. Market Entropy
- 13.2.1 Company's Key Areas Served
- 13.2.2 Recent Developments
- 13.3. Company Market Share Analysis 2025
- 13.3.1 Top 5 Companies Market Share Analysis
- 13.3.2 Top 3 Companies Market Share Analysis
- 13.4. List of Potential Customers
- 14. Research Methodology
List of Figures
- Figure 1: Global Anti Counterfeit Measures in Packaging Industry Revenue Breakdown (billion, %) by Region 2025 & 2033
- Figure 2: North America Anti Counterfeit Measures in Packaging Industry Revenue (billion), by Technology 2025 & 2033
- Figure 3: North America Anti Counterfeit Measures in Packaging Industry Revenue Share (%), by Technology 2025 & 2033
- Figure 4: North America Anti Counterfeit Measures in Packaging Industry Revenue (billion), by End User 2025 & 2033
- Figure 5: North America Anti Counterfeit Measures in Packaging Industry Revenue Share (%), by End User 2025 & 2033
- Figure 6: North America Anti Counterfeit Measures in Packaging Industry Revenue (billion), by Country 2025 & 2033
- Figure 7: North America Anti Counterfeit Measures in Packaging Industry Revenue Share (%), by Country 2025 & 2033
- Figure 8: Europe Anti Counterfeit Measures in Packaging Industry Revenue (billion), by Technology 2025 & 2033
- Figure 9: Europe Anti Counterfeit Measures in Packaging Industry Revenue Share (%), by Technology 2025 & 2033
- Figure 10: Europe Anti Counterfeit Measures in Packaging Industry Revenue (billion), by End User 2025 & 2033
- Figure 11: Europe Anti Counterfeit Measures in Packaging Industry Revenue Share (%), by End User 2025 & 2033
- Figure 12: Europe Anti Counterfeit Measures in Packaging Industry Revenue (billion), by Country 2025 & 2033
- Figure 13: Europe Anti Counterfeit Measures in Packaging Industry Revenue Share (%), by Country 2025 & 2033
- Figure 14: Asia Pacific Anti Counterfeit Measures in Packaging Industry Revenue (billion), by Technology 2025 & 2033
- Figure 15: Asia Pacific Anti Counterfeit Measures in Packaging Industry Revenue Share (%), by Technology 2025 & 2033
- Figure 16: Asia Pacific Anti Counterfeit Measures in Packaging Industry Revenue (billion), by End User 2025 & 2033
- Figure 17: Asia Pacific Anti Counterfeit Measures in Packaging Industry Revenue Share (%), by End User 2025 & 2033
- Figure 18: Asia Pacific Anti Counterfeit Measures in Packaging Industry Revenue (billion), by Country 2025 & 2033
- Figure 19: Asia Pacific Anti Counterfeit Measures in Packaging Industry Revenue Share (%), by Country 2025 & 2033
- Figure 20: Latin America Anti Counterfeit Measures in Packaging Industry Revenue (billion), by Technology 2025 & 2033
- Figure 21: Latin America Anti Counterfeit Measures in Packaging Industry Revenue Share (%), by Technology 2025 & 2033
- Figure 22: Latin America Anti Counterfeit Measures in Packaging Industry Revenue (billion), by End User 2025 & 2033
- Figure 23: Latin America Anti Counterfeit Measures in Packaging Industry Revenue Share (%), by End User 2025 & 2033
- Figure 24: Latin America Anti Counterfeit Measures in Packaging Industry Revenue (billion), by Country 2025 & 2033
- Figure 25: Latin America Anti Counterfeit Measures in Packaging Industry Revenue Share (%), by Country 2025 & 2033
- Figure 26: Middle East Anti Counterfeit Measures in Packaging Industry Revenue (billion), by Technology 2025 & 2033
- Figure 27: Middle East Anti Counterfeit Measures in Packaging Industry Revenue Share (%), by Technology 2025 & 2033
- Figure 28: Middle East Anti Counterfeit Measures in Packaging Industry Revenue (billion), by End User 2025 & 2033
- Figure 29: Middle East Anti Counterfeit Measures in Packaging Industry Revenue Share (%), by End User 2025 & 2033
- Figure 30: Middle East Anti Counterfeit Measures in Packaging Industry Revenue (billion), by Country 2025 & 2033
- Figure 31: Middle East Anti Counterfeit Measures in Packaging Industry Revenue Share (%), by Country 2025 & 2033
- Figure 32: South Africa Anti Counterfeit Measures in Packaging Industry Revenue (billion), by Technology 2025 & 2033
- Figure 33: South Africa Anti Counterfeit Measures in Packaging Industry Revenue Share (%), by Technology 2025 & 2033
- Figure 34: South Africa Anti Counterfeit Measures in Packaging Industry Revenue (billion), by End User 2025 & 2033
- Figure 35: South Africa Anti Counterfeit Measures in Packaging Industry Revenue Share (%), by End User 2025 & 2033
- Figure 36: South Africa Anti Counterfeit Measures in Packaging Industry Revenue (billion), by Country 2025 & 2033
- Figure 37: South Africa Anti Counterfeit Measures in Packaging Industry Revenue Share (%), by Country 2025 & 2033
List of Tables
- Table 1: Global Anti Counterfeit Measures in Packaging Industry Revenue billion Forecast, by Technology 2020 & 2033
- Table 2: Global Anti Counterfeit Measures in Packaging Industry Revenue billion Forecast, by End User 2020 & 2033
- Table 3: Global Anti Counterfeit Measures in Packaging Industry Revenue billion Forecast, by Region 2020 & 2033
- Table 4: Global Anti Counterfeit Measures in Packaging Industry Revenue billion Forecast, by Technology 2020 & 2033
- Table 5: Global Anti Counterfeit Measures in Packaging Industry Revenue billion Forecast, by End User 2020 & 2033
- Table 6: Global Anti Counterfeit Measures in Packaging Industry Revenue billion Forecast, by Country 2020 & 2033
- Table 7: United States Anti Counterfeit Measures in Packaging Industry Revenue (billion) Forecast, by Application 2020 & 2033
- Table 8: Canada Anti Counterfeit Measures in Packaging Industry Revenue (billion) Forecast, by Application 2020 & 2033
- Table 9: Global Anti Counterfeit Measures in Packaging Industry Revenue billion Forecast, by Technology 2020 & 2033
- Table 10: Global Anti Counterfeit Measures in Packaging Industry Revenue billion Forecast, by End User 2020 & 2033
- Table 11: Global Anti Counterfeit Measures in Packaging Industry Revenue billion Forecast, by Country 2020 & 2033
- Table 12: United Kingdom Anti Counterfeit Measures in Packaging Industry Revenue (billion) Forecast, by Application 2020 & 2033
- Table 13: Germany Anti Counterfeit Measures in Packaging Industry Revenue (billion) Forecast, by Application 2020 & 2033
- Table 14: France Anti Counterfeit Measures in Packaging Industry Revenue (billion) Forecast, by Application 2020 & 2033
- Table 15: Italy Anti Counterfeit Measures in Packaging Industry Revenue (billion) Forecast, by Application 2020 & 2033
- Table 16: Spain Anti Counterfeit Measures in Packaging Industry Revenue (billion) Forecast, by Application 2020 & 2033
- Table 17: Rest of Europe Anti Counterfeit Measures in Packaging Industry Revenue (billion) Forecast, by Application 2020 & 2033
- Table 18: Global Anti Counterfeit Measures in Packaging Industry Revenue billion Forecast, by Technology 2020 & 2033
- Table 19: Global Anti Counterfeit Measures in Packaging Industry Revenue billion Forecast, by End User 2020 & 2033
- Table 20: Global Anti Counterfeit Measures in Packaging Industry Revenue billion Forecast, by Country 2020 & 2033
- Table 21: China Anti Counterfeit Measures in Packaging Industry Revenue (billion) Forecast, by Application 2020 & 2033
- Table 22: India Anti Counterfeit Measures in Packaging Industry Revenue (billion) Forecast, by Application 2020 & 2033
- Table 23: Japan Anti Counterfeit Measures in Packaging Industry Revenue (billion) Forecast, by Application 2020 & 2033
- Table 24: Australia Anti Counterfeit Measures in Packaging Industry Revenue (billion) Forecast, by Application 2020 & 2033
- Table 25: Rest of Asia Pacific Anti Counterfeit Measures in Packaging Industry Revenue (billion) Forecast, by Application 2020 & 2033
- Table 26: Global Anti Counterfeit Measures in Packaging Industry Revenue billion Forecast, by Technology 2020 & 2033
- Table 27: Global Anti Counterfeit Measures in Packaging Industry Revenue billion Forecast, by End User 2020 & 2033
- Table 28: Global Anti Counterfeit Measures in Packaging Industry Revenue billion Forecast, by Country 2020 & 2033
- Table 29: Brazil Anti Counterfeit Measures in Packaging Industry Revenue (billion) Forecast, by Application 2020 & 2033
- Table 30: Argentina Anti Counterfeit Measures in Packaging Industry Revenue (billion) Forecast, by Application 2020 & 2033
- Table 31: Rest of Latin America Anti Counterfeit Measures in Packaging Industry Revenue (billion) Forecast, by Application 2020 & 2033
- Table 32: Global Anti Counterfeit Measures in Packaging Industry Revenue billion Forecast, by Technology 2020 & 2033
- Table 33: Global Anti Counterfeit Measures in Packaging Industry Revenue billion Forecast, by End User 2020 & 2033
- Table 34: Global Anti Counterfeit Measures in Packaging Industry Revenue billion Forecast, by Country 2020 & 2033
- Table 35: Global Anti Counterfeit Measures in Packaging Industry Revenue billion Forecast, by Technology 2020 & 2033
- Table 36: Global Anti Counterfeit Measures in Packaging Industry Revenue billion Forecast, by End User 2020 & 2033
- Table 37: Global Anti Counterfeit Measures in Packaging Industry Revenue billion Forecast, by Country 2020 & 2033
- Table 38: United Arab Emirates Anti Counterfeit Measures in Packaging Industry Revenue (billion) Forecast, by Application 2020 & 2033
- Table 39: Rest of Middle East Anti Counterfeit Measures in Packaging Industry Revenue (billion) Forecast, by Application 2020 & 2033
Frequently Asked Questions
1. What is the projected Compound Annual Growth Rate (CAGR) of the Anti Counterfeit Measures in Packaging Industry?
The projected CAGR is approximately 9.4%.
2. Which companies are prominent players in the Anti Counterfeit Measures in Packaging Industry?
Key companies in the market include PharmaSecure Inc *List Not Exhaustive, AlpVision SA, Uflex Limited, Sicpa Holding SA, 3M Company, CCL Industries Inc, Avery Dennison Corporation, Applied Dna Sciences Inc, Authentix Inc, Zebra Technologies Corporation, E I Du Pont De Nemours and Company, Ampacet Corporation.
3. What are the main segments of the Anti Counterfeit Measures in Packaging Industry?
The market segments include Technology, End User.
4. Can you provide details about the market size?
The market size is estimated to be USD 204.08 billion as of 2022.
5. What are some drivers contributing to market growth?
Booming E-commerce Industry; Increasing Focus of Manufacturers on Brand Protection.
6. What are the notable trends driving market growth?
Pharmaceuticals and Healthcare to Drive the Market Demand.
7. Are there any restraints impacting market growth?
High-initial Costs.
8. Can you provide examples of recent developments in the market?
In August 2021, - Avery Dennison Corporation acquired Vestcom for an investment of USD 1.45 billion. The acquisition will help the company expand its branded labeling offerings for retail and consumer packaged goods industries.
9. What pricing options are available for accessing the report?
Pricing options include single-user, multi-user, and enterprise licenses priced at USD 4750, USD 5250, and USD 8750 respectively.
10. Is the market size provided in terms of value or volume?
The market size is provided in terms of value, measured in billion.
11. Are there any specific market keywords associated with the report?
Yes, the market keyword associated with the report is "Anti Counterfeit Measures in Packaging Industry," which aids in identifying and referencing the specific market segment covered.
12. How do I determine which pricing option suits my needs best?
The pricing options vary based on user requirements and access needs. Individual users may opt for single-user licenses, while businesses requiring broader access may choose multi-user or enterprise licenses for cost-effective access to the report.
13. Are there any additional resources or data provided in the Anti Counterfeit Measures in Packaging Industry report?
While the report offers comprehensive insights, it's advisable to review the specific contents or supplementary materials provided to ascertain if additional resources or data are available.
14. How can I stay updated on further developments or reports in the Anti Counterfeit Measures in Packaging Industry?
To stay informed about further developments, trends, and reports in the Anti Counterfeit Measures in Packaging Industry, consider subscribing to industry newsletters, following relevant companies and organizations, or regularly checking reputable industry news sources and publications.
Methodology
Step 1 - Identification of Relevant Samples Size from Population Database


Step 2 - Approaches for Defining Global Market Size (Value, Volume* & Price*)

Note*: In applicable scenarios
Step 3 - Data Sources
Primary Research
- Web Analytics
- Survey Reports
- Research Institute
- Latest Research Reports
- Opinion Leaders
Secondary Research
- Annual Reports
- White Paper
- Latest Press Release
- Industry Association
- Paid Database
- Investor Presentations

Step 4 - Data Triangulation
Involves using different sources of information in order to increase the validity of a study
These sources are likely to be stakeholders in a program - participants, other researchers, program staff, other community members, and so on.
Then we put all data in single framework & apply various statistical tools to find out the dynamic on the market.
During the analysis stage, feedback from the stakeholder groups would be compared to determine areas of agreement as well as areas of divergence