

Key Insights
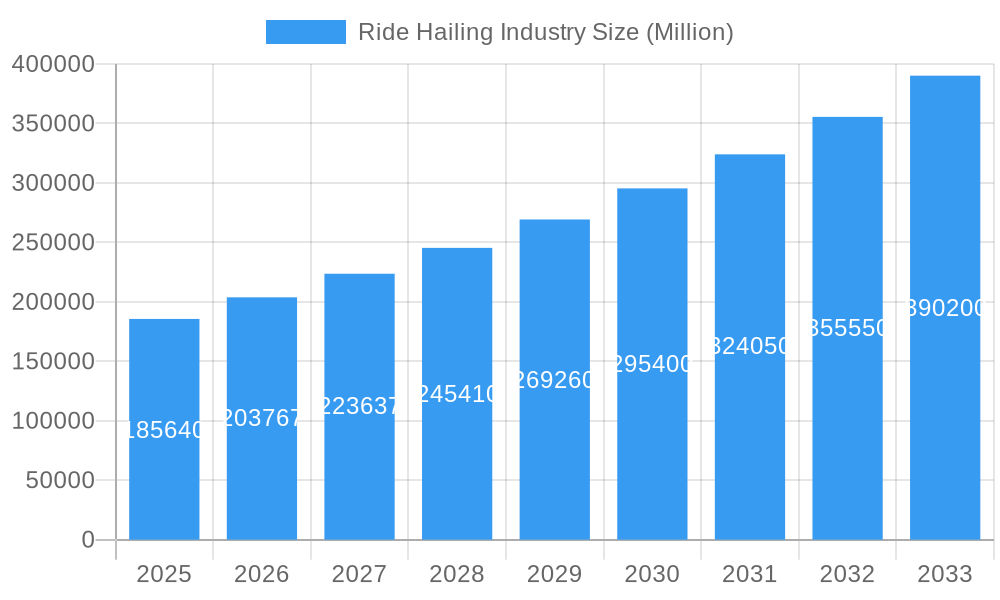
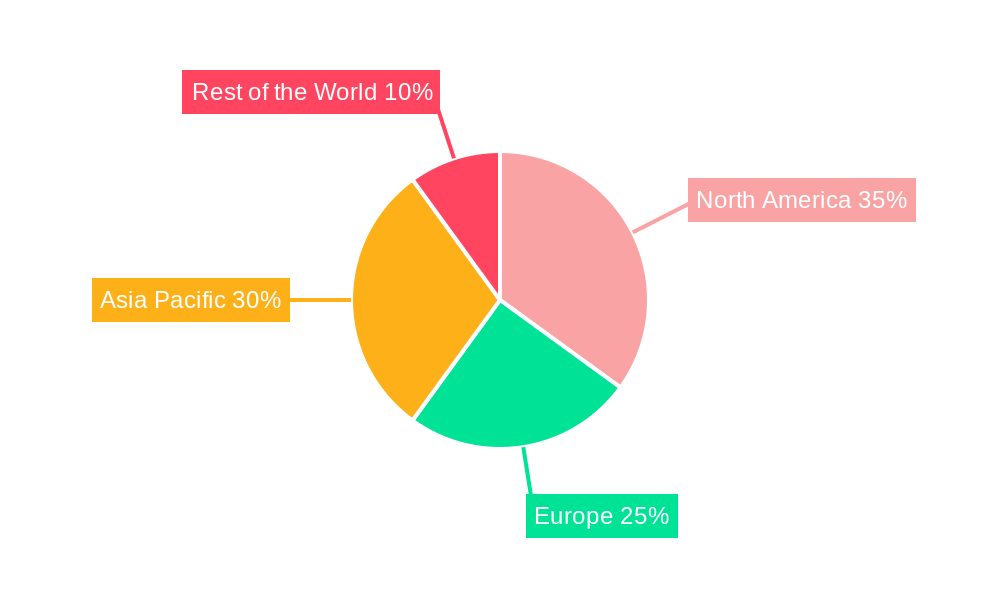
The ride-hailing market, valued at $185.64 billion in 2025, is projected to experience robust growth, driven by increasing smartphone penetration, urbanization, and the rising preference for convenient and affordable transportation options. The Compound Annual Growth Rate (CAGR) of 9.64% from 2025 to 2033 indicates a significant expansion of this market, with an expected market size exceeding $400 billion by 2033. Key drivers include the increasing adoption of ride-sharing apps, particularly among younger demographics, coupled with the expansion of services into new geographical areas and the integration of advanced technologies like AI-powered route optimization and automated dispatch systems. The rise of electric vehicles within the ride-hailing sector is also a major factor contributing to growth, driven by environmental concerns and government incentives promoting sustainable transportation. However, challenges such as stringent regulations, fluctuating fuel prices (especially impacting ICE vehicles), intense competition among established players and new entrants, and concerns regarding driver compensation and working conditions could potentially temper growth in certain regions. The market segmentation, split across vehicle types (motorcycles, cars, vans, buses) and propulsion types (ICE, electric), reflects varying market penetration and growth trajectories. The geographic distribution of the market, with strong presence in North America and Asia Pacific, shows regional variations in market maturity and growth potential.
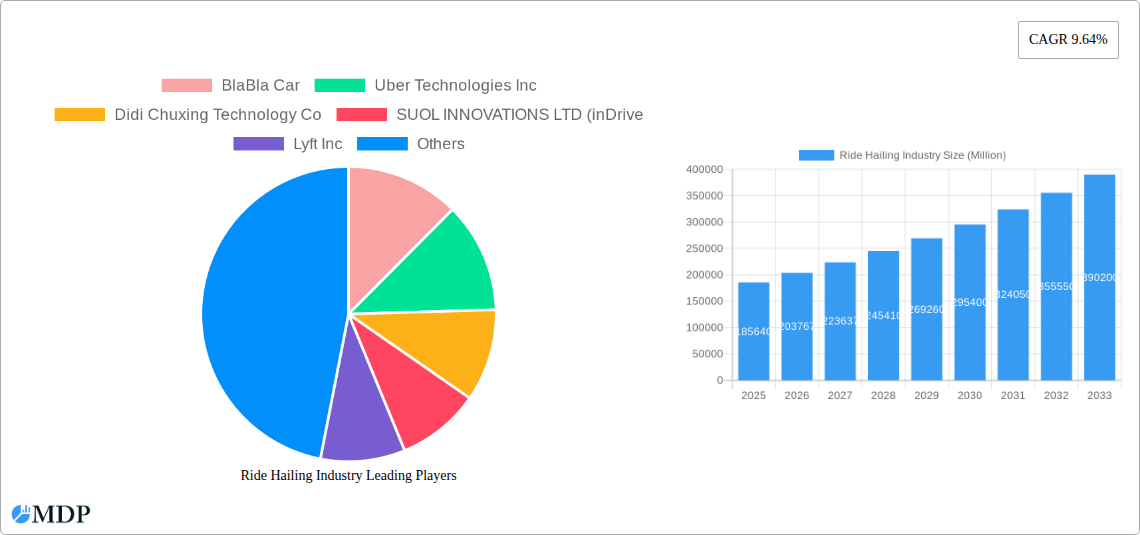
Ride Hailing Industry Market Size (In Billion)
The competitive landscape is highly fragmented, with major players like Uber, Didi Chuxing, Ola, and Grab vying for market share. These companies are continuously investing in technological advancements and strategic partnerships to maintain their competitive edge. Future growth will depend heavily on strategic expansion into underserved markets, innovative service offerings (e.g., ride-pooling, subscription services), and effective management of operational efficiency and regulatory compliance. The increasing integration of autonomous driving technology holds significant potential to reshape the market in the long term, though widespread adoption faces technical and regulatory hurdles. Consequently, the ride-hailing industry's future trajectory hinges on a dynamic interplay between technological innovation, regulatory frameworks, and consumer demand for safe, efficient, and sustainable transportation.
Ride Hailing Industry Company Market Share
Ride-Hailing Industry Market Report: 2019-2033
Uncover the Billion-Dollar Opportunities in the Global Ride-Hailing Market: A Comprehensive Analysis from 2019 to 2033.
This in-depth report provides a comprehensive analysis of the global ride-hailing industry, offering invaluable insights for stakeholders, investors, and industry professionals. With a focus on market dynamics, technological advancements, and competitive landscapes, this report projects a market size exceeding $XX Million by 2033, presenting a detailed overview covering the period 2019-2033, with 2025 as the base and estimated year. The report incorporates data from the historical period (2019-2024) and forecasts for 2025-2033.
Ride Hailing Industry Market Dynamics & Concentration
This section analyzes the competitive landscape, growth drivers, and regulatory influences shaping the ride-hailing market. The industry is characterized by high competition among key players, with market share constantly fluctuating due to technological innovations and strategic partnerships. Market concentration is moderate, with a few dominant players holding significant shares, but numerous smaller regional players contributing to the overall market size.
- Market Share: Uber Technologies Inc. maintains a leading market share, followed by Didi Chuxing Technology Co and Grab Holdings Inc. The remaining share is distributed among numerous regional and niche players.
- M&A Activity: The ride-hailing industry has witnessed significant M&A activity, with deal counts increasing in recent years due to consolidation and expansion strategies. (XX Million in deals in the last 5 years).
- Innovation Drivers: Technological advancements in autonomous driving, electric vehicles, and mobile application development are key drivers, constantly pushing the boundaries of service offerings.
- Regulatory Frameworks: Varying regulatory landscapes across different regions create both opportunities and challenges for ride-hailing companies. Compliance costs and differing licensing requirements significantly impact market dynamics.
- Product Substitutes: Public transportation, personal vehicle ownership, and bike-sharing services act as significant substitutes.
- End-User Trends: Increasing urbanization, growing demand for convenient transportation, and evolving consumer preferences towards on-demand services are key market drivers.
Ride Hailing Industry Industry Trends & Analysis
The global ride-hailing market exhibits robust growth driven by several factors. The industry's Compound Annual Growth Rate (CAGR) for the forecast period (2025-2033) is estimated at XX%. Market penetration is high in urban areas of developed countries but has significant untapped potential in emerging markets.
Technological disruptions, such as the introduction of autonomous vehicles and the expansion of electric vehicle fleets, are significantly reshaping the market landscape. Consumer preferences are shifting towards enhanced safety features, environmentally friendly options, and integrated payment systems. Competitive dynamics are characterized by intense rivalry, strategic alliances, and geographic expansion.
Leading Markets & Segments in Ride Hailing Industry
Dominant Regions & Segments: Asia accounts for the largest market share, driven by high population density and increasing smartphone penetration. Within vehicle types, cars dominate, followed by motorcycles. The ICE (Internal Combustion Engine) segment currently holds the largest share of the propulsion type market but the electric segment is experiencing rapid growth.
- Key Drivers:
- Asia: High population density, rapid urbanization, and growing middle class.
- Cars: Convenience, versatility, and ability to accommodate multiple passengers.
- ICE: Established infrastructure and lower initial vehicle costs compared to electric vehicles.
The dominance of these segments is further amplified by supportive government policies, expanding infrastructure, and consumer preferences for cost-effective and accessible transportation solutions.
Ride Hailing Industry Product Developments
Recent product developments focus on enhancing user experience, safety, and sustainability. The integration of advanced features such as in-app payment systems, ride-sharing options, and real-time tracking has become standard. Technological trends towards autonomous driving and the proliferation of electric vehicles are driving innovation within the industry, aiming for improved efficiency and reduced environmental impact. The market is witnessing a shift towards offering personalized services and premium options to cater to diverse customer needs.
Key Drivers of Ride Hailing Industry Growth
Several factors drive the ride-hailing industry's growth:
- Technological advancements: Autonomous vehicles, improved mobile applications, and electric vehicle integration.
- Economic factors: Rising disposable incomes, increased urbanization, and a preference for convenient transportation.
- Regulatory changes: The increasing acceptance and regulation of ride-hailing services in various countries. The example of Japan's recent adoption highlights the significant impact of regulatory changes on market expansion.
Challenges in the Ride Hailing Industry Market
The industry faces several challenges:
- Regulatory hurdles: Varying regulations across countries and regions, impacting operational costs and market access.
- Supply chain issues: Dependence on a stable supply of vehicles and drivers.
- Competitive pressures: Intense rivalry amongst major players and emerging competitors. The market's intensity results in reduced profit margins in the short term, but creates space for innovation and consolidation.
Emerging Opportunities in Ride Hailing Industry
Emerging opportunities are presented by:
- Technological breakthroughs: Autonomous vehicles, drone delivery services, and the integration of artificial intelligence.
- Strategic partnerships: Collaborations between ride-hailing companies and other businesses, such as the partnership between Didi Chuxing and TH International Limited.
- Market expansion: Growth in emerging markets with significant untapped potential.
Leading Players in the Ride Hailing Industry Sector
Key Milestones in Ride Hailing Industry Industry
- December 2023: TH International Limited partners with Didi Chuxing for a brand-building campaign. This highlights the potential for strategic partnerships in driving brand awareness and market penetration.
- March 2024: Waymo launches its free ride-hailing service, Waymo One, in Los Angeles. This signifies the growing importance of autonomous driving technology and its potential impact on the ride-hailing landscape.
- April 2024: Japan implements the use of private ride-hailing services via mobile apps, opening up a new market for global players like Uber and Gojek. This exemplifies the significant impact of regulatory changes on market expansion.
Strategic Outlook for Ride Hailing Industry Market
The ride-hailing industry's future is promising, driven by continuous technological advancements, evolving consumer preferences, and market expansion in developing economies. Strategic opportunities exist in the development of autonomous vehicle fleets, the expansion into underserved markets, and the creation of innovative service offerings that cater to specific customer needs. The market will likely witness increased consolidation, strategic partnerships, and a growing focus on sustainability and efficient operations.
Ride Hailing Industry Segmentation
-
1. Vehicle Type
- 1.1. Motorcycles
- 1.2. Cars
- 1.3. Vans
- 1.4. Buses
-
2. Propulsion Type
- 2.1. Internal Combustion Engine (ICE)
- 2.2. Electric
Ride Hailing Industry Segmentation By Geography
-
1. North America
- 1.1. United States
- 1.2. Canada
- 1.3. Rest of North America
-
2. Europe
- 2.1. Germany
- 2.2. United Kingdom
- 2.3. France
- 2.4. Italy
- 2.5. Rest of Europe
-
3. Asia Pacific
- 3.1. China
- 3.2. India
- 3.3. Japan
- 3.4. South Korea
- 3.5. Rest of Asia Pacific
-
4. Rest of the World
- 4.1. South America
- 4.2. Middle East and Africa
Ride Hailing Industry Regional Market Share
Geographic Coverage of Ride Hailing Industry
Ride Hailing Industry REPORT HIGHLIGHTS
| Aspects | Details |
|---|---|
| Study Period | 2020-2034 |
| Base Year | 2025 |
| Estimated Year | 2026 |
| Forecast Period | 2026-2034 |
| Historical Period | 2020-2025 |
| Growth Rate | CAGR of 9.64% from 2020-2034 |
| Segmentation |
|
Table of Contents
- 1. Introduction
- 1.1. Research Scope
- 1.2. Market Segmentation
- 1.3. Research Objective
- 1.4. Definitions and Assumptions
- 2. Executive Summary
- 2.1. Market Snapshot
- 3. Market Dynamics
- 3.1. Market Drivers
- 3.2. Market Restrains
- 3.3. Market Trends
- 3.4. Market Opportunities
- 4. Market Factor Analysis
- 4.1. Porters Five Forces
- 4.1.1. Bargaining Power of Suppliers
- 4.1.2. Bargaining Power of Buyers
- 4.1.3. Threat of New Entrants
- 4.1.4. Threat of Substitutes
- 4.1.5. Competitive Rivalry
- 4.2. PESTEL analysis
- 4.3. BCG Analysis
- 4.3.1. Stars (High Growth, High Market Share)
- 4.3.2. Cash Cows (Low Growth, High Market Share)
- 4.3.3. Question Mark (High Growth, Low Market Share)
- 4.3.4. Dogs (Low Growth, Low Market Share)
- 4.4. Ansoff Matrix Analysis
- 4.5. Supply Chain Analysis
- 4.6. Regulatory Landscape
- 4.7. Current Market Potential and Opportunity Assessment (TAM–SAM–SOM Framework)
- 4.8. MDP Analyst Note
- 4.1. Porters Five Forces
- 5. Market Analysis, Insights and Forecast 2021-2033
- 5.1. Market Analysis, Insights and Forecast - by Vehicle Type
- 5.1.1. Motorcycles
- 5.1.2. Cars
- 5.1.3. Vans
- 5.1.4. Buses
- 5.2. Market Analysis, Insights and Forecast - by Propulsion Type
- 5.2.1. Internal Combustion Engine (ICE)
- 5.2.2. Electric
- 5.3. Market Analysis, Insights and Forecast - by Region
- 5.3.1. North America
- 5.3.2. Europe
- 5.3.3. Asia Pacific
- 5.3.4. Rest of the World
- 5.1. Market Analysis, Insights and Forecast - by Vehicle Type
- 6. Global Ride Hailing Industry Analysis, Insights and Forecast, 2021-2033
- 6.1. Market Analysis, Insights and Forecast - by Vehicle Type
- 6.1.1. Motorcycles
- 6.1.2. Cars
- 6.1.3. Vans
- 6.1.4. Buses
- 6.2. Market Analysis, Insights and Forecast - by Propulsion Type
- 6.2.1. Internal Combustion Engine (ICE)
- 6.2.2. Electric
- 6.1. Market Analysis, Insights and Forecast - by Vehicle Type
- 7. North America Ride Hailing Industry Analysis, Insights and Forecast, 2020-2032
- 7.1. Market Analysis, Insights and Forecast - by Vehicle Type
- 7.1.1. Motorcycles
- 7.1.2. Cars
- 7.1.3. Vans
- 7.1.4. Buses
- 7.2. Market Analysis, Insights and Forecast - by Propulsion Type
- 7.2.1. Internal Combustion Engine (ICE)
- 7.2.2. Electric
- 7.1. Market Analysis, Insights and Forecast - by Vehicle Type
- 8. Europe Ride Hailing Industry Analysis, Insights and Forecast, 2020-2032
- 8.1. Market Analysis, Insights and Forecast - by Vehicle Type
- 8.1.1. Motorcycles
- 8.1.2. Cars
- 8.1.3. Vans
- 8.1.4. Buses
- 8.2. Market Analysis, Insights and Forecast - by Propulsion Type
- 8.2.1. Internal Combustion Engine (ICE)
- 8.2.2. Electric
- 8.1. Market Analysis, Insights and Forecast - by Vehicle Type
- 9. Asia Pacific Ride Hailing Industry Analysis, Insights and Forecast, 2020-2032
- 9.1. Market Analysis, Insights and Forecast - by Vehicle Type
- 9.1.1. Motorcycles
- 9.1.2. Cars
- 9.1.3. Vans
- 9.1.4. Buses
- 9.2. Market Analysis, Insights and Forecast - by Propulsion Type
- 9.2.1. Internal Combustion Engine (ICE)
- 9.2.2. Electric
- 9.1. Market Analysis, Insights and Forecast - by Vehicle Type
- 10. Rest of the World Ride Hailing Industry Analysis, Insights and Forecast, 2020-2032
- 10.1. Market Analysis, Insights and Forecast - by Vehicle Type
- 10.1.1. Motorcycles
- 10.1.2. Cars
- 10.1.3. Vans
- 10.1.4. Buses
- 10.2. Market Analysis, Insights and Forecast - by Propulsion Type
- 10.2.1. Internal Combustion Engine (ICE)
- 10.2.2. Electric
- 10.1. Market Analysis, Insights and Forecast - by Vehicle Type
- 11. Competitive Analysis
- 11.1. Company Profiles
- 11.1.1 BlaBla Car
- 11.1.1.1. Company Overview
- 11.1.1.2. Products
- 11.1.1.3. Company Financials
- 11.1.1.4. SWOT Analysis
- 11.1.2 Uber Technologies Inc
- 11.1.2.1. Company Overview
- 11.1.2.2. Products
- 11.1.2.3. Company Financials
- 11.1.2.4. SWOT Analysis
- 11.1.3 Didi Chuxing Technology Co
- 11.1.3.1. Company Overview
- 11.1.3.2. Products
- 11.1.3.3. Company Financials
- 11.1.3.4. SWOT Analysis
- 11.1.4 SUOL INNOVATIONS LTD (inDrive
- 11.1.4.1. Company Overview
- 11.1.4.2. Products
- 11.1.4.3. Company Financials
- 11.1.4.4. SWOT Analysis
- 11.1.5 Lyft Inc
- 11.1.5.1. Company Overview
- 11.1.5.2. Products
- 11.1.5.3. Company Financials
- 11.1.5.4. SWOT Analysis
- 11.1.6 Ani Technologies Pvt Ltd (OLA)
- 11.1.6.1. Company Overview
- 11.1.6.2. Products
- 11.1.6.3. Company Financials
- 11.1.6.4. SWOT Analysis
- 11.1.7 Gett Group
- 11.1.7.1. Company Overview
- 11.1.7.2. Products
- 11.1.7.3. Company Financials
- 11.1.7.4. SWOT Analysis
- 11.1.8 Bolt Technology OU
- 11.1.8.1. Company Overview
- 11.1.8.2. Products
- 11.1.8.3. Company Financials
- 11.1.8.4. SWOT Analysis
- 11.1.9 Maxi Mobility SL (Cabify)
- 11.1.9.1. Company Overview
- 11.1.9.2. Products
- 11.1.9.3. Company Financials
- 11.1.9.4. SWOT Analysis
- 11.1.10 GoTo Group (GoJek)
- 11.1.10.1. Company Overview
- 11.1.10.2. Products
- 11.1.10.3. Company Financials
- 11.1.10.4. SWOT Analysis
- 11.1.11 Xanh SM (GSM)
- 11.1.11.1. Company Overview
- 11.1.11.2. Products
- 11.1.11.3. Company Financials
- 11.1.11.4. SWOT Analysis
- 11.1.12 Grab Holdings Inc
- 11.1.12.1. Company Overview
- 11.1.12.2. Products
- 11.1.12.3. Company Financials
- 11.1.12.4. SWOT Analysis
- 11.1.1 BlaBla Car
- 11.2. Market Entropy
- 11.2.1 Company's Key Areas Served
- 11.2.2 Recent Developments
- 11.3. Company Market Share Analysis 2025
- 11.3.1 Top 5 Companies Market Share Analysis
- 11.3.2 Top 3 Companies Market Share Analysis
- 11.4. List of Potential Customers
- 12. Research Methodology
List of Figures
- Figure 1: Global Ride Hailing Industry Revenue Breakdown (Million, %) by Region 2025 & 2033
- Figure 2: North America Ride Hailing Industry Revenue (Million), by Vehicle Type 2025 & 2033
- Figure 3: North America Ride Hailing Industry Revenue Share (%), by Vehicle Type 2025 & 2033
- Figure 4: North America Ride Hailing Industry Revenue (Million), by Propulsion Type 2025 & 2033
- Figure 5: North America Ride Hailing Industry Revenue Share (%), by Propulsion Type 2025 & 2033
- Figure 6: North America Ride Hailing Industry Revenue (Million), by Country 2025 & 2033
- Figure 7: North America Ride Hailing Industry Revenue Share (%), by Country 2025 & 2033
- Figure 8: Europe Ride Hailing Industry Revenue (Million), by Vehicle Type 2025 & 2033
- Figure 9: Europe Ride Hailing Industry Revenue Share (%), by Vehicle Type 2025 & 2033
- Figure 10: Europe Ride Hailing Industry Revenue (Million), by Propulsion Type 2025 & 2033
- Figure 11: Europe Ride Hailing Industry Revenue Share (%), by Propulsion Type 2025 & 2033
- Figure 12: Europe Ride Hailing Industry Revenue (Million), by Country 2025 & 2033
- Figure 13: Europe Ride Hailing Industry Revenue Share (%), by Country 2025 & 2033
- Figure 14: Asia Pacific Ride Hailing Industry Revenue (Million), by Vehicle Type 2025 & 2033
- Figure 15: Asia Pacific Ride Hailing Industry Revenue Share (%), by Vehicle Type 2025 & 2033
- Figure 16: Asia Pacific Ride Hailing Industry Revenue (Million), by Propulsion Type 2025 & 2033
- Figure 17: Asia Pacific Ride Hailing Industry Revenue Share (%), by Propulsion Type 2025 & 2033
- Figure 18: Asia Pacific Ride Hailing Industry Revenue (Million), by Country 2025 & 2033
- Figure 19: Asia Pacific Ride Hailing Industry Revenue Share (%), by Country 2025 & 2033
- Figure 20: Rest of the World Ride Hailing Industry Revenue (Million), by Vehicle Type 2025 & 2033
- Figure 21: Rest of the World Ride Hailing Industry Revenue Share (%), by Vehicle Type 2025 & 2033
- Figure 22: Rest of the World Ride Hailing Industry Revenue (Million), by Propulsion Type 2025 & 2033
- Figure 23: Rest of the World Ride Hailing Industry Revenue Share (%), by Propulsion Type 2025 & 2033
- Figure 24: Rest of the World Ride Hailing Industry Revenue (Million), by Country 2025 & 2033
- Figure 25: Rest of the World Ride Hailing Industry Revenue Share (%), by Country 2025 & 2033
List of Tables
- Table 1: Global Ride Hailing Industry Revenue Million Forecast, by Vehicle Type 2020 & 2033
- Table 2: Global Ride Hailing Industry Revenue Million Forecast, by Propulsion Type 2020 & 2033
- Table 3: Global Ride Hailing Industry Revenue Million Forecast, by Region 2020 & 2033
- Table 4: Global Ride Hailing Industry Revenue Million Forecast, by Vehicle Type 2020 & 2033
- Table 5: Global Ride Hailing Industry Revenue Million Forecast, by Propulsion Type 2020 & 2033
- Table 6: Global Ride Hailing Industry Revenue Million Forecast, by Country 2020 & 2033
- Table 7: United States Ride Hailing Industry Revenue (Million) Forecast, by Application 2020 & 2033
- Table 8: Canada Ride Hailing Industry Revenue (Million) Forecast, by Application 2020 & 2033
- Table 9: Rest of North America Ride Hailing Industry Revenue (Million) Forecast, by Application 2020 & 2033
- Table 10: Global Ride Hailing Industry Revenue Million Forecast, by Vehicle Type 2020 & 2033
- Table 11: Global Ride Hailing Industry Revenue Million Forecast, by Propulsion Type 2020 & 2033
- Table 12: Global Ride Hailing Industry Revenue Million Forecast, by Country 2020 & 2033
- Table 13: Germany Ride Hailing Industry Revenue (Million) Forecast, by Application 2020 & 2033
- Table 14: United Kingdom Ride Hailing Industry Revenue (Million) Forecast, by Application 2020 & 2033
- Table 15: France Ride Hailing Industry Revenue (Million) Forecast, by Application 2020 & 2033
- Table 16: Italy Ride Hailing Industry Revenue (Million) Forecast, by Application 2020 & 2033
- Table 17: Rest of Europe Ride Hailing Industry Revenue (Million) Forecast, by Application 2020 & 2033
- Table 18: Global Ride Hailing Industry Revenue Million Forecast, by Vehicle Type 2020 & 2033
- Table 19: Global Ride Hailing Industry Revenue Million Forecast, by Propulsion Type 2020 & 2033
- Table 20: Global Ride Hailing Industry Revenue Million Forecast, by Country 2020 & 2033
- Table 21: China Ride Hailing Industry Revenue (Million) Forecast, by Application 2020 & 2033
- Table 22: India Ride Hailing Industry Revenue (Million) Forecast, by Application 2020 & 2033
- Table 23: Japan Ride Hailing Industry Revenue (Million) Forecast, by Application 2020 & 2033
- Table 24: South Korea Ride Hailing Industry Revenue (Million) Forecast, by Application 2020 & 2033
- Table 25: Rest of Asia Pacific Ride Hailing Industry Revenue (Million) Forecast, by Application 2020 & 2033
- Table 26: Global Ride Hailing Industry Revenue Million Forecast, by Vehicle Type 2020 & 2033
- Table 27: Global Ride Hailing Industry Revenue Million Forecast, by Propulsion Type 2020 & 2033
- Table 28: Global Ride Hailing Industry Revenue Million Forecast, by Country 2020 & 2033
- Table 29: South America Ride Hailing Industry Revenue (Million) Forecast, by Application 2020 & 2033
- Table 30: Middle East and Africa Ride Hailing Industry Revenue (Million) Forecast, by Application 2020 & 2033
Frequently Asked Questions
1. What is the projected Compound Annual Growth Rate (CAGR) of the Ride Hailing Industry?
The projected CAGR is approximately 9.64%.
2. Which companies are prominent players in the Ride Hailing Industry?
Key companies in the market include BlaBla Car, Uber Technologies Inc, Didi Chuxing Technology Co, SUOL INNOVATIONS LTD (inDrive, Lyft Inc, Ani Technologies Pvt Ltd (OLA), Gett Group, Bolt Technology OU, Maxi Mobility SL (Cabify), GoTo Group (GoJek), Xanh SM (GSM), Grab Holdings Inc.
3. What are the main segments of the Ride Hailing Industry?
The market segments include Vehicle Type, Propulsion Type.
4. Can you provide details about the market size?
The market size is estimated to be USD 185.64 Million as of 2022.
5. What are some drivers contributing to market growth?
Rising Traffic Congestion and Increasing Urban Population to Foster Market Growth.
6. What are the notable trends driving market growth?
The Cars Segment is Expected to Gain Traction During the Forecast Period.
7. Are there any restraints impacting market growth?
Strict Government Regulations and Policies Toward Ride-hailing Services Impact the Market Growth.
8. Can you provide examples of recent developments in the market?
April 2024: The Japanese government implemented the use of private ride-hailing services, which are accessible through mobile applications such as Uber and Go.
9. What pricing options are available for accessing the report?
Pricing options include single-user, multi-user, and enterprise licenses priced at USD 4750, USD 5250, and USD 8750 respectively.
10. Is the market size provided in terms of value or volume?
The market size is provided in terms of value, measured in Million.
11. Are there any specific market keywords associated with the report?
Yes, the market keyword associated with the report is "Ride Hailing Industry," which aids in identifying and referencing the specific market segment covered.
12. How do I determine which pricing option suits my needs best?
The pricing options vary based on user requirements and access needs. Individual users may opt for single-user licenses, while businesses requiring broader access may choose multi-user or enterprise licenses for cost-effective access to the report.
13. Are there any additional resources or data provided in the Ride Hailing Industry report?
While the report offers comprehensive insights, it's advisable to review the specific contents or supplementary materials provided to ascertain if additional resources or data are available.
14. How can I stay updated on further developments or reports in the Ride Hailing Industry?
To stay informed about further developments, trends, and reports in the Ride Hailing Industry, consider subscribing to industry newsletters, following relevant companies and organizations, or regularly checking reputable industry news sources and publications.
Methodology
Step 1 - Identification of Relevant Samples Size from Population Database


Step 2 - Approaches for Defining Global Market Size (Value, Volume* & Price*)

Note*: In applicable scenarios
Step 3 - Data Sources
Primary Research
- Web Analytics
- Survey Reports
- Research Institute
- Latest Research Reports
- Opinion Leaders
Secondary Research
- Annual Reports
- White Paper
- Latest Press Release
- Industry Association
- Paid Database
- Investor Presentations

Step 4 - Data Triangulation
Involves using different sources of information in order to increase the validity of a study
These sources are likely to be stakeholders in a program - participants, other researchers, program staff, other community members, and so on.
Then we put all data in single framework & apply various statistical tools to find out the dynamic on the market.
During the analysis stage, feedback from the stakeholder groups would be compared to determine areas of agreement as well as areas of divergence