

Key Insights
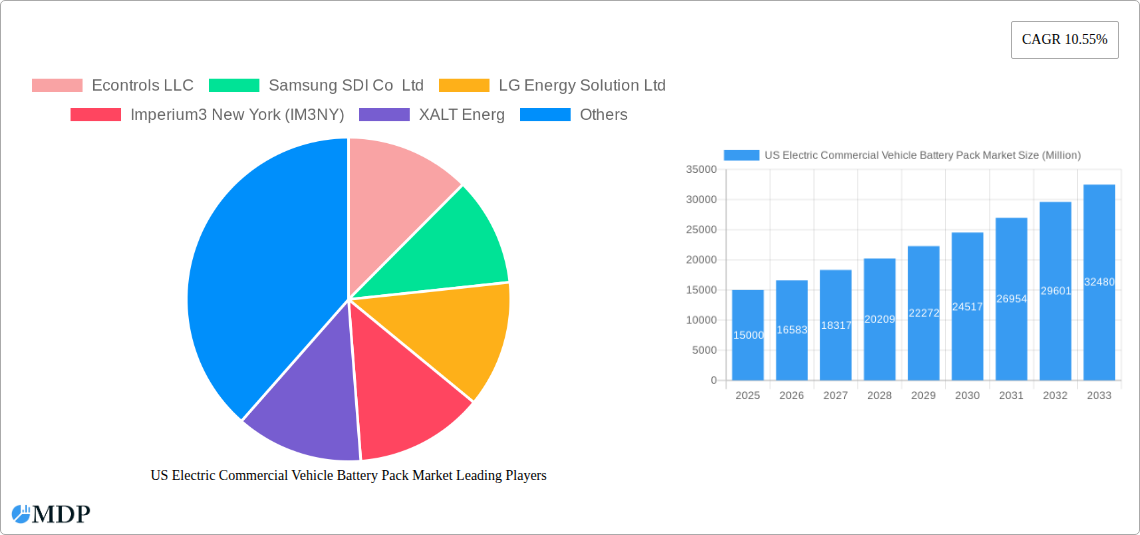
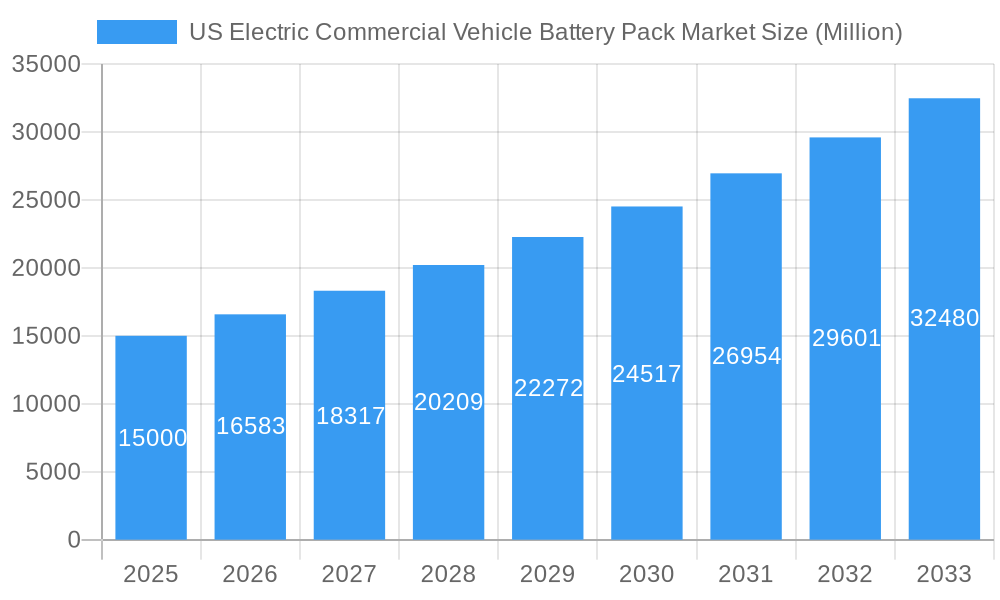
The US Electric Commercial Vehicle Battery Pack Market is poised for significant expansion, driven by an estimated market size of USD 15,000 million in 2025 and a projected Compound Annual Growth Rate (CAGR) of 10.55% through 2033. This robust growth is primarily fueled by escalating environmental regulations, government incentives for EV adoption, and the increasing demand for sustainable logistics solutions. The drive towards decarbonization across the commercial transport sector, encompassing buses, light commercial vehicles (LCVs), and medium and heavy-duty trucks (M&HDTs), is creating a substantial need for advanced battery pack technologies. Key industry players are investing heavily in research and development to enhance battery performance, range, and charging speed, while also focusing on cost reduction strategies to accelerate mainstream adoption. The increasing awareness among fleet operators regarding the total cost of ownership benefits, including lower fuel and maintenance expenses, further solidifies the market's upward trajectory.
US Electric Commercial Vehicle Battery Pack Market Market Size (In Billion)
The market segmentation reveals a dynamic landscape with distinct preferences for battery chemistries and capacities. Lithium Iron Phosphate (LFP) batteries are gaining traction due to their safety, longevity, and cost-effectiveness, particularly for LCVs and buses, while Nickel Cobalt Manganese (NCM) and Nickel Cobalt Aluminum (NCA) chemistries continue to be favored for M&HDTs demanding higher energy density. Battery capacities ranging from 40 kWh to 80 kWh are expected to dominate the market, catering to the diverse operational needs of commercial fleets. Furthermore, advancements in battery manufacturing methods, such as laser welding, and the ongoing development of anode, cathode, electrolyte, and separator components, are crucial for improving battery pack efficiency and reliability. The growing emphasis on ethical sourcing of raw materials like cobalt and lithium, and the exploration of alternative materials like natural graphite and nickel, are also shaping market strategies and investment decisions.
US Electric Commercial Vehicle Battery Pack Market Company Market Share
Unlocking the Future of Transportation: A Comprehensive Report on the US Electric Commercial Vehicle Battery Pack Market (2019–2033)
This in-depth report provides a definitive analysis of the US Electric Commercial Vehicle (ECV) Battery Pack Market, offering critical insights into its dynamics, trends, and future trajectory from 2019 to 2033, with a base year of 2025. We delve into the burgeoning demand for sustainable logistics solutions, the technological advancements driving battery performance, and the evolving regulatory landscape shaping the adoption of electric trucks, buses, and light commercial vehicles. This report is an indispensable resource for manufacturers, suppliers, investors, policymakers, and industry stakeholders seeking to capitalize on the significant growth opportunities within this transformative market.
US Electric Commercial Vehicle Battery Pack Market Market Dynamics & Concentration
The US Electric Commercial Vehicle Battery Pack Market is characterized by a dynamic blend of intense competition and strategic collaborations. Market concentration is moderately high, with key players like CATL, LG Energy Solution, and Samsung SDI holding significant market shares, particularly in the supply of advanced battery chemistries such as NCM and NCA. Innovation is a primary driver, fueled by relentless R&D in battery density, charging speed, and thermal management systems to meet the demanding operational requirements of commercial fleets. Regulatory frameworks, including federal and state incentives for EV adoption and stricter emissions standards, are powerfully influencing market growth. Product substitutes, while currently limited in performance for heavy-duty applications, are evolving, with advancements in hydrogen fuel cell technology presenting a long-term challenge. End-user trends indicate a strong preference for longer range, faster charging, and lower total cost of ownership, pushing manufacturers to develop more robust and cost-effective battery solutions. Merger and acquisition (M&A) activities are on the rise as companies seek to secure supply chains, acquire cutting-edge technologies, and expand their market reach. Notable M&A deals, such as strategic investments in battery recycling and raw material sourcing, underscore the industry's focus on sustainability and supply chain resilience. The market is poised for significant expansion, driven by fleet electrification initiatives and the growing recognition of the economic and environmental benefits of electric commercial vehicles.
US Electric Commercial Vehicle Battery Pack Market Industry Trends & Analysis
The US Electric Commercial Vehicle Battery Pack Market is experiencing a period of unprecedented growth and transformation, driven by a confluence of technological advancements, economic incentives, and a growing environmental consciousness. The market is projected to grow at a robust Compound Annual Growth Rate (CAGR) of approximately 25% during the forecast period of 2025–2033. This expansion is primarily fueled by the escalating demand for zero-emission transportation solutions across various commercial segments, including last-mile delivery, long-haul trucking, and public transportation. Technological disruptions are at the forefront of this evolution, with continuous improvements in battery chemistry, such as the increasing adoption of Lithium Iron Phosphate (LFP) for its cost-effectiveness and safety, and the ongoing refinement of Nickel-Cobalt-Manganese (NCM) and Nickel-Cobalt-Aluminum (NCA) for higher energy density. Innovations in battery pack design, thermal management, and charging infrastructure are crucial for addressing the operational challenges faced by commercial fleets, including range anxiety and charging times. Consumer preferences are rapidly shifting towards electric alternatives due to declining battery costs, government subsidies, and the allure of reduced operational expenditures. Fleet operators are increasingly recognizing the long-term economic advantages of electric vehicles, including lower fuel and maintenance costs, which contribute to a more favorable total cost of ownership. Competitive dynamics are intensifying, with established automotive manufacturers, dedicated EV startups, and battery technology giants vying for market dominance. Strategic partnerships between vehicle manufacturers and battery suppliers are becoming more prevalent to ensure a stable and advanced supply of battery packs. The market penetration of electric commercial vehicles, while still in its nascent stages for heavy-duty applications, is accelerating rapidly, driven by pilot programs, fleet electrification mandates, and the availability of a wider range of electric commercial vehicle models. The increasing focus on sustainability and corporate ESG (Environmental, Social, and Governance) goals further propels the adoption of ECVs, making the battery pack market a critical enabler of this transition.
Leading Markets & Segments in US Electric Commercial Vehicle Battery Pack Market
The US Electric Commercial Vehicle Battery Pack Market exhibits distinct leadership across various segments, driven by specific demand patterns and technological advancements.
Body Type Dominance:
- M&HDT (Medium & Heavy-Duty Trucks): This segment is emerging as a significant growth driver, fueled by the electrification of long-haul logistics and the increasing deployment of electric drayage trucks in ports. Government initiatives promoting zero-emission freight transport and the development of high-capacity battery packs are critical factors.
- Bus: The public transportation sector is a mature adopter of electric vehicles, with a strong focus on battery-electric buses (BEBs) for urban transit systems. Government mandates for clean air in cities and the lower operating costs of electric buses are key drivers.
- LCV (Light Commercial Vehicle): The burgeoning e-commerce and last-mile delivery sector is a major impetus for the growth of electric LCVs. The agility and efficiency of these vehicles for urban deliveries, coupled with advancements in battery technology, are accelerating their adoption.
Propulsion Type Leadership:
- BEV (Battery Electric Vehicle): This is the dominant propulsion type, representing the vast majority of electric commercial vehicle sales. The simplicity of the powertrain, coupled with zero tailpipe emissions, makes BEVs the preferred choice for fleet operators aiming for sustainability and compliance with emissions regulations.
Battery Chemistry Trends:
- NCM (Nickel-Cobalt-Manganese) & NMC (Nickel-Manganese-Cobalt): These chemistries continue to lead due to their high energy density, crucial for longer ranges required by medium and heavy-duty trucks. However, concerns regarding cobalt sourcing are driving research into alternatives.
- LFP (Lithium Iron Phosphate): LFP is gaining significant traction, especially in LCVs and urban buses, owing to its improved safety, longer cycle life, and lower cost. The absence of cobalt makes it an attractive option for manufacturers seeking to reduce costs and address ethical sourcing concerns.
- Others: Research into solid-state batteries and other advanced chemistries holds promise for future advancements in energy density and safety.
Capacity Segment Growth:
- Above 80 kWh: This capacity range is paramount for M&HDTs and long-range buses, enabling them to meet operational demands without frequent charging. The development of more efficient battery pack integration is key here.
- 40 kWh to 80 kWh: This segment caters to a wide range of LCVs and shorter-range buses, offering a balance between range, cost, and weight.
Battery Form Factor Preferences:
- Prismatic: This form factor is increasingly favored for its excellent volumetric energy density and ease of integration into vehicle chassis, particularly in larger commercial vehicles.
- Pouch: Pouch cells offer design flexibility and good thermal performance, making them suitable for various ECV applications, especially in LCVs.
Component and Material Focus:
- Cathode & Anode: These are critical components influencing battery performance and cost. Innovations in cathode materials like high-nickel NCM and advanced anode materials like silicon-graphite composites are driving energy density improvements.
- Lithium & Nickel: As primary raw materials, the secure and sustainable sourcing of lithium and nickel is a strategic imperative for the entire industry. Fluctuations in their prices directly impact battery pack costs.
Methodology in Manufacturing:
- Laser Welding: This advanced manufacturing technique is crucial for ensuring precise and reliable connections within battery packs, contributing to enhanced safety and performance, particularly in high-voltage applications.
US Electric Commercial Vehicle Battery Pack Market Product Developments
Product development in the US Electric Commercial Vehicle Battery Pack Market is focused on enhancing energy density, improving charge and discharge rates, increasing lifespan, and reducing costs. Innovations in battery chemistry, such as the wider adoption of LFP for its safety and cost benefits and advancements in NCM for higher energy density, are central. Companies are also developing integrated thermal management systems to optimize performance and longevity in demanding commercial use. Advanced battery management systems (BMS) are being refined to ensure precise monitoring and control, maximizing efficiency and safety. Furthermore, modular battery pack designs are emerging to offer greater flexibility and scalability for different vehicle types and capacities. The focus is on delivering solutions that provide a lower total cost of ownership for fleet operators, thereby accelerating the transition to electric mobility.
Key Drivers of US Electric Commercial Vehicle Battery Pack Market Growth
The growth of the US Electric Commercial Vehicle Battery Pack Market is propelled by a combination of powerful forces. Government initiatives, including federal tax credits, state-level mandates for zero-emission vehicles, and substantial investments in charging infrastructure, are creating a fertile ground for ECV adoption. Technological advancements in battery technology, such as higher energy density cells, faster charging capabilities, and improved thermal management, are directly addressing the operational needs of commercial fleets. The increasing demand for sustainable logistics solutions from corporations aiming to meet ESG targets is a significant market accelerator. Furthermore, the declining total cost of ownership for electric commercial vehicles, driven by lower fuel and maintenance expenses compared to their internal combustion engine counterparts, is a compelling economic driver.
Challenges in the US Electric Commercial Vehicle Battery Pack Market Market
Despite the robust growth, the US Electric Commercial Vehicle Battery Pack Market faces several significant challenges. High upfront costs of electric commercial vehicles, including the battery pack itself, remain a barrier for some fleet operators, despite ongoing cost reductions. The availability and accessibility of robust charging infrastructure, particularly for heavy-duty trucks and in remote areas, is a critical concern. Supply chain constraints for key raw materials like lithium, cobalt, and nickel, coupled with geopolitical factors, can lead to price volatility and production delays. The complexity of battery recycling and end-of-life management also presents an ongoing environmental and logistical challenge. Finally, the need for specialized technician training and maintenance infrastructure for electric fleets requires substantial investment and development.
Emerging Opportunities in US Electric Commercial Vehicle Battery Pack Market
The US Electric Commercial Vehicle Battery Pack Market is ripe with emerging opportunities driven by technological breakthroughs and strategic market expansion. The development of next-generation battery technologies, such as solid-state batteries, promises significant improvements in energy density, safety, and charging times, opening new avenues for performance enhancement. Strategic partnerships between battery manufacturers, vehicle OEMs, and charging infrastructure providers are crucial for building comprehensive ecosystem solutions. The growing demand for battery-as-a-service (BaaS) models, where battery performance is guaranteed and replaced as needed, offers an attractive alternative for fleet operators seeking to reduce upfront capital expenditure. Furthermore, the increasing focus on domestic battery production and supply chain localization, spurred by government incentives, presents significant opportunities for investment and growth within the US.
Leading Players in the US Electric Commercial Vehicle Battery Pack Market Sector
- Econtrols LLC
- Samsung SDI Co Ltd
- LG Energy Solution Ltd
- Imperium3 New York (IM3NY)
- XALT Energy
- Contemporary Amperex Technology Co Ltd (CATL)
- Tesla Inc
- Robert Bosch GmbH
- BYD Company Ltd
- SK Innovation Co Ltd
- Proterra Operating Company Inc
- Panasonic Holdings Corporation
- Envision AESC Japan Co Ltd
Key Milestones in US Electric Commercial Vehicle Battery Pack Market Industry
- February 2023: LG Energy Solution has been granted USD 237 million for the Honda battery plant project in Ohio, payable over the next 10 years, on top of approximately USD 156.3 million in tax incentives and infrastructure improvements.
- September 2022: LG Energy Solution has announced a partnership with three Canadian suppliers, Snow Lake Resources Ltd, Electra Battery Materials Corporation, and Avalon Advanced Materials Inc., to boost the supply chain for EV batteries in North America.
- August 2022: LG Energy Solutions and Honda Motor Co. announced a joint venture to produce electric vehicle batteries in the United States.
Strategic Outlook for US Electric Commercial Vehicle Battery Pack Market Market
The strategic outlook for the US Electric Commercial Vehicle Battery Pack Market is exceptionally positive, characterized by accelerating adoption and continuous innovation. Future growth will be driven by ongoing advancements in battery technology, leading to greater energy density, faster charging, and improved cost-effectiveness. The expansion of robust charging infrastructure, supported by public and private investments, will be critical in alleviating range anxiety and enabling widespread adoption across all commercial vehicle segments. Strategic collaborations between battery manufacturers and automotive OEMs will continue to play a pivotal role in developing tailored solutions for specific vehicle applications. Furthermore, the increasing emphasis on circular economy principles, including battery recycling and second-life applications, will present new business models and enhance the sustainability of the ECV ecosystem. The market is poised for sustained expansion as regulatory support strengthens and the economic and environmental benefits of electrification become increasingly apparent.
US Electric Commercial Vehicle Battery Pack Market Segmentation
-
1. Body Type
- 1.1. Bus
- 1.2. LCV
- 1.3. M&HDT
-
2. Propulsion Type
- 2.1. BEV
- 2.2. PHEV
-
3. Battery Chemistry
- 3.1. LFP
- 3.2. NCA
- 3.3. NCM
- 3.4. NMC
- 3.5. Others
-
4. Capacity
- 4.1. 15 kWh to 40 kWh
- 4.2. 40 kWh to 80 kWh
- 4.3. Above 80 kWh
- 4.4. Less than 15 kWh
-
5. Battery Form
- 5.1. Cylindrical
- 5.2. Pouch
- 5.3. Prismatic
-
6. Method
- 6.1. Laser
- 6.2. Wire
-
7. Component
- 7.1. Anode
- 7.2. Cathode
- 7.3. Electrolyte
- 7.4. Separator
-
8. Material Type
- 8.1. Cobalt
- 8.2. Lithium
- 8.3. Manganese
- 8.4. Natural Graphite
- 8.5. Nickel
- 8.6. Other Materials
US Electric Commercial Vehicle Battery Pack Market Segmentation By Geography
-
1. North America
- 1.1. United States
- 1.2. Canada
- 1.3. Mexico
-
2. South America
- 2.1. Brazil
- 2.2. Argentina
- 2.3. Rest of South America
-
3. Europe
- 3.1. United Kingdom
- 3.2. Germany
- 3.3. France
- 3.4. Italy
- 3.5. Spain
- 3.6. Russia
- 3.7. Benelux
- 3.8. Nordics
- 3.9. Rest of Europe
-
4. Middle East & Africa
- 4.1. Turkey
- 4.2. Israel
- 4.3. GCC
- 4.4. North Africa
- 4.5. South Africa
- 4.6. Rest of Middle East & Africa
-
5. Asia Pacific
- 5.1. China
- 5.2. India
- 5.3. Japan
- 5.4. South Korea
- 5.5. ASEAN
- 5.6. Oceania
- 5.7. Rest of Asia Pacific
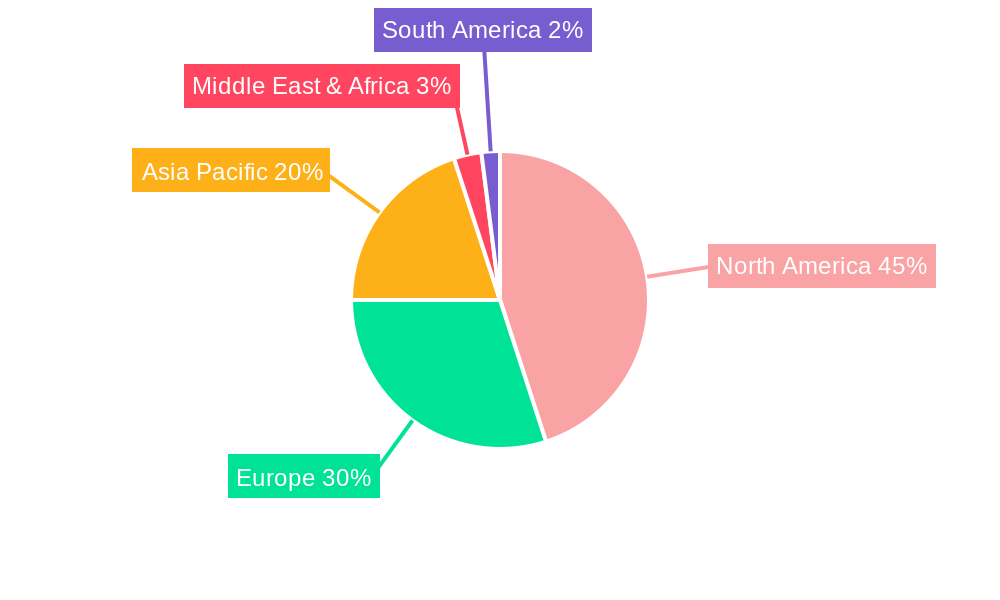
US Electric Commercial Vehicle Battery Pack Market Regional Market Share
Geographic Coverage of US Electric Commercial Vehicle Battery Pack Market
US Electric Commercial Vehicle Battery Pack Market REPORT HIGHLIGHTS
| Aspects | Details |
|---|---|
| Study Period | 2020-2034 |
| Base Year | 2025 |
| Estimated Year | 2026 |
| Forecast Period | 2026-2034 |
| Historical Period | 2020-2025 |
| Growth Rate | CAGR of 10.55% from 2020-2034 |
| Segmentation |
|
Table of Contents
- 1. Introduction
- 1.1. Research Scope
- 1.2. Market Segmentation
- 1.3. Research Objective
- 1.4. Definitions and Assumptions
- 2. Executive Summary
- 2.1. Market Snapshot
- 3. Market Dynamics
- 3.1. Market Drivers
- 3.2. Market Restrains
- 3.3. Market Trends
- 3.4. Market Opportunities
- 4. Market Factor Analysis
- 4.1. Porters Five Forces
- 4.1.1. Bargaining Power of Suppliers
- 4.1.2. Bargaining Power of Buyers
- 4.1.3. Threat of New Entrants
- 4.1.4. Threat of Substitutes
- 4.1.5. Competitive Rivalry
- 4.2. PESTEL analysis
- 4.3. BCG Analysis
- 4.3.1. Stars (High Growth, High Market Share)
- 4.3.2. Cash Cows (Low Growth, High Market Share)
- 4.3.3. Question Mark (High Growth, Low Market Share)
- 4.3.4. Dogs (Low Growth, Low Market Share)
- 4.4. Ansoff Matrix Analysis
- 4.5. Supply Chain Analysis
- 4.6. Regulatory Landscape
- 4.7. Current Market Potential and Opportunity Assessment (TAM–SAM–SOM Framework)
- 4.8. MDP Analyst Note
- 4.1. Porters Five Forces
- 5. Market Analysis, Insights and Forecast 2021-2033
- 5.1. Market Analysis, Insights and Forecast - by Body Type
- 5.1.1. Bus
- 5.1.2. LCV
- 5.1.3. M&HDT
- 5.2. Market Analysis, Insights and Forecast - by Propulsion Type
- 5.2.1. BEV
- 5.2.2. PHEV
- 5.3. Market Analysis, Insights and Forecast - by Battery Chemistry
- 5.3.1. LFP
- 5.3.2. NCA
- 5.3.3. NCM
- 5.3.4. NMC
- 5.3.5. Others
- 5.4. Market Analysis, Insights and Forecast - by Capacity
- 5.4.1. 15 kWh to 40 kWh
- 5.4.2. 40 kWh to 80 kWh
- 5.4.3. Above 80 kWh
- 5.4.4. Less than 15 kWh
- 5.5. Market Analysis, Insights and Forecast - by Battery Form
- 5.5.1. Cylindrical
- 5.5.2. Pouch
- 5.5.3. Prismatic
- 5.6. Market Analysis, Insights and Forecast - by Method
- 5.6.1. Laser
- 5.6.2. Wire
- 5.7. Market Analysis, Insights and Forecast - by Component
- 5.7.1. Anode
- 5.7.2. Cathode
- 5.7.3. Electrolyte
- 5.7.4. Separator
- 5.8. Market Analysis, Insights and Forecast - by Material Type
- 5.8.1. Cobalt
- 5.8.2. Lithium
- 5.8.3. Manganese
- 5.8.4. Natural Graphite
- 5.8.5. Nickel
- 5.8.6. Other Materials
- 5.9. Market Analysis, Insights and Forecast - by Region
- 5.9.1. North America
- 5.9.2. South America
- 5.9.3. Europe
- 5.9.4. Middle East & Africa
- 5.9.5. Asia Pacific
- 5.1. Market Analysis, Insights and Forecast - by Body Type
- 6. Global US Electric Commercial Vehicle Battery Pack Market Analysis, Insights and Forecast, 2021-2033
- 6.1. Market Analysis, Insights and Forecast - by Body Type
- 6.1.1. Bus
- 6.1.2. LCV
- 6.1.3. M&HDT
- 6.2. Market Analysis, Insights and Forecast - by Propulsion Type
- 6.2.1. BEV
- 6.2.2. PHEV
- 6.3. Market Analysis, Insights and Forecast - by Battery Chemistry
- 6.3.1. LFP
- 6.3.2. NCA
- 6.3.3. NCM
- 6.3.4. NMC
- 6.3.5. Others
- 6.4. Market Analysis, Insights and Forecast - by Capacity
- 6.4.1. 15 kWh to 40 kWh
- 6.4.2. 40 kWh to 80 kWh
- 6.4.3. Above 80 kWh
- 6.4.4. Less than 15 kWh
- 6.5. Market Analysis, Insights and Forecast - by Battery Form
- 6.5.1. Cylindrical
- 6.5.2. Pouch
- 6.5.3. Prismatic
- 6.6. Market Analysis, Insights and Forecast - by Method
- 6.6.1. Laser
- 6.6.2. Wire
- 6.7. Market Analysis, Insights and Forecast - by Component
- 6.7.1. Anode
- 6.7.2. Cathode
- 6.7.3. Electrolyte
- 6.7.4. Separator
- 6.8. Market Analysis, Insights and Forecast - by Material Type
- 6.8.1. Cobalt
- 6.8.2. Lithium
- 6.8.3. Manganese
- 6.8.4. Natural Graphite
- 6.8.5. Nickel
- 6.8.6. Other Materials
- 6.1. Market Analysis, Insights and Forecast - by Body Type
- 7. North America US Electric Commercial Vehicle Battery Pack Market Analysis, Insights and Forecast, 2020-2032
- 7.1. Market Analysis, Insights and Forecast - by Body Type
- 7.1.1. Bus
- 7.1.2. LCV
- 7.1.3. M&HDT
- 7.2. Market Analysis, Insights and Forecast - by Propulsion Type
- 7.2.1. BEV
- 7.2.2. PHEV
- 7.3. Market Analysis, Insights and Forecast - by Battery Chemistry
- 7.3.1. LFP
- 7.3.2. NCA
- 7.3.3. NCM
- 7.3.4. NMC
- 7.3.5. Others
- 7.4. Market Analysis, Insights and Forecast - by Capacity
- 7.4.1. 15 kWh to 40 kWh
- 7.4.2. 40 kWh to 80 kWh
- 7.4.3. Above 80 kWh
- 7.4.4. Less than 15 kWh
- 7.5. Market Analysis, Insights and Forecast - by Battery Form
- 7.5.1. Cylindrical
- 7.5.2. Pouch
- 7.5.3. Prismatic
- 7.6. Market Analysis, Insights and Forecast - by Method
- 7.6.1. Laser
- 7.6.2. Wire
- 7.7. Market Analysis, Insights and Forecast - by Component
- 7.7.1. Anode
- 7.7.2. Cathode
- 7.7.3. Electrolyte
- 7.7.4. Separator
- 7.8. Market Analysis, Insights and Forecast - by Material Type
- 7.8.1. Cobalt
- 7.8.2. Lithium
- 7.8.3. Manganese
- 7.8.4. Natural Graphite
- 7.8.5. Nickel
- 7.8.6. Other Materials
- 7.1. Market Analysis, Insights and Forecast - by Body Type
- 8. South America US Electric Commercial Vehicle Battery Pack Market Analysis, Insights and Forecast, 2020-2032
- 8.1. Market Analysis, Insights and Forecast - by Body Type
- 8.1.1. Bus
- 8.1.2. LCV
- 8.1.3. M&HDT
- 8.2. Market Analysis, Insights and Forecast - by Propulsion Type
- 8.2.1. BEV
- 8.2.2. PHEV
- 8.3. Market Analysis, Insights and Forecast - by Battery Chemistry
- 8.3.1. LFP
- 8.3.2. NCA
- 8.3.3. NCM
- 8.3.4. NMC
- 8.3.5. Others
- 8.4. Market Analysis, Insights and Forecast - by Capacity
- 8.4.1. 15 kWh to 40 kWh
- 8.4.2. 40 kWh to 80 kWh
- 8.4.3. Above 80 kWh
- 8.4.4. Less than 15 kWh
- 8.5. Market Analysis, Insights and Forecast - by Battery Form
- 8.5.1. Cylindrical
- 8.5.2. Pouch
- 8.5.3. Prismatic
- 8.6. Market Analysis, Insights and Forecast - by Method
- 8.6.1. Laser
- 8.6.2. Wire
- 8.7. Market Analysis, Insights and Forecast - by Component
- 8.7.1. Anode
- 8.7.2. Cathode
- 8.7.3. Electrolyte
- 8.7.4. Separator
- 8.8. Market Analysis, Insights and Forecast - by Material Type
- 8.8.1. Cobalt
- 8.8.2. Lithium
- 8.8.3. Manganese
- 8.8.4. Natural Graphite
- 8.8.5. Nickel
- 8.8.6. Other Materials
- 8.1. Market Analysis, Insights and Forecast - by Body Type
- 9. Europe US Electric Commercial Vehicle Battery Pack Market Analysis, Insights and Forecast, 2020-2032
- 9.1. Market Analysis, Insights and Forecast - by Body Type
- 9.1.1. Bus
- 9.1.2. LCV
- 9.1.3. M&HDT
- 9.2. Market Analysis, Insights and Forecast - by Propulsion Type
- 9.2.1. BEV
- 9.2.2. PHEV
- 9.3. Market Analysis, Insights and Forecast - by Battery Chemistry
- 9.3.1. LFP
- 9.3.2. NCA
- 9.3.3. NCM
- 9.3.4. NMC
- 9.3.5. Others
- 9.4. Market Analysis, Insights and Forecast - by Capacity
- 9.4.1. 15 kWh to 40 kWh
- 9.4.2. 40 kWh to 80 kWh
- 9.4.3. Above 80 kWh
- 9.4.4. Less than 15 kWh
- 9.5. Market Analysis, Insights and Forecast - by Battery Form
- 9.5.1. Cylindrical
- 9.5.2. Pouch
- 9.5.3. Prismatic
- 9.6. Market Analysis, Insights and Forecast - by Method
- 9.6.1. Laser
- 9.6.2. Wire
- 9.7. Market Analysis, Insights and Forecast - by Component
- 9.7.1. Anode
- 9.7.2. Cathode
- 9.7.3. Electrolyte
- 9.7.4. Separator
- 9.8. Market Analysis, Insights and Forecast - by Material Type
- 9.8.1. Cobalt
- 9.8.2. Lithium
- 9.8.3. Manganese
- 9.8.4. Natural Graphite
- 9.8.5. Nickel
- 9.8.6. Other Materials
- 9.1. Market Analysis, Insights and Forecast - by Body Type
- 10. Middle East & Africa US Electric Commercial Vehicle Battery Pack Market Analysis, Insights and Forecast, 2020-2032
- 10.1. Market Analysis, Insights and Forecast - by Body Type
- 10.1.1. Bus
- 10.1.2. LCV
- 10.1.3. M&HDT
- 10.2. Market Analysis, Insights and Forecast - by Propulsion Type
- 10.2.1. BEV
- 10.2.2. PHEV
- 10.3. Market Analysis, Insights and Forecast - by Battery Chemistry
- 10.3.1. LFP
- 10.3.2. NCA
- 10.3.3. NCM
- 10.3.4. NMC
- 10.3.5. Others
- 10.4. Market Analysis, Insights and Forecast - by Capacity
- 10.4.1. 15 kWh to 40 kWh
- 10.4.2. 40 kWh to 80 kWh
- 10.4.3. Above 80 kWh
- 10.4.4. Less than 15 kWh
- 10.5. Market Analysis, Insights and Forecast - by Battery Form
- 10.5.1. Cylindrical
- 10.5.2. Pouch
- 10.5.3. Prismatic
- 10.6. Market Analysis, Insights and Forecast - by Method
- 10.6.1. Laser
- 10.6.2. Wire
- 10.7. Market Analysis, Insights and Forecast - by Component
- 10.7.1. Anode
- 10.7.2. Cathode
- 10.7.3. Electrolyte
- 10.7.4. Separator
- 10.8. Market Analysis, Insights and Forecast - by Material Type
- 10.8.1. Cobalt
- 10.8.2. Lithium
- 10.8.3. Manganese
- 10.8.4. Natural Graphite
- 10.8.5. Nickel
- 10.8.6. Other Materials
- 10.1. Market Analysis, Insights and Forecast - by Body Type
- 11. Asia Pacific US Electric Commercial Vehicle Battery Pack Market Analysis, Insights and Forecast, 2020-2032
- 11.1. Market Analysis, Insights and Forecast - by Body Type
- 11.1.1. Bus
- 11.1.2. LCV
- 11.1.3. M&HDT
- 11.2. Market Analysis, Insights and Forecast - by Propulsion Type
- 11.2.1. BEV
- 11.2.2. PHEV
- 11.3. Market Analysis, Insights and Forecast - by Battery Chemistry
- 11.3.1. LFP
- 11.3.2. NCA
- 11.3.3. NCM
- 11.3.4. NMC
- 11.3.5. Others
- 11.4. Market Analysis, Insights and Forecast - by Capacity
- 11.4.1. 15 kWh to 40 kWh
- 11.4.2. 40 kWh to 80 kWh
- 11.4.3. Above 80 kWh
- 11.4.4. Less than 15 kWh
- 11.5. Market Analysis, Insights and Forecast - by Battery Form
- 11.5.1. Cylindrical
- 11.5.2. Pouch
- 11.5.3. Prismatic
- 11.6. Market Analysis, Insights and Forecast - by Method
- 11.6.1. Laser
- 11.6.2. Wire
- 11.7. Market Analysis, Insights and Forecast - by Component
- 11.7.1. Anode
- 11.7.2. Cathode
- 11.7.3. Electrolyte
- 11.7.4. Separator
- 11.8. Market Analysis, Insights and Forecast - by Material Type
- 11.8.1. Cobalt
- 11.8.2. Lithium
- 11.8.3. Manganese
- 11.8.4. Natural Graphite
- 11.8.5. Nickel
- 11.8.6. Other Materials
- 11.1. Market Analysis, Insights and Forecast - by Body Type
- 12. Competitive Analysis
- 12.1. Company Profiles
- 12.1.1 Econtrols LLC
- 12.1.1.1. Company Overview
- 12.1.1.2. Products
- 12.1.1.3. Company Financials
- 12.1.1.4. SWOT Analysis
- 12.1.2 Samsung SDI Co Ltd
- 12.1.2.1. Company Overview
- 12.1.2.2. Products
- 12.1.2.3. Company Financials
- 12.1.2.4. SWOT Analysis
- 12.1.3 LG Energy Solution Ltd
- 12.1.3.1. Company Overview
- 12.1.3.2. Products
- 12.1.3.3. Company Financials
- 12.1.3.4. SWOT Analysis
- 12.1.4 Imperium3 New York (IM3NY)
- 12.1.4.1. Company Overview
- 12.1.4.2. Products
- 12.1.4.3. Company Financials
- 12.1.4.4. SWOT Analysis
- 12.1.5 XALT Energ
- 12.1.5.1. Company Overview
- 12.1.5.2. Products
- 12.1.5.3. Company Financials
- 12.1.5.4. SWOT Analysis
- 12.1.6 Contemporary Amperex Technology Co Ltd (CATL)
- 12.1.6.1. Company Overview
- 12.1.6.2. Products
- 12.1.6.3. Company Financials
- 12.1.6.4. SWOT Analysis
- 12.1.7 Tesla Inc
- 12.1.7.1. Company Overview
- 12.1.7.2. Products
- 12.1.7.3. Company Financials
- 12.1.7.4. SWOT Analysis
- 12.1.8 Robert Bosch GmbH
- 12.1.8.1. Company Overview
- 12.1.8.2. Products
- 12.1.8.3. Company Financials
- 12.1.8.4. SWOT Analysis
- 12.1.9 BYD Company Ltd
- 12.1.9.1. Company Overview
- 12.1.9.2. Products
- 12.1.9.3. Company Financials
- 12.1.9.4. SWOT Analysis
- 12.1.10 SK Innovation Co Ltd
- 12.1.10.1. Company Overview
- 12.1.10.2. Products
- 12.1.10.3. Company Financials
- 12.1.10.4. SWOT Analysis
- 12.1.11 Proterra Operating Company Inc
- 12.1.11.1. Company Overview
- 12.1.11.2. Products
- 12.1.11.3. Company Financials
- 12.1.11.4. SWOT Analysis
- 12.1.12 Panasonic Holdings Corporation
- 12.1.12.1. Company Overview
- 12.1.12.2. Products
- 12.1.12.3. Company Financials
- 12.1.12.4. SWOT Analysis
- 12.1.13 Envision AESC Japan Co Ltd
- 12.1.13.1. Company Overview
- 12.1.13.2. Products
- 12.1.13.3. Company Financials
- 12.1.13.4. SWOT Analysis
- 12.1.1 Econtrols LLC
- 12.2. Market Entropy
- 12.2.1 Company's Key Areas Served
- 12.2.2 Recent Developments
- 12.3. Company Market Share Analysis 2025
- 12.3.1 Top 5 Companies Market Share Analysis
- 12.3.2 Top 3 Companies Market Share Analysis
- 12.4. List of Potential Customers
- 13. Research Methodology
List of Figures
- Figure 1: Global US Electric Commercial Vehicle Battery Pack Market Revenue Breakdown (Million, %) by Region 2025 & 2033
- Figure 2: North America US Electric Commercial Vehicle Battery Pack Market Revenue (Million), by Body Type 2025 & 2033
- Figure 3: North America US Electric Commercial Vehicle Battery Pack Market Revenue Share (%), by Body Type 2025 & 2033
- Figure 4: North America US Electric Commercial Vehicle Battery Pack Market Revenue (Million), by Propulsion Type 2025 & 2033
- Figure 5: North America US Electric Commercial Vehicle Battery Pack Market Revenue Share (%), by Propulsion Type 2025 & 2033
- Figure 6: North America US Electric Commercial Vehicle Battery Pack Market Revenue (Million), by Battery Chemistry 2025 & 2033
- Figure 7: North America US Electric Commercial Vehicle Battery Pack Market Revenue Share (%), by Battery Chemistry 2025 & 2033
- Figure 8: North America US Electric Commercial Vehicle Battery Pack Market Revenue (Million), by Capacity 2025 & 2033
- Figure 9: North America US Electric Commercial Vehicle Battery Pack Market Revenue Share (%), by Capacity 2025 & 2033
- Figure 10: North America US Electric Commercial Vehicle Battery Pack Market Revenue (Million), by Battery Form 2025 & 2033
- Figure 11: North America US Electric Commercial Vehicle Battery Pack Market Revenue Share (%), by Battery Form 2025 & 2033
- Figure 12: North America US Electric Commercial Vehicle Battery Pack Market Revenue (Million), by Method 2025 & 2033
- Figure 13: North America US Electric Commercial Vehicle Battery Pack Market Revenue Share (%), by Method 2025 & 2033
- Figure 14: North America US Electric Commercial Vehicle Battery Pack Market Revenue (Million), by Component 2025 & 2033
- Figure 15: North America US Electric Commercial Vehicle Battery Pack Market Revenue Share (%), by Component 2025 & 2033
- Figure 16: North America US Electric Commercial Vehicle Battery Pack Market Revenue (Million), by Material Type 2025 & 2033
- Figure 17: North America US Electric Commercial Vehicle Battery Pack Market Revenue Share (%), by Material Type 2025 & 2033
- Figure 18: North America US Electric Commercial Vehicle Battery Pack Market Revenue (Million), by Country 2025 & 2033
- Figure 19: North America US Electric Commercial Vehicle Battery Pack Market Revenue Share (%), by Country 2025 & 2033
- Figure 20: South America US Electric Commercial Vehicle Battery Pack Market Revenue (Million), by Body Type 2025 & 2033
- Figure 21: South America US Electric Commercial Vehicle Battery Pack Market Revenue Share (%), by Body Type 2025 & 2033
- Figure 22: South America US Electric Commercial Vehicle Battery Pack Market Revenue (Million), by Propulsion Type 2025 & 2033
- Figure 23: South America US Electric Commercial Vehicle Battery Pack Market Revenue Share (%), by Propulsion Type 2025 & 2033
- Figure 24: South America US Electric Commercial Vehicle Battery Pack Market Revenue (Million), by Battery Chemistry 2025 & 2033
- Figure 25: South America US Electric Commercial Vehicle Battery Pack Market Revenue Share (%), by Battery Chemistry 2025 & 2033
- Figure 26: South America US Electric Commercial Vehicle Battery Pack Market Revenue (Million), by Capacity 2025 & 2033
- Figure 27: South America US Electric Commercial Vehicle Battery Pack Market Revenue Share (%), by Capacity 2025 & 2033
- Figure 28: South America US Electric Commercial Vehicle Battery Pack Market Revenue (Million), by Battery Form 2025 & 2033
- Figure 29: South America US Electric Commercial Vehicle Battery Pack Market Revenue Share (%), by Battery Form 2025 & 2033
- Figure 30: South America US Electric Commercial Vehicle Battery Pack Market Revenue (Million), by Method 2025 & 2033
- Figure 31: South America US Electric Commercial Vehicle Battery Pack Market Revenue Share (%), by Method 2025 & 2033
- Figure 32: South America US Electric Commercial Vehicle Battery Pack Market Revenue (Million), by Component 2025 & 2033
- Figure 33: South America US Electric Commercial Vehicle Battery Pack Market Revenue Share (%), by Component 2025 & 2033
- Figure 34: South America US Electric Commercial Vehicle Battery Pack Market Revenue (Million), by Material Type 2025 & 2033
- Figure 35: South America US Electric Commercial Vehicle Battery Pack Market Revenue Share (%), by Material Type 2025 & 2033
- Figure 36: South America US Electric Commercial Vehicle Battery Pack Market Revenue (Million), by Country 2025 & 2033
- Figure 37: South America US Electric Commercial Vehicle Battery Pack Market Revenue Share (%), by Country 2025 & 2033
- Figure 38: Europe US Electric Commercial Vehicle Battery Pack Market Revenue (Million), by Body Type 2025 & 2033
- Figure 39: Europe US Electric Commercial Vehicle Battery Pack Market Revenue Share (%), by Body Type 2025 & 2033
- Figure 40: Europe US Electric Commercial Vehicle Battery Pack Market Revenue (Million), by Propulsion Type 2025 & 2033
- Figure 41: Europe US Electric Commercial Vehicle Battery Pack Market Revenue Share (%), by Propulsion Type 2025 & 2033
- Figure 42: Europe US Electric Commercial Vehicle Battery Pack Market Revenue (Million), by Battery Chemistry 2025 & 2033
- Figure 43: Europe US Electric Commercial Vehicle Battery Pack Market Revenue Share (%), by Battery Chemistry 2025 & 2033
- Figure 44: Europe US Electric Commercial Vehicle Battery Pack Market Revenue (Million), by Capacity 2025 & 2033
- Figure 45: Europe US Electric Commercial Vehicle Battery Pack Market Revenue Share (%), by Capacity 2025 & 2033
- Figure 46: Europe US Electric Commercial Vehicle Battery Pack Market Revenue (Million), by Battery Form 2025 & 2033
- Figure 47: Europe US Electric Commercial Vehicle Battery Pack Market Revenue Share (%), by Battery Form 2025 & 2033
- Figure 48: Europe US Electric Commercial Vehicle Battery Pack Market Revenue (Million), by Method 2025 & 2033
- Figure 49: Europe US Electric Commercial Vehicle Battery Pack Market Revenue Share (%), by Method 2025 & 2033
- Figure 50: Europe US Electric Commercial Vehicle Battery Pack Market Revenue (Million), by Component 2025 & 2033
- Figure 51: Europe US Electric Commercial Vehicle Battery Pack Market Revenue Share (%), by Component 2025 & 2033
- Figure 52: Europe US Electric Commercial Vehicle Battery Pack Market Revenue (Million), by Material Type 2025 & 2033
- Figure 53: Europe US Electric Commercial Vehicle Battery Pack Market Revenue Share (%), by Material Type 2025 & 2033
- Figure 54: Europe US Electric Commercial Vehicle Battery Pack Market Revenue (Million), by Country 2025 & 2033
- Figure 55: Europe US Electric Commercial Vehicle Battery Pack Market Revenue Share (%), by Country 2025 & 2033
- Figure 56: Middle East & Africa US Electric Commercial Vehicle Battery Pack Market Revenue (Million), by Body Type 2025 & 2033
- Figure 57: Middle East & Africa US Electric Commercial Vehicle Battery Pack Market Revenue Share (%), by Body Type 2025 & 2033
- Figure 58: Middle East & Africa US Electric Commercial Vehicle Battery Pack Market Revenue (Million), by Propulsion Type 2025 & 2033
- Figure 59: Middle East & Africa US Electric Commercial Vehicle Battery Pack Market Revenue Share (%), by Propulsion Type 2025 & 2033
- Figure 60: Middle East & Africa US Electric Commercial Vehicle Battery Pack Market Revenue (Million), by Battery Chemistry 2025 & 2033
- Figure 61: Middle East & Africa US Electric Commercial Vehicle Battery Pack Market Revenue Share (%), by Battery Chemistry 2025 & 2033
- Figure 62: Middle East & Africa US Electric Commercial Vehicle Battery Pack Market Revenue (Million), by Capacity 2025 & 2033
- Figure 63: Middle East & Africa US Electric Commercial Vehicle Battery Pack Market Revenue Share (%), by Capacity 2025 & 2033
- Figure 64: Middle East & Africa US Electric Commercial Vehicle Battery Pack Market Revenue (Million), by Battery Form 2025 & 2033
- Figure 65: Middle East & Africa US Electric Commercial Vehicle Battery Pack Market Revenue Share (%), by Battery Form 2025 & 2033
- Figure 66: Middle East & Africa US Electric Commercial Vehicle Battery Pack Market Revenue (Million), by Method 2025 & 2033
- Figure 67: Middle East & Africa US Electric Commercial Vehicle Battery Pack Market Revenue Share (%), by Method 2025 & 2033
- Figure 68: Middle East & Africa US Electric Commercial Vehicle Battery Pack Market Revenue (Million), by Component 2025 & 2033
- Figure 69: Middle East & Africa US Electric Commercial Vehicle Battery Pack Market Revenue Share (%), by Component 2025 & 2033
- Figure 70: Middle East & Africa US Electric Commercial Vehicle Battery Pack Market Revenue (Million), by Material Type 2025 & 2033
- Figure 71: Middle East & Africa US Electric Commercial Vehicle Battery Pack Market Revenue Share (%), by Material Type 2025 & 2033
- Figure 72: Middle East & Africa US Electric Commercial Vehicle Battery Pack Market Revenue (Million), by Country 2025 & 2033
- Figure 73: Middle East & Africa US Electric Commercial Vehicle Battery Pack Market Revenue Share (%), by Country 2025 & 2033
- Figure 74: Asia Pacific US Electric Commercial Vehicle Battery Pack Market Revenue (Million), by Body Type 2025 & 2033
- Figure 75: Asia Pacific US Electric Commercial Vehicle Battery Pack Market Revenue Share (%), by Body Type 2025 & 2033
- Figure 76: Asia Pacific US Electric Commercial Vehicle Battery Pack Market Revenue (Million), by Propulsion Type 2025 & 2033
- Figure 77: Asia Pacific US Electric Commercial Vehicle Battery Pack Market Revenue Share (%), by Propulsion Type 2025 & 2033
- Figure 78: Asia Pacific US Electric Commercial Vehicle Battery Pack Market Revenue (Million), by Battery Chemistry 2025 & 2033
- Figure 79: Asia Pacific US Electric Commercial Vehicle Battery Pack Market Revenue Share (%), by Battery Chemistry 2025 & 2033
- Figure 80: Asia Pacific US Electric Commercial Vehicle Battery Pack Market Revenue (Million), by Capacity 2025 & 2033
- Figure 81: Asia Pacific US Electric Commercial Vehicle Battery Pack Market Revenue Share (%), by Capacity 2025 & 2033
- Figure 82: Asia Pacific US Electric Commercial Vehicle Battery Pack Market Revenue (Million), by Battery Form 2025 & 2033
- Figure 83: Asia Pacific US Electric Commercial Vehicle Battery Pack Market Revenue Share (%), by Battery Form 2025 & 2033
- Figure 84: Asia Pacific US Electric Commercial Vehicle Battery Pack Market Revenue (Million), by Method 2025 & 2033
- Figure 85: Asia Pacific US Electric Commercial Vehicle Battery Pack Market Revenue Share (%), by Method 2025 & 2033
- Figure 86: Asia Pacific US Electric Commercial Vehicle Battery Pack Market Revenue (Million), by Component 2025 & 2033
- Figure 87: Asia Pacific US Electric Commercial Vehicle Battery Pack Market Revenue Share (%), by Component 2025 & 2033
- Figure 88: Asia Pacific US Electric Commercial Vehicle Battery Pack Market Revenue (Million), by Material Type 2025 & 2033
- Figure 89: Asia Pacific US Electric Commercial Vehicle Battery Pack Market Revenue Share (%), by Material Type 2025 & 2033
- Figure 90: Asia Pacific US Electric Commercial Vehicle Battery Pack Market Revenue (Million), by Country 2025 & 2033
- Figure 91: Asia Pacific US Electric Commercial Vehicle Battery Pack Market Revenue Share (%), by Country 2025 & 2033
List of Tables
- Table 1: Global US Electric Commercial Vehicle Battery Pack Market Revenue Million Forecast, by Body Type 2020 & 2033
- Table 2: Global US Electric Commercial Vehicle Battery Pack Market Revenue Million Forecast, by Propulsion Type 2020 & 2033
- Table 3: Global US Electric Commercial Vehicle Battery Pack Market Revenue Million Forecast, by Battery Chemistry 2020 & 2033
- Table 4: Global US Electric Commercial Vehicle Battery Pack Market Revenue Million Forecast, by Capacity 2020 & 2033
- Table 5: Global US Electric Commercial Vehicle Battery Pack Market Revenue Million Forecast, by Battery Form 2020 & 2033
- Table 6: Global US Electric Commercial Vehicle Battery Pack Market Revenue Million Forecast, by Method 2020 & 2033
- Table 7: Global US Electric Commercial Vehicle Battery Pack Market Revenue Million Forecast, by Component 2020 & 2033
- Table 8: Global US Electric Commercial Vehicle Battery Pack Market Revenue Million Forecast, by Material Type 2020 & 2033
- Table 9: Global US Electric Commercial Vehicle Battery Pack Market Revenue Million Forecast, by Region 2020 & 2033
- Table 10: Global US Electric Commercial Vehicle Battery Pack Market Revenue Million Forecast, by Body Type 2020 & 2033
- Table 11: Global US Electric Commercial Vehicle Battery Pack Market Revenue Million Forecast, by Propulsion Type 2020 & 2033
- Table 12: Global US Electric Commercial Vehicle Battery Pack Market Revenue Million Forecast, by Battery Chemistry 2020 & 2033
- Table 13: Global US Electric Commercial Vehicle Battery Pack Market Revenue Million Forecast, by Capacity 2020 & 2033
- Table 14: Global US Electric Commercial Vehicle Battery Pack Market Revenue Million Forecast, by Battery Form 2020 & 2033
- Table 15: Global US Electric Commercial Vehicle Battery Pack Market Revenue Million Forecast, by Method 2020 & 2033
- Table 16: Global US Electric Commercial Vehicle Battery Pack Market Revenue Million Forecast, by Component 2020 & 2033
- Table 17: Global US Electric Commercial Vehicle Battery Pack Market Revenue Million Forecast, by Material Type 2020 & 2033
- Table 18: Global US Electric Commercial Vehicle Battery Pack Market Revenue Million Forecast, by Country 2020 & 2033
- Table 19: United States US Electric Commercial Vehicle Battery Pack Market Revenue (Million) Forecast, by Application 2020 & 2033
- Table 20: Canada US Electric Commercial Vehicle Battery Pack Market Revenue (Million) Forecast, by Application 2020 & 2033
- Table 21: Mexico US Electric Commercial Vehicle Battery Pack Market Revenue (Million) Forecast, by Application 2020 & 2033
- Table 22: Global US Electric Commercial Vehicle Battery Pack Market Revenue Million Forecast, by Body Type 2020 & 2033
- Table 23: Global US Electric Commercial Vehicle Battery Pack Market Revenue Million Forecast, by Propulsion Type 2020 & 2033
- Table 24: Global US Electric Commercial Vehicle Battery Pack Market Revenue Million Forecast, by Battery Chemistry 2020 & 2033
- Table 25: Global US Electric Commercial Vehicle Battery Pack Market Revenue Million Forecast, by Capacity 2020 & 2033
- Table 26: Global US Electric Commercial Vehicle Battery Pack Market Revenue Million Forecast, by Battery Form 2020 & 2033
- Table 27: Global US Electric Commercial Vehicle Battery Pack Market Revenue Million Forecast, by Method 2020 & 2033
- Table 28: Global US Electric Commercial Vehicle Battery Pack Market Revenue Million Forecast, by Component 2020 & 2033
- Table 29: Global US Electric Commercial Vehicle Battery Pack Market Revenue Million Forecast, by Material Type 2020 & 2033
- Table 30: Global US Electric Commercial Vehicle Battery Pack Market Revenue Million Forecast, by Country 2020 & 2033
- Table 31: Brazil US Electric Commercial Vehicle Battery Pack Market Revenue (Million) Forecast, by Application 2020 & 2033
- Table 32: Argentina US Electric Commercial Vehicle Battery Pack Market Revenue (Million) Forecast, by Application 2020 & 2033
- Table 33: Rest of South America US Electric Commercial Vehicle Battery Pack Market Revenue (Million) Forecast, by Application 2020 & 2033
- Table 34: Global US Electric Commercial Vehicle Battery Pack Market Revenue Million Forecast, by Body Type 2020 & 2033
- Table 35: Global US Electric Commercial Vehicle Battery Pack Market Revenue Million Forecast, by Propulsion Type 2020 & 2033
- Table 36: Global US Electric Commercial Vehicle Battery Pack Market Revenue Million Forecast, by Battery Chemistry 2020 & 2033
- Table 37: Global US Electric Commercial Vehicle Battery Pack Market Revenue Million Forecast, by Capacity 2020 & 2033
- Table 38: Global US Electric Commercial Vehicle Battery Pack Market Revenue Million Forecast, by Battery Form 2020 & 2033
- Table 39: Global US Electric Commercial Vehicle Battery Pack Market Revenue Million Forecast, by Method 2020 & 2033
- Table 40: Global US Electric Commercial Vehicle Battery Pack Market Revenue Million Forecast, by Component 2020 & 2033
- Table 41: Global US Electric Commercial Vehicle Battery Pack Market Revenue Million Forecast, by Material Type 2020 & 2033
- Table 42: Global US Electric Commercial Vehicle Battery Pack Market Revenue Million Forecast, by Country 2020 & 2033
- Table 43: United Kingdom US Electric Commercial Vehicle Battery Pack Market Revenue (Million) Forecast, by Application 2020 & 2033
- Table 44: Germany US Electric Commercial Vehicle Battery Pack Market Revenue (Million) Forecast, by Application 2020 & 2033
- Table 45: France US Electric Commercial Vehicle Battery Pack Market Revenue (Million) Forecast, by Application 2020 & 2033
- Table 46: Italy US Electric Commercial Vehicle Battery Pack Market Revenue (Million) Forecast, by Application 2020 & 2033
- Table 47: Spain US Electric Commercial Vehicle Battery Pack Market Revenue (Million) Forecast, by Application 2020 & 2033
- Table 48: Russia US Electric Commercial Vehicle Battery Pack Market Revenue (Million) Forecast, by Application 2020 & 2033
- Table 49: Benelux US Electric Commercial Vehicle Battery Pack Market Revenue (Million) Forecast, by Application 2020 & 2033
- Table 50: Nordics US Electric Commercial Vehicle Battery Pack Market Revenue (Million) Forecast, by Application 2020 & 2033
- Table 51: Rest of Europe US Electric Commercial Vehicle Battery Pack Market Revenue (Million) Forecast, by Application 2020 & 2033
- Table 52: Global US Electric Commercial Vehicle Battery Pack Market Revenue Million Forecast, by Body Type 2020 & 2033
- Table 53: Global US Electric Commercial Vehicle Battery Pack Market Revenue Million Forecast, by Propulsion Type 2020 & 2033
- Table 54: Global US Electric Commercial Vehicle Battery Pack Market Revenue Million Forecast, by Battery Chemistry 2020 & 2033
- Table 55: Global US Electric Commercial Vehicle Battery Pack Market Revenue Million Forecast, by Capacity 2020 & 2033
- Table 56: Global US Electric Commercial Vehicle Battery Pack Market Revenue Million Forecast, by Battery Form 2020 & 2033
- Table 57: Global US Electric Commercial Vehicle Battery Pack Market Revenue Million Forecast, by Method 2020 & 2033
- Table 58: Global US Electric Commercial Vehicle Battery Pack Market Revenue Million Forecast, by Component 2020 & 2033
- Table 59: Global US Electric Commercial Vehicle Battery Pack Market Revenue Million Forecast, by Material Type 2020 & 2033
- Table 60: Global US Electric Commercial Vehicle Battery Pack Market Revenue Million Forecast, by Country 2020 & 2033
- Table 61: Turkey US Electric Commercial Vehicle Battery Pack Market Revenue (Million) Forecast, by Application 2020 & 2033
- Table 62: Israel US Electric Commercial Vehicle Battery Pack Market Revenue (Million) Forecast, by Application 2020 & 2033
- Table 63: GCC US Electric Commercial Vehicle Battery Pack Market Revenue (Million) Forecast, by Application 2020 & 2033
- Table 64: North Africa US Electric Commercial Vehicle Battery Pack Market Revenue (Million) Forecast, by Application 2020 & 2033
- Table 65: South Africa US Electric Commercial Vehicle Battery Pack Market Revenue (Million) Forecast, by Application 2020 & 2033
- Table 66: Rest of Middle East & Africa US Electric Commercial Vehicle Battery Pack Market Revenue (Million) Forecast, by Application 2020 & 2033
- Table 67: Global US Electric Commercial Vehicle Battery Pack Market Revenue Million Forecast, by Body Type 2020 & 2033
- Table 68: Global US Electric Commercial Vehicle Battery Pack Market Revenue Million Forecast, by Propulsion Type 2020 & 2033
- Table 69: Global US Electric Commercial Vehicle Battery Pack Market Revenue Million Forecast, by Battery Chemistry 2020 & 2033
- Table 70: Global US Electric Commercial Vehicle Battery Pack Market Revenue Million Forecast, by Capacity 2020 & 2033
- Table 71: Global US Electric Commercial Vehicle Battery Pack Market Revenue Million Forecast, by Battery Form 2020 & 2033
- Table 72: Global US Electric Commercial Vehicle Battery Pack Market Revenue Million Forecast, by Method 2020 & 2033
- Table 73: Global US Electric Commercial Vehicle Battery Pack Market Revenue Million Forecast, by Component 2020 & 2033
- Table 74: Global US Electric Commercial Vehicle Battery Pack Market Revenue Million Forecast, by Material Type 2020 & 2033
- Table 75: Global US Electric Commercial Vehicle Battery Pack Market Revenue Million Forecast, by Country 2020 & 2033
- Table 76: China US Electric Commercial Vehicle Battery Pack Market Revenue (Million) Forecast, by Application 2020 & 2033
- Table 77: India US Electric Commercial Vehicle Battery Pack Market Revenue (Million) Forecast, by Application 2020 & 2033
- Table 78: Japan US Electric Commercial Vehicle Battery Pack Market Revenue (Million) Forecast, by Application 2020 & 2033
- Table 79: South Korea US Electric Commercial Vehicle Battery Pack Market Revenue (Million) Forecast, by Application 2020 & 2033
- Table 80: ASEAN US Electric Commercial Vehicle Battery Pack Market Revenue (Million) Forecast, by Application 2020 & 2033
- Table 81: Oceania US Electric Commercial Vehicle Battery Pack Market Revenue (Million) Forecast, by Application 2020 & 2033
- Table 82: Rest of Asia Pacific US Electric Commercial Vehicle Battery Pack Market Revenue (Million) Forecast, by Application 2020 & 2033
Frequently Asked Questions
1. What is the projected Compound Annual Growth Rate (CAGR) of the US Electric Commercial Vehicle Battery Pack Market?
The projected CAGR is approximately 10.55%.
2. Which companies are prominent players in the US Electric Commercial Vehicle Battery Pack Market?
Key companies in the market include Econtrols LLC, Samsung SDI Co Ltd, LG Energy Solution Ltd, Imperium3 New York (IM3NY), XALT Energ, Contemporary Amperex Technology Co Ltd (CATL), Tesla Inc, Robert Bosch GmbH, BYD Company Ltd, SK Innovation Co Ltd, Proterra Operating Company Inc, Panasonic Holdings Corporation, Envision AESC Japan Co Ltd.
3. What are the main segments of the US Electric Commercial Vehicle Battery Pack Market?
The market segments include Body Type, Propulsion Type, Battery Chemistry, Capacity, Battery Form, Method, Component, Material Type.
4. Can you provide details about the market size?
The market size is estimated to be USD XX Million as of 2022.
5. What are some drivers contributing to market growth?
Growing Travel and Tourism Industry is Driving the Car Rental Market.
6. What are the notable trends driving market growth?
OTHER KEY INDUSTRY TRENDS COVERED IN THE REPORT.
7. Are there any restraints impacting market growth?
Increasing Popularity of Ride-Sharing Services Pose Challenges for the Conventional Car Rental Market.
8. Can you provide examples of recent developments in the market?
February 2023: LG Energy Solution has been granted USD 237 million for the Honda battery plant project in Ohio, payable over the next 10 years, on top of approximately USD 156.3 million in tax incentives and infrastructure improvements.September 2022: LG Energy Solution has announced a partnership with three Canadian suppliers, Snow Lake Resources Ltd, Electra Battery Materials Corporation, and Avalon Advanced Materials Inc., to boost the supply chain for EV batteries in North America.August 2022: LG Energy Solutions and Honda Motor Co. announced a joint venture to produce electric vehicle batteries in the United States.
9. What pricing options are available for accessing the report?
Pricing options include single-user, multi-user, and enterprise licenses priced at USD 3800, USD 4500, and USD 5800 respectively.
10. Is the market size provided in terms of value or volume?
The market size is provided in terms of value, measured in Million.
11. Are there any specific market keywords associated with the report?
Yes, the market keyword associated with the report is "US Electric Commercial Vehicle Battery Pack Market," which aids in identifying and referencing the specific market segment covered.
12. How do I determine which pricing option suits my needs best?
The pricing options vary based on user requirements and access needs. Individual users may opt for single-user licenses, while businesses requiring broader access may choose multi-user or enterprise licenses for cost-effective access to the report.
13. Are there any additional resources or data provided in the US Electric Commercial Vehicle Battery Pack Market report?
While the report offers comprehensive insights, it's advisable to review the specific contents or supplementary materials provided to ascertain if additional resources or data are available.
14. How can I stay updated on further developments or reports in the US Electric Commercial Vehicle Battery Pack Market?
To stay informed about further developments, trends, and reports in the US Electric Commercial Vehicle Battery Pack Market, consider subscribing to industry newsletters, following relevant companies and organizations, or regularly checking reputable industry news sources and publications.
Methodology
Step 1 - Identification of Relevant Samples Size from Population Database


Step 2 - Approaches for Defining Global Market Size (Value, Volume* & Price*)

Note*: In applicable scenarios
Step 3 - Data Sources
Primary Research
- Web Analytics
- Survey Reports
- Research Institute
- Latest Research Reports
- Opinion Leaders
Secondary Research
- Annual Reports
- White Paper
- Latest Press Release
- Industry Association
- Paid Database
- Investor Presentations

Step 4 - Data Triangulation
Involves using different sources of information in order to increase the validity of a study
These sources are likely to be stakeholders in a program - participants, other researchers, program staff, other community members, and so on.
Then we put all data in single framework & apply various statistical tools to find out the dynamic on the market.
During the analysis stage, feedback from the stakeholder groups would be compared to determine areas of agreement as well as areas of divergence