

Key Insights
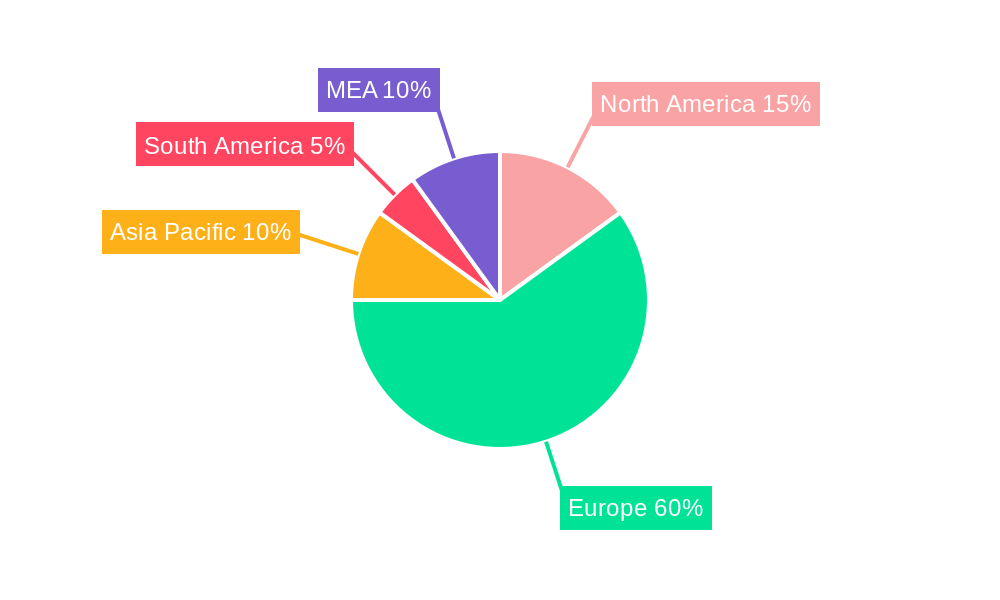
The North Sea decommissioning oil rigs market is experiencing robust growth, driven by the aging infrastructure of offshore oil and gas platforms and increasingly stringent environmental regulations. The market's Compound Annual Growth Rate (CAGR) exceeding 5% indicates a significant and sustained expansion projected through 2033. Key drivers include the mandatory decommissioning of aging platforms, rising operational costs associated with maintaining these aging assets, and a growing focus on environmental sustainability. Several segments contribute to this growth, notably shallow, deepwater, and ultra-deepwater decommissioning projects, each presenting unique technical and logistical challenges, influencing project costs and timelines. Major players such as Aker Solutions, DNV GL, Heerema Marine Contractors, and TechnipFMC are actively involved, vying for contracts and leveraging their specialized expertise in complex subsea operations and rig dismantling. The regional breakdown suggests Europe (particularly the North Sea region itself) holds the largest market share, given the concentration of aging platforms. However, other regions, including North America, are also witnessing growth as their own offshore infrastructure reaches the end of its operational life. Competition is fierce, necessitating technological advancements in efficient and environmentally sound decommissioning techniques to attract and secure projects. Further market growth will also be influenced by government policies and incentives encouraging responsible decommissioning practices.
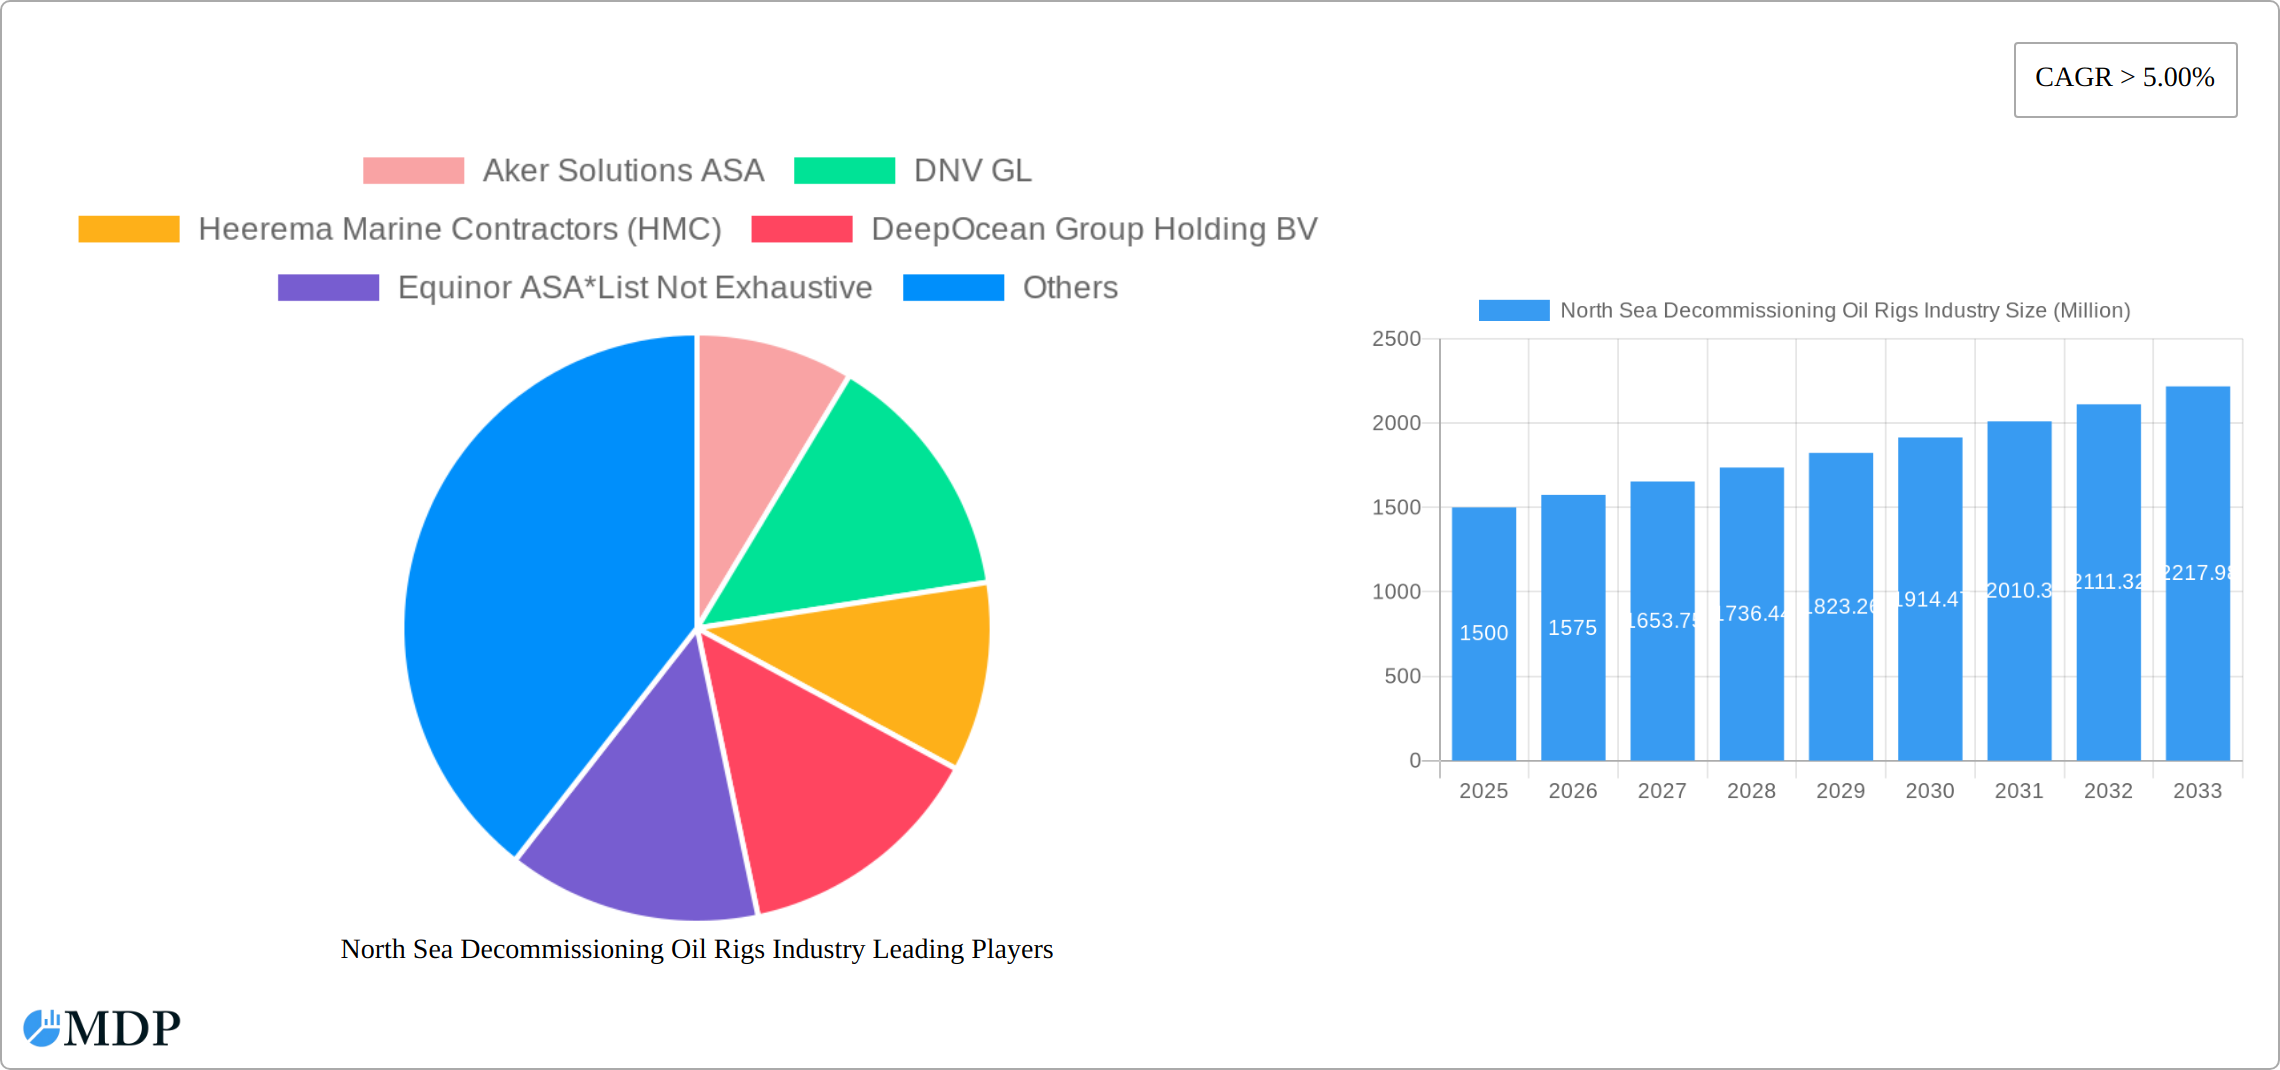
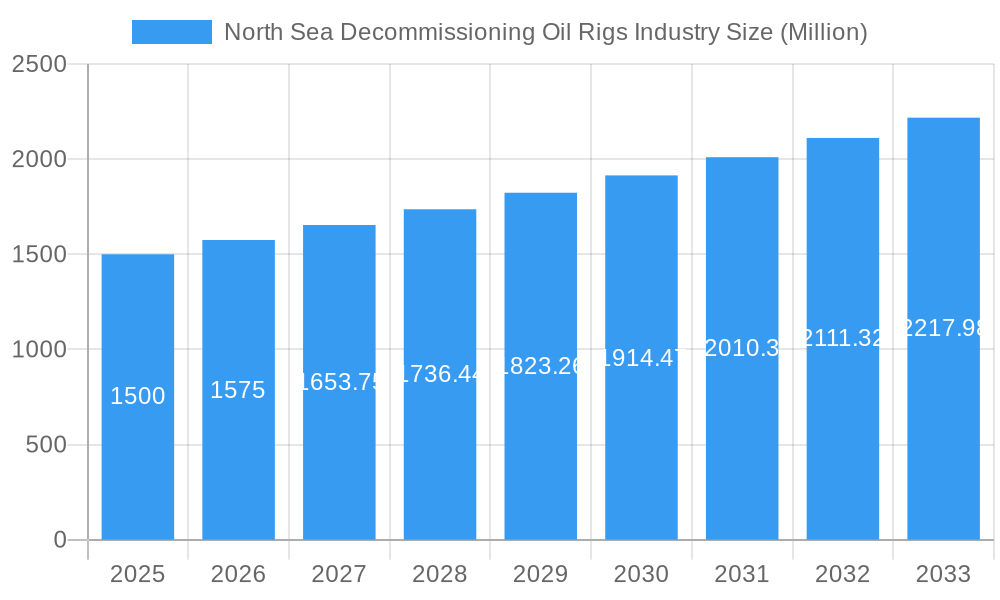
North Sea Decommissioning Oil Rigs Industry Market Size (In Billion)
The forecast period (2025-2033) is expected to witness significant investment in new technologies and techniques, including improved recycling and repurposing of decommissioned materials. This trend will enhance efficiency, reduce environmental impact and create new market opportunities for specialized service providers. The market faces restraints, primarily in the form of high decommissioning costs, complex regulatory frameworks, and the inherent logistical challenges of operating in harsh offshore environments. However, the long-term outlook remains positive, fuelled by the continued need to address the legacy of existing offshore infrastructure while minimizing environmental consequences. The industry is ripe for innovation and investment, with opportunities emerging in areas such as advanced robotics, AI-driven planning and execution, and sustainable waste management solutions. Market participants are likely to focus on strategic partnerships, technology acquisition, and operational excellence to maintain a competitive edge in this expanding market.
North Sea Decommissioning Oil Rigs Industry Company Market Share
North Sea Decommissioning Oil Rigs Industry: A Comprehensive Market Report (2019-2033)
Unlock the lucrative opportunities and navigate the challenges of the North Sea decommissioning market with this in-depth analysis. This comprehensive report provides a detailed overview of the North Sea decommissioning oil rigs industry, encompassing market dynamics, trends, leading players, and future growth prospects from 2019 to 2033. The report leverages extensive research to offer actionable insights for industry stakeholders, including operators, contractors, and investors. With a focus on key segments like shallow, deep, and ultra-deepwater operations, this report provides a crucial roadmap for success in this evolving landscape. The base year for this report is 2025, with forecasts extending to 2033, and historical data covering 2019-2024. The total market value is predicted to reach xx Million by 2033.
North Sea Decommissioning Oil Rigs Industry Market Dynamics & Concentration
The North Sea decommissioning market exhibits a moderately concentrated structure, with several major players holding significant market share. Key players include Aker Solutions ASA, DNV GL, Heerema Marine Contractors (HMC), DeepOcean Group Holding BV, and Equinor ASA, among others. Market share dynamics are influenced by factors such as technological capabilities, operational expertise, and financial strength. The study period (2019-2024) witnessed xx M&A deals, indicating consolidation within the sector. Furthermore, stringent regulatory frameworks, including those related to environmental protection and safety, are major drivers shaping industry practices. Innovation in decommissioning technologies, such as robotic solutions and advanced recycling techniques, is also a significant factor. The industry witnesses continuous evolution in end-user demands (e.g., cost optimization, environmentally friendly solutions), necessitating continuous adaptation.
- Market Concentration: Moderately concentrated, with top 5 players holding approximately xx% market share in 2025 (estimated).
- M&A Activity: xx deals between 2019 and 2024.
- Regulatory Landscape: Stringent environmental regulations and safety standards driving industry practices.
- Innovation Drivers: Technological advancements in decommissioning technologies and recycling methods.
- End-User Trends: Growing demand for cost-effective and environmentally sustainable decommissioning solutions.
North Sea Decommissioning Oil Rigs Industry Industry Trends & Analysis
The North Sea decommissioning market is experiencing robust growth, driven by the aging infrastructure of oil and gas platforms and increasing regulatory pressures. The Compound Annual Growth Rate (CAGR) for the forecast period (2025-2033) is estimated at xx%, fueled by a substantial increase in decommissioning projects. Technological advancements, particularly in remotely operated vehicles (ROVs) and automated systems, are significantly improving efficiency and reducing costs. The market penetration of these advanced technologies is expected to reach xx% by 2033. Competitive dynamics are characterized by fierce competition among major players vying for market share through technological innovation, strategic partnerships, and operational excellence. Furthermore, shifting consumer preferences towards environmentally friendly solutions are influencing industry practices.
Leading Markets & Segments in North Sea Decommissioning Oil Rigs Industry
The North Sea decommissioning market is experiencing significant activity, with the deepwater segment leading the way due to the high concentration of aging platforms in deeper waters. This presents unique challenges requiring specialized expertise and advanced technologies. The UK remains the dominant market, benefiting from a well-established regulatory framework, extensive oil and gas infrastructure demanding decommissioning, and supportive government policies. Norway also represents a substantial market, with its own robust regulatory environment and considerable number of aging offshore installations.
Key Drivers for Deepwater Dominance:
- High concentration of aging platforms requiring decommissioning in challenging deepwater environments.
- Complex subsea infrastructure necessitating sophisticated decommissioning techniques and specialized remotely operated vehicles (ROVs) and autonomous underwater vehicles (AUVs).
- Significant capital investment by operators and governments in innovative decommissioning technologies and infrastructure to mitigate environmental risks and improve efficiency.
- Stringent environmental regulations driving the adoption of sustainable decommissioning practices.
UK & Norway Market Leadership:
- Established regulatory frameworks and well-defined decommissioning procedures that ensure compliance and environmental protection.
- Extensive legacy oil and gas infrastructure requiring significant decommissioning efforts, creating a large market opportunity.
- Government incentives, funding schemes, and tax benefits supporting decommissioning projects and stimulating investment in innovative technologies.
- A skilled workforce and a robust supply chain supporting decommissioning activities.
North Sea Decommissioning Oil Rigs Industry Product Developments
The North Sea decommissioning industry is witnessing rapid technological advancements. Remotely operated vehicles (ROVs), autonomous underwater vehicles (AUVs), and advanced robotics are improving efficiency, enhancing safety, and minimizing environmental impact. These innovations, coupled with the development of sophisticated data analytics and improved recycling technologies for platform components, are streamlining decommissioning processes and reducing overall costs. The market is increasingly focused on integrated decommissioning solutions, offering comprehensive services ranging from initial planning and project management to final site restoration and disposal, creating efficiencies and minimizing risk for operators.
Key Drivers of North Sea Decommissioning Oil Rigs Industry Growth
Several factors contribute to market growth, including the increasing number of aging platforms requiring decommissioning, stringent environmental regulations, and technological advancements that improve efficiency and reduce costs. Government initiatives and funding schemes are further stimulating market expansion.
Challenges in the North Sea Decommissioning Oil Rigs Industry Market
Despite the significant opportunities, the North Sea decommissioning market faces considerable challenges. High decommissioning costs remain a major hurdle, alongside complex regulatory requirements, potential supply chain bottlenecks, and intense competition amongst service providers. These factors can impact project timelines and profitability. Furthermore, the industry needs to address skills gaps and attract and retain a skilled workforce to meet the demands of the growing decommissioning market. The total estimated cost for decommissioning projects in the North Sea is predicted to be in the billions over the coming decades.
Emerging Opportunities in North Sea Decommissioning Oil Rigs Industry
Despite the challenges, significant long-term growth opportunities exist. Technological breakthroughs in robotic solutions, advanced recycling methods (including the development of circular economy models for materials reuse), and the application of data analytics for improved planning and efficiency are key drivers. Strategic partnerships and collaborations between operators, service providers, and technology developers are crucial for optimizing decommissioning strategies and sharing best practices. Expansion into new geographical areas with aging offshore infrastructure, both within the North Sea and potentially in other regions, will further fuel market growth. The development of innovative financing models to reduce the upfront cost burden for operators is also an important area of focus.
Leading Players in the North Sea Decommissioning Oil Rigs Industry Sector
Key Milestones in North Sea Decommissioning Oil Rigs Industry Industry
- 2020: Introduction of stricter environmental regulations, pushing for more sustainable decommissioning practices and technological innovation.
- 2022: Successful deployment of a new automated decommissioning technology by a leading contractor, significantly improving efficiency and safety.
- 2023: Major mergers and acquisitions (M&A) activity amongst key players, leading to market consolidation and increased industry concentration.
- 2024: Launch of a significant government-funded decommissioning initiative, providing crucial financial support and stimulating further technological development.
- Ongoing: Continuous development and refinement of regulatory frameworks to balance environmental protection with economic viability.
Strategic Outlook for North Sea Decommissioning Oil Rigs Industry Market
The North Sea decommissioning market presents a significant long-term growth opportunity, driven by technological advancements, increasing regulatory pressure, and substantial investment. Companies adopting innovative strategies and leveraging strategic partnerships are poised for significant success in this evolving market. The market's future hinges on adapting to sustainable practices, optimizing decommissioning processes, and embracing technological innovation.
North Sea Decommissioning Oil Rigs Industry Segmentation
-
1. Water Depth
- 1.1. Shallow Water
- 1.2. Deepwater and Ultra-deepwater
-
2. Geography
- 2.1. United Kingdom
- 2.2. Norway
- 2.3. Rest of North Sea
North Sea Decommissioning Oil Rigs Industry Segmentation By Geography
- 1. United Kingdom
- 2. Norway
- 3. Rest of North Sea
North Sea Decommissioning Oil Rigs Industry Regional Market Share
Geographic Coverage of North Sea Decommissioning Oil Rigs Industry
North Sea Decommissioning Oil Rigs Industry REPORT HIGHLIGHTS
| Aspects | Details |
|---|---|
| Study Period | 2020-2034 |
| Base Year | 2025 |
| Estimated Year | 2026 |
| Forecast Period | 2026-2034 |
| Historical Period | 2020-2025 |
| Growth Rate | CAGR of 8.2% from 2020-2034 |
| Segmentation |
|
Table of Contents
- 1. Introduction
- 1.1. Research Scope
- 1.2. Market Segmentation
- 1.3. Research Objective
- 1.4. Definitions and Assumptions
- 2. Executive Summary
- 2.1. Market Snapshot
- 3. Market Dynamics
- 3.1. Market Drivers
- 3.2. Market Restrains
- 3.3. Market Trends
- 3.4. Market Opportunities
- 4. Market Factor Analysis
- 4.1. Porters Five Forces
- 4.1.1. Bargaining Power of Suppliers
- 4.1.2. Bargaining Power of Buyers
- 4.1.3. Threat of New Entrants
- 4.1.4. Threat of Substitutes
- 4.1.5. Competitive Rivalry
- 4.2. PESTEL analysis
- 4.3. BCG Analysis
- 4.3.1. Stars (High Growth, High Market Share)
- 4.3.2. Cash Cows (Low Growth, High Market Share)
- 4.3.3. Question Mark (High Growth, Low Market Share)
- 4.3.4. Dogs (Low Growth, Low Market Share)
- 4.4. Ansoff Matrix Analysis
- 4.5. Supply Chain Analysis
- 4.6. Regulatory Landscape
- 4.7. Current Market Potential and Opportunity Assessment (TAM–SAM–SOM Framework)
- 4.8. MDP Analyst Note
- 4.1. Porters Five Forces
- 5. Market Analysis, Insights and Forecast 2021-2033
- 5.1. Market Analysis, Insights and Forecast - by Water Depth
- 5.1.1. Shallow Water
- 5.1.2. Deepwater and Ultra-deepwater
- 5.2. Market Analysis, Insights and Forecast - by Geography
- 5.2.1. United Kingdom
- 5.2.2. Norway
- 5.2.3. Rest of North Sea
- 5.3. Market Analysis, Insights and Forecast - by Region
- 5.3.1. United Kingdom
- 5.3.2. Norway
- 5.3.3. Rest of North Sea
- 5.1. Market Analysis, Insights and Forecast - by Water Depth
- 6. Global North Sea Decommissioning Oil Rigs Industry Analysis, Insights and Forecast, 2021-2033
- 6.1. Market Analysis, Insights and Forecast - by Water Depth
- 6.1.1. Shallow Water
- 6.1.2. Deepwater and Ultra-deepwater
- 6.2. Market Analysis, Insights and Forecast - by Geography
- 6.2.1. United Kingdom
- 6.2.2. Norway
- 6.2.3. Rest of North Sea
- 6.1. Market Analysis, Insights and Forecast - by Water Depth
- 7. United Kingdom North Sea Decommissioning Oil Rigs Industry Analysis, Insights and Forecast, 2020-2032
- 7.1. Market Analysis, Insights and Forecast - by Water Depth
- 7.1.1. Shallow Water
- 7.1.2. Deepwater and Ultra-deepwater
- 7.2. Market Analysis, Insights and Forecast - by Geography
- 7.2.1. United Kingdom
- 7.2.2. Norway
- 7.2.3. Rest of North Sea
- 7.1. Market Analysis, Insights and Forecast - by Water Depth
- 8. Norway North Sea Decommissioning Oil Rigs Industry Analysis, Insights and Forecast, 2020-2032
- 8.1. Market Analysis, Insights and Forecast - by Water Depth
- 8.1.1. Shallow Water
- 8.1.2. Deepwater and Ultra-deepwater
- 8.2. Market Analysis, Insights and Forecast - by Geography
- 8.2.1. United Kingdom
- 8.2.2. Norway
- 8.2.3. Rest of North Sea
- 8.1. Market Analysis, Insights and Forecast - by Water Depth
- 9. Rest of North Sea North Sea Decommissioning Oil Rigs Industry Analysis, Insights and Forecast, 2020-2032
- 9.1. Market Analysis, Insights and Forecast - by Water Depth
- 9.1.1. Shallow Water
- 9.1.2. Deepwater and Ultra-deepwater
- 9.2. Market Analysis, Insights and Forecast - by Geography
- 9.2.1. United Kingdom
- 9.2.2. Norway
- 9.2.3. Rest of North Sea
- 9.1. Market Analysis, Insights and Forecast - by Water Depth
- 10. Competitive Analysis
- 10.1. Company Profiles
- 10.1.1 Aker Solutions ASA
- 10.1.1.1. Company Overview
- 10.1.1.2. Products
- 10.1.1.3. Company Financials
- 10.1.1.4. SWOT Analysis
- 10.1.2 DNV GL
- 10.1.2.1. Company Overview
- 10.1.2.2. Products
- 10.1.2.3. Company Financials
- 10.1.2.4. SWOT Analysis
- 10.1.3 Heerema Marine Contractors (HMC)
- 10.1.3.1. Company Overview
- 10.1.3.2. Products
- 10.1.3.3. Company Financials
- 10.1.3.4. SWOT Analysis
- 10.1.4 DeepOcean Group Holding BV
- 10.1.4.1. Company Overview
- 10.1.4.2. Products
- 10.1.4.3. Company Financials
- 10.1.4.4. SWOT Analysis
- 10.1.5 Equinor ASA*List Not Exhaustive
- 10.1.5.1. Company Overview
- 10.1.5.2. Products
- 10.1.5.3. Company Financials
- 10.1.5.4. SWOT Analysis
- 10.1.6 Able UK
- 10.1.6.1. Company Overview
- 10.1.6.2. Products
- 10.1.6.3. Company Financials
- 10.1.6.4. SWOT Analysis
- 10.1.7 John Wood Group PLC
- 10.1.7.1. Company Overview
- 10.1.7.2. Products
- 10.1.7.3. Company Financials
- 10.1.7.4. SWOT Analysis
- 10.1.8 TechnipFMC PLC
- 10.1.8.1. Company Overview
- 10.1.8.2. Products
- 10.1.8.3. Company Financials
- 10.1.8.4. SWOT Analysis
- 10.1.9 AF Gruppen SA
- 10.1.9.1. Company Overview
- 10.1.9.2. Products
- 10.1.9.3. Company Financials
- 10.1.9.4. SWOT Analysis
- 10.1.10 Allseas Group
- 10.1.10.1. Company Overview
- 10.1.10.2. Products
- 10.1.10.3. Company Financials
- 10.1.10.4. SWOT Analysis
- 10.1.1 Aker Solutions ASA
- 10.2. Market Entropy
- 10.2.1 Company's Key Areas Served
- 10.2.2 Recent Developments
- 10.3. Company Market Share Analysis 2025
- 10.3.1 Top 5 Companies Market Share Analysis
- 10.3.2 Top 3 Companies Market Share Analysis
- 10.4. List of Potential Customers
- 11. Research Methodology
List of Figures
- Figure 1: Global North Sea Decommissioning Oil Rigs Industry Revenue Breakdown (undefined, %) by Region 2025 & 2033
- Figure 2: United Kingdom North Sea Decommissioning Oil Rigs Industry Revenue (undefined), by Water Depth 2025 & 2033
- Figure 3: United Kingdom North Sea Decommissioning Oil Rigs Industry Revenue Share (%), by Water Depth 2025 & 2033
- Figure 4: United Kingdom North Sea Decommissioning Oil Rigs Industry Revenue (undefined), by Geography 2025 & 2033
- Figure 5: United Kingdom North Sea Decommissioning Oil Rigs Industry Revenue Share (%), by Geography 2025 & 2033
- Figure 6: United Kingdom North Sea Decommissioning Oil Rigs Industry Revenue (undefined), by Country 2025 & 2033
- Figure 7: United Kingdom North Sea Decommissioning Oil Rigs Industry Revenue Share (%), by Country 2025 & 2033
- Figure 8: Norway North Sea Decommissioning Oil Rigs Industry Revenue (undefined), by Water Depth 2025 & 2033
- Figure 9: Norway North Sea Decommissioning Oil Rigs Industry Revenue Share (%), by Water Depth 2025 & 2033
- Figure 10: Norway North Sea Decommissioning Oil Rigs Industry Revenue (undefined), by Geography 2025 & 2033
- Figure 11: Norway North Sea Decommissioning Oil Rigs Industry Revenue Share (%), by Geography 2025 & 2033
- Figure 12: Norway North Sea Decommissioning Oil Rigs Industry Revenue (undefined), by Country 2025 & 2033
- Figure 13: Norway North Sea Decommissioning Oil Rigs Industry Revenue Share (%), by Country 2025 & 2033
- Figure 14: Rest of North Sea North Sea Decommissioning Oil Rigs Industry Revenue (undefined), by Water Depth 2025 & 2033
- Figure 15: Rest of North Sea North Sea Decommissioning Oil Rigs Industry Revenue Share (%), by Water Depth 2025 & 2033
- Figure 16: Rest of North Sea North Sea Decommissioning Oil Rigs Industry Revenue (undefined), by Geography 2025 & 2033
- Figure 17: Rest of North Sea North Sea Decommissioning Oil Rigs Industry Revenue Share (%), by Geography 2025 & 2033
- Figure 18: Rest of North Sea North Sea Decommissioning Oil Rigs Industry Revenue (undefined), by Country 2025 & 2033
- Figure 19: Rest of North Sea North Sea Decommissioning Oil Rigs Industry Revenue Share (%), by Country 2025 & 2033
List of Tables
- Table 1: Global North Sea Decommissioning Oil Rigs Industry Revenue undefined Forecast, by Water Depth 2020 & 2033
- Table 2: Global North Sea Decommissioning Oil Rigs Industry Revenue undefined Forecast, by Geography 2020 & 2033
- Table 3: Global North Sea Decommissioning Oil Rigs Industry Revenue undefined Forecast, by Region 2020 & 2033
- Table 4: Global North Sea Decommissioning Oil Rigs Industry Revenue undefined Forecast, by Water Depth 2020 & 2033
- Table 5: Global North Sea Decommissioning Oil Rigs Industry Revenue undefined Forecast, by Geography 2020 & 2033
- Table 6: Global North Sea Decommissioning Oil Rigs Industry Revenue undefined Forecast, by Country 2020 & 2033
- Table 7: Global North Sea Decommissioning Oil Rigs Industry Revenue undefined Forecast, by Water Depth 2020 & 2033
- Table 8: Global North Sea Decommissioning Oil Rigs Industry Revenue undefined Forecast, by Geography 2020 & 2033
- Table 9: Global North Sea Decommissioning Oil Rigs Industry Revenue undefined Forecast, by Country 2020 & 2033
- Table 10: Global North Sea Decommissioning Oil Rigs Industry Revenue undefined Forecast, by Water Depth 2020 & 2033
- Table 11: Global North Sea Decommissioning Oil Rigs Industry Revenue undefined Forecast, by Geography 2020 & 2033
- Table 12: Global North Sea Decommissioning Oil Rigs Industry Revenue undefined Forecast, by Country 2020 & 2033
Frequently Asked Questions
1. What is the projected Compound Annual Growth Rate (CAGR) of the North Sea Decommissioning Oil Rigs Industry?
The projected CAGR is approximately 8.2%.
2. Which companies are prominent players in the North Sea Decommissioning Oil Rigs Industry?
Key companies in the market include Aker Solutions ASA, DNV GL, Heerema Marine Contractors (HMC), DeepOcean Group Holding BV, Equinor ASA*List Not Exhaustive, Able UK, John Wood Group PLC, TechnipFMC PLC, AF Gruppen SA, Allseas Group.
3. What are the main segments of the North Sea Decommissioning Oil Rigs Industry?
The market segments include Water Depth, Geography.
4. Can you provide details about the market size?
The market size is estimated to be USD XXX N/A as of 2022.
5. What are some drivers contributing to market growth?
4.; Increasing Demand for Secure. Sustainable. and Clean Energy.
6. What are the notable trends driving market growth?
Shallow Water to Dominate the Market.
7. Are there any restraints impacting market growth?
4.; High Cost of Production of Biofuels.
8. Can you provide examples of recent developments in the market?
N/A
9. What pricing options are available for accessing the report?
Pricing options include single-user, multi-user, and enterprise licenses priced at USD 4750, USD 5250, and USD 8750 respectively.
10. Is the market size provided in terms of value or volume?
The market size is provided in terms of value, measured in N/A.
11. Are there any specific market keywords associated with the report?
Yes, the market keyword associated with the report is "North Sea Decommissioning Oil Rigs Industry," which aids in identifying and referencing the specific market segment covered.
12. How do I determine which pricing option suits my needs best?
The pricing options vary based on user requirements and access needs. Individual users may opt for single-user licenses, while businesses requiring broader access may choose multi-user or enterprise licenses for cost-effective access to the report.
13. Are there any additional resources or data provided in the North Sea Decommissioning Oil Rigs Industry report?
While the report offers comprehensive insights, it's advisable to review the specific contents or supplementary materials provided to ascertain if additional resources or data are available.
14. How can I stay updated on further developments or reports in the North Sea Decommissioning Oil Rigs Industry?
To stay informed about further developments, trends, and reports in the North Sea Decommissioning Oil Rigs Industry, consider subscribing to industry newsletters, following relevant companies and organizations, or regularly checking reputable industry news sources and publications.
Methodology
Step 1 - Identification of Relevant Samples Size from Population Database


Step 2 - Approaches for Defining Global Market Size (Value, Volume* & Price*)

Note*: In applicable scenarios
Step 3 - Data Sources
Primary Research
- Web Analytics
- Survey Reports
- Research Institute
- Latest Research Reports
- Opinion Leaders
Secondary Research
- Annual Reports
- White Paper
- Latest Press Release
- Industry Association
- Paid Database
- Investor Presentations

Step 4 - Data Triangulation
Involves using different sources of information in order to increase the validity of a study
These sources are likely to be stakeholders in a program - participants, other researchers, program staff, other community members, and so on.
Then we put all data in single framework & apply various statistical tools to find out the dynamic on the market.
During the analysis stage, feedback from the stakeholder groups would be compared to determine areas of agreement as well as areas of divergence