

Key Insights
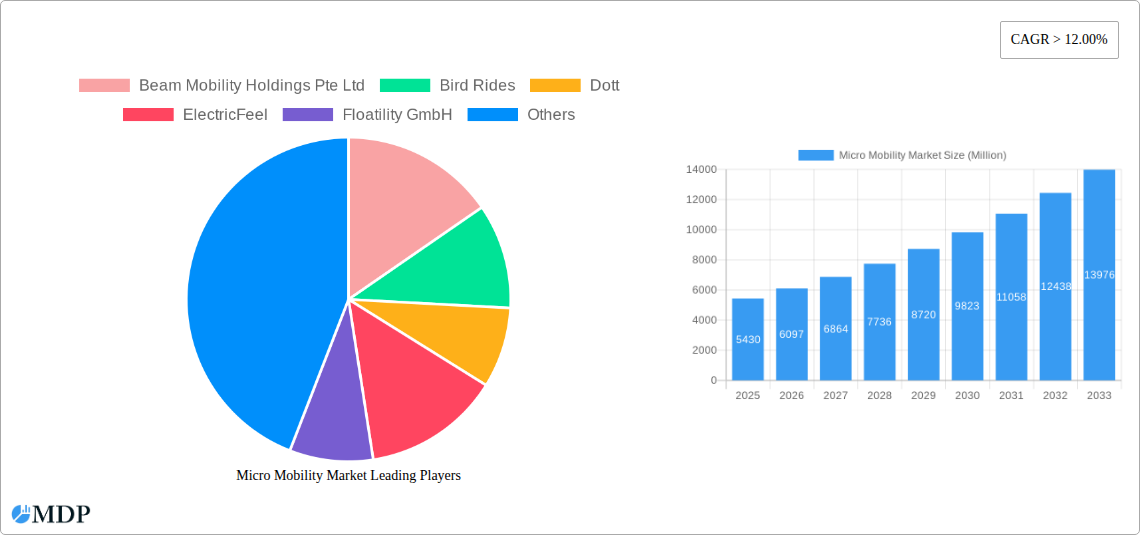
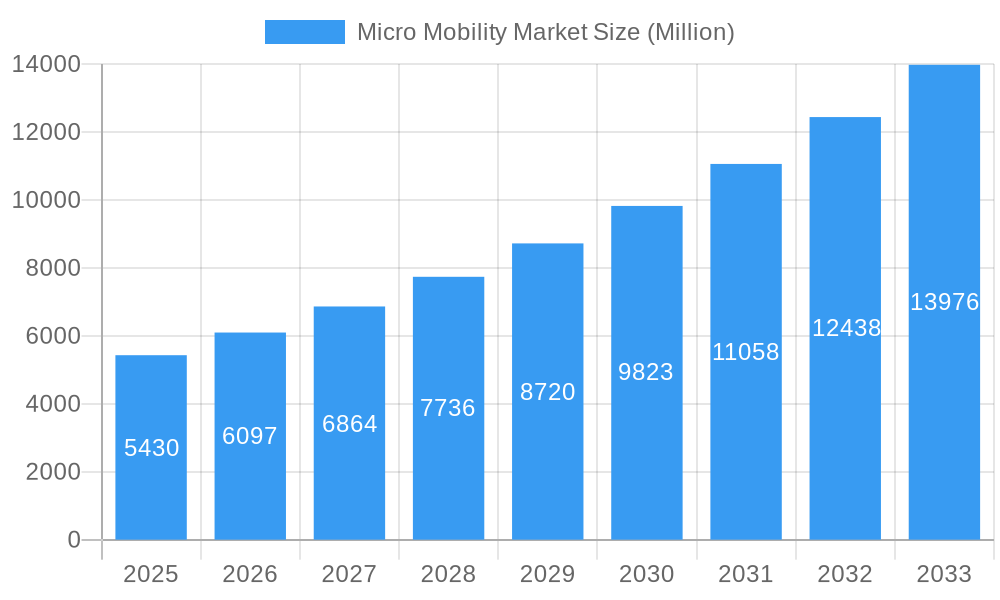
The micro-mobility market, encompassing shared e-scooters, e-bikes, and other lightweight personal electric vehicles, is experiencing robust growth, projected to reach a market size of $5.43 billion in 2025 and maintain a Compound Annual Growth Rate (CAGR) exceeding 12% through 2033. This expansion is fueled by several key drivers. Increasing urbanization and traffic congestion in major cities are pushing consumers to seek efficient and sustainable last-mile transportation solutions. Government initiatives promoting eco-friendly transportation and reducing carbon emissions are further stimulating market adoption. Technological advancements, such as improved battery technology and enhanced safety features, are also contributing to the market's growth trajectory. The rise of subscription models and integrated mobile apps for convenient access further enhance user experience and market appeal. Competition among major players like Bird, Lime, and Voi is driving innovation and fostering market expansion.
Micro Mobility Market Market Size (In Billion)
However, the market also faces challenges. Regulatory hurdles, varying from city to city, concerning operational permits, parking regulations, and safety standards, represent significant constraints. Concerns about rider safety, including accidents and injuries, need to be addressed through improved infrastructure and public awareness campaigns. The impact of fluctuating energy prices on operational costs and the seasonal nature of demand in some regions also influence the market's growth trajectory. Despite these challenges, the long-term outlook for the micro-mobility market remains positive, driven by ongoing urbanization, technological improvements, and a growing preference for sustainable transportation options. The market is poised for significant expansion, particularly in developing economies and regions with robust public transportation systems that benefit from efficient last-mile connectivity. The segment breakdown will likely favor e-scooters initially due to their lower price point and accessibility, though e-bikes will see increasing adoption as technology and infrastructure improve.
Micro Mobility Market Company Market Share
Micro Mobility Market Report: 2019-2033 - Unlocking the Potential of Urban Mobility
This comprehensive report provides an in-depth analysis of the Micro Mobility Market, encompassing market dynamics, industry trends, leading players, and future growth prospects. Covering the period from 2019 to 2033, with a focus on 2025, this report is an essential resource for industry stakeholders, investors, and strategic decision-makers seeking actionable insights into this rapidly evolving sector. The global Micro Mobility Market is projected to reach USD xx Million by 2033, exhibiting a CAGR of xx% during the forecast period (2025-2033).
Micro Mobility Market Market Dynamics & Concentration
The Micro Mobility Market is characterized by a dynamic interplay of factors influencing its growth and concentration. Market concentration is currently [Insert Market Concentration Metric, e.g., moderately high, with the top 5 players holding xx% market share in 2024]. Innovation plays a crucial role, with continuous advancements in battery technology, smart features, and vehicle design driving market expansion. Regulatory frameworks, varying significantly across regions, present both opportunities and challenges. The emergence of alternative transportation modes, like improved public transit or ride-sharing services, represents a key product substitute, while evolving consumer preferences towards sustainable and convenient transportation are fueling demand. Significant M&A activity, as evidenced by recent deals like Bird's acquisition of Spin, further shapes the competitive landscape.
- Market Share (2024): [Insert estimated market share data for top players, e.g., Lime: xx%, Bird: xx%, Voi: xx%]
- M&A Deal Count (2019-2024): xx
- Key Innovation Drivers: Improved battery technology, enhanced safety features, integration with smart city infrastructure.
- Regulatory Landscape: Varies significantly across regions, impacting adoption rates.
Micro Mobility Market Industry Trends & Analysis
The Micro Mobility Market is experiencing robust growth, driven by several key factors. The increasing urbanization and traffic congestion in major cities worldwide are compelling consumers to seek alternative transportation solutions. Technological advancements, including the development of longer-lasting batteries and improved safety mechanisms, are enhancing the appeal and practicality of micro-mobility vehicles. Consumer preferences are shifting towards sustainable and convenient transportation options, with e-scooters and e-bikes becoming increasingly popular. The competitive dynamics are intense, with established players and new entrants vying for market share through strategic partnerships, technological innovation, and aggressive expansion strategies. The market penetration of micro-mobility vehicles in urban areas is estimated at xx% in 2025, projected to increase to xx% by 2033.
Leading Markets & Segments in Micro Mobility Market
[Dominant Region/Country]: [Insert Dominant Region/Country, e.g., North America] holds the largest market share in the global micro-mobility market, driven by factors such as:
- Strong consumer adoption: High levels of disposable income and a preference for convenient transportation.
- Favorable regulatory environment: Supportive policies and investments in cycling infrastructure.
- Technological advancements: A high concentration of technology companies driving innovation.
[Further detailed analysis of dominant region/country’s market, including market size and growth projections]. Similarly, [Insert dominant segment, e.g., e-scooter] segment demonstrates significant growth potential due to its affordability and convenience.
Micro Mobility Market Product Developments
Recent product innovations focus on enhanced safety features, such as improved braking systems and enhanced lighting, longer battery life, and more comfortable and durable designs. Integration with smart city infrastructure and mobile applications is also a key trend, enhancing user experience and enabling better fleet management. These innovations are crucial for expanding market adoption and improving the overall user experience, thus driving market growth.
Key Drivers of Micro Mobility Market Growth
Several factors contribute to the robust growth of the Micro Mobility Market. Technological advancements leading to longer battery life, improved safety features, and enhanced user experience are paramount. Government initiatives promoting sustainable transportation and investments in cycling infrastructure create a favorable environment. Rising fuel costs and increasing concerns about environmental sustainability further drive the adoption of these eco-friendly alternatives.
Challenges in the Micro Mobility Market Market
Despite the positive outlook, the Micro Mobility Market faces significant challenges. Regulatory hurdles, including permitting requirements and operational restrictions, can hinder market expansion. Supply chain disruptions can affect the availability of components, impacting production and potentially increasing costs. Intense competition among numerous players necessitates continuous innovation and strategic investments to maintain a competitive edge. These factors could potentially impact the overall market growth trajectory.
Emerging Opportunities in Micro Mobility Market
The Micro Mobility Market presents significant long-term growth potential. The continuous evolution of battery technology promises to address range anxiety, while advancements in shared mobility platforms improve user accessibility and fleet management. Strategic partnerships between micro-mobility providers and city authorities can facilitate seamless integration into urban transportation networks, expanding market reach and enhancing user experience. Expansion into new markets and segments, coupled with technological advancements, will open up new revenue streams and unlock substantial growth opportunities.
Leading Players in the Micro Mobility Market Sector
- Beam Mobility Holdings Pte Ltd
- Bird Rides
- Dott
- ElectricFeel
- Floatility GmbH
- Lime
- Yulu Bikes Pvt Ltd
- Voi
- Superpedestrian Inc
Key Milestones in Micro Mobility Market Industry
- March 2023: Voi Technology secured an additional USD 22.8 Million in funding to expand its e-scooter services across Europe.
- September 2023: Bird acquired Spin from Tier Mobility for USD 19 Million, expanding its market presence and operational capabilities.
Strategic Outlook for Micro Mobility Market Market
The future of the Micro Mobility Market is bright. Continued technological innovation, strategic partnerships, and expansion into new markets will fuel significant growth. Addressing regulatory challenges and optimizing operational efficiency will be crucial for long-term success. The market holds immense potential for sustainable and convenient urban mobility solutions, attracting substantial investments and shaping the future of urban transportation.
Micro Mobility Market Segmentation
-
1. Vehicle Type
- 1.1. Electric Kick Scooters
- 1.2. Electric Mopeds
- 1.3. Electric Bicycles
-
2. Battery
- 2.1. Sealed Lead Acid
- 2.2. NiMH
- 2.3. Li-ion
-
3. Voltage
- 3.1. Below 24V
- 3.2. 36V
- 3.3. 48V
- 3.4. Greater than 48V
-
4. Sharing Type
- 4.1. Docked
- 4.2. Dockless
Micro Mobility Market Segmentation By Geography
-
1. North America
- 1.1. United States
- 1.2. Canada
- 1.3. Rest of North America
-
2. Europe
- 2.1. Germany
- 2.2. United Kingdom
- 2.3. France
- 2.4. Italy
- 2.5. Spain
- 2.6. Rest of Europe
-
3. Asia Pacific
- 3.1. China
- 3.2. Japan
- 3.3. India
- 3.4. South Korea
- 3.5. Rest of Asia Pacific
-
4. Rest of the World
- 4.1. South America
- 4.2. Middle East and Africa

Micro Mobility Market Regional Market Share
Geographic Coverage of Micro Mobility Market
Micro Mobility Market REPORT HIGHLIGHTS
| Aspects | Details |
|---|---|
| Study Period | 2020-2034 |
| Base Year | 2025 |
| Estimated Year | 2026 |
| Forecast Period | 2026-2034 |
| Historical Period | 2020-2025 |
| Growth Rate | CAGR of > 12.00% from 2020-2034 |
| Segmentation |
|
Table of Contents
- 1. Introduction
- 1.1. Research Scope
- 1.2. Market Segmentation
- 1.3. Research Objective
- 1.4. Definitions and Assumptions
- 2. Executive Summary
- 2.1. Market Snapshot
- 3. Market Dynamics
- 3.1. Market Drivers
- 3.2. Market Restrains
- 3.3. Market Trends
- 3.4. Market Opportunities
- 4. Market Factor Analysis
- 4.1. Porters Five Forces
- 4.1.1. Bargaining Power of Suppliers
- 4.1.2. Bargaining Power of Buyers
- 4.1.3. Threat of New Entrants
- 4.1.4. Threat of Substitutes
- 4.1.5. Competitive Rivalry
- 4.2. PESTEL analysis
- 4.3. BCG Analysis
- 4.3.1. Stars (High Growth, High Market Share)
- 4.3.2. Cash Cows (Low Growth, High Market Share)
- 4.3.3. Question Mark (High Growth, Low Market Share)
- 4.3.4. Dogs (Low Growth, Low Market Share)
- 4.4. Ansoff Matrix Analysis
- 4.5. Supply Chain Analysis
- 4.6. Regulatory Landscape
- 4.7. Current Market Potential and Opportunity Assessment (TAM–SAM–SOM Framework)
- 4.8. MDP Analyst Note
- 4.1. Porters Five Forces
- 5. Market Analysis, Insights and Forecast 2021-2033
- 5.1. Market Analysis, Insights and Forecast - by Vehicle Type
- 5.1.1. Electric Kick Scooters
- 5.1.2. Electric Mopeds
- 5.1.3. Electric Bicycles
- 5.2. Market Analysis, Insights and Forecast - by Battery
- 5.2.1. Sealed Lead Acid
- 5.2.2. NiMH
- 5.2.3. Li-ion
- 5.3. Market Analysis, Insights and Forecast - by Voltage
- 5.3.1. Below 24V
- 5.3.2. 36V
- 5.3.3. 48V
- 5.3.4. Greater than 48V
- 5.4. Market Analysis, Insights and Forecast - by Sharing Type
- 5.4.1. Docked
- 5.4.2. Dockless
- 5.5. Market Analysis, Insights and Forecast - by Region
- 5.5.1. North America
- 5.5.2. Europe
- 5.5.3. Asia Pacific
- 5.5.4. Rest of the World
- 5.1. Market Analysis, Insights and Forecast - by Vehicle Type
- 6. Global Micro Mobility Market Analysis, Insights and Forecast, 2021-2033
- 6.1. Market Analysis, Insights and Forecast - by Vehicle Type
- 6.1.1. Electric Kick Scooters
- 6.1.2. Electric Mopeds
- 6.1.3. Electric Bicycles
- 6.2. Market Analysis, Insights and Forecast - by Battery
- 6.2.1. Sealed Lead Acid
- 6.2.2. NiMH
- 6.2.3. Li-ion
- 6.3. Market Analysis, Insights and Forecast - by Voltage
- 6.3.1. Below 24V
- 6.3.2. 36V
- 6.3.3. 48V
- 6.3.4. Greater than 48V
- 6.4. Market Analysis, Insights and Forecast - by Sharing Type
- 6.4.1. Docked
- 6.4.2. Dockless
- 6.1. Market Analysis, Insights and Forecast - by Vehicle Type
- 7. North America Micro Mobility Market Analysis, Insights and Forecast, 2020-2032
- 7.1. Market Analysis, Insights and Forecast - by Vehicle Type
- 7.1.1. Electric Kick Scooters
- 7.1.2. Electric Mopeds
- 7.1.3. Electric Bicycles
- 7.2. Market Analysis, Insights and Forecast - by Battery
- 7.2.1. Sealed Lead Acid
- 7.2.2. NiMH
- 7.2.3. Li-ion
- 7.3. Market Analysis, Insights and Forecast - by Voltage
- 7.3.1. Below 24V
- 7.3.2. 36V
- 7.3.3. 48V
- 7.3.4. Greater than 48V
- 7.4. Market Analysis, Insights and Forecast - by Sharing Type
- 7.4.1. Docked
- 7.4.2. Dockless
- 7.1. Market Analysis, Insights and Forecast - by Vehicle Type
- 8. Europe Micro Mobility Market Analysis, Insights and Forecast, 2020-2032
- 8.1. Market Analysis, Insights and Forecast - by Vehicle Type
- 8.1.1. Electric Kick Scooters
- 8.1.2. Electric Mopeds
- 8.1.3. Electric Bicycles
- 8.2. Market Analysis, Insights and Forecast - by Battery
- 8.2.1. Sealed Lead Acid
- 8.2.2. NiMH
- 8.2.3. Li-ion
- 8.3. Market Analysis, Insights and Forecast - by Voltage
- 8.3.1. Below 24V
- 8.3.2. 36V
- 8.3.3. 48V
- 8.3.4. Greater than 48V
- 8.4. Market Analysis, Insights and Forecast - by Sharing Type
- 8.4.1. Docked
- 8.4.2. Dockless
- 8.1. Market Analysis, Insights and Forecast - by Vehicle Type
- 9. Asia Pacific Micro Mobility Market Analysis, Insights and Forecast, 2020-2032
- 9.1. Market Analysis, Insights and Forecast - by Vehicle Type
- 9.1.1. Electric Kick Scooters
- 9.1.2. Electric Mopeds
- 9.1.3. Electric Bicycles
- 9.2. Market Analysis, Insights and Forecast - by Battery
- 9.2.1. Sealed Lead Acid
- 9.2.2. NiMH
- 9.2.3. Li-ion
- 9.3. Market Analysis, Insights and Forecast - by Voltage
- 9.3.1. Below 24V
- 9.3.2. 36V
- 9.3.3. 48V
- 9.3.4. Greater than 48V
- 9.4. Market Analysis, Insights and Forecast - by Sharing Type
- 9.4.1. Docked
- 9.4.2. Dockless
- 9.1. Market Analysis, Insights and Forecast - by Vehicle Type
- 10. Rest of the World Micro Mobility Market Analysis, Insights and Forecast, 2020-2032
- 10.1. Market Analysis, Insights and Forecast - by Vehicle Type
- 10.1.1. Electric Kick Scooters
- 10.1.2. Electric Mopeds
- 10.1.3. Electric Bicycles
- 10.2. Market Analysis, Insights and Forecast - by Battery
- 10.2.1. Sealed Lead Acid
- 10.2.2. NiMH
- 10.2.3. Li-ion
- 10.3. Market Analysis, Insights and Forecast - by Voltage
- 10.3.1. Below 24V
- 10.3.2. 36V
- 10.3.3. 48V
- 10.3.4. Greater than 48V
- 10.4. Market Analysis, Insights and Forecast - by Sharing Type
- 10.4.1. Docked
- 10.4.2. Dockless
- 10.1. Market Analysis, Insights and Forecast - by Vehicle Type
- 11. Competitive Analysis
- 11.1. Company Profiles
- 11.1.1 Beam Mobility Holdings Pte Ltd
- 11.1.1.1. Company Overview
- 11.1.1.2. Products
- 11.1.1.3. Company Financials
- 11.1.1.4. SWOT Analysis
- 11.1.2 Bird Rides
- 11.1.2.1. Company Overview
- 11.1.2.2. Products
- 11.1.2.3. Company Financials
- 11.1.2.4. SWOT Analysis
- 11.1.3 Dott
- 11.1.3.1. Company Overview
- 11.1.3.2. Products
- 11.1.3.3. Company Financials
- 11.1.3.4. SWOT Analysis
- 11.1.4 ElectricFeel
- 11.1.4.1. Company Overview
- 11.1.4.2. Products
- 11.1.4.3. Company Financials
- 11.1.4.4. SWOT Analysis
- 11.1.5 Floatility GmbH
- 11.1.5.1. Company Overview
- 11.1.5.2. Products
- 11.1.5.3. Company Financials
- 11.1.5.4. SWOT Analysis
- 11.1.6 Lime
- 11.1.6.1. Company Overview
- 11.1.6.2. Products
- 11.1.6.3. Company Financials
- 11.1.6.4. SWOT Analysis
- 11.1.7 Yulu Bikes Pvt Ltd
- 11.1.7.1. Company Overview
- 11.1.7.2. Products
- 11.1.7.3. Company Financials
- 11.1.7.4. SWOT Analysis
- 11.1.8 Voi
- 11.1.8.1. Company Overview
- 11.1.8.2. Products
- 11.1.8.3. Company Financials
- 11.1.8.4. SWOT Analysis
- 11.1.9 Superpedestrian Inc
- 11.1.9.1. Company Overview
- 11.1.9.2. Products
- 11.1.9.3. Company Financials
- 11.1.9.4. SWOT Analysis
- 11.1.1 Beam Mobility Holdings Pte Ltd
- 11.2. Market Entropy
- 11.2.1 Company's Key Areas Served
- 11.2.2 Recent Developments
- 11.3. Company Market Share Analysis 2025
- 11.3.1 Top 5 Companies Market Share Analysis
- 11.3.2 Top 3 Companies Market Share Analysis
- 11.4. List of Potential Customers
- 12. Research Methodology
List of Figures
- Figure 1: Global Micro Mobility Market Revenue Breakdown (Million, %) by Region 2025 & 2033
- Figure 2: Global Micro Mobility Market Volume Breakdown (Billion, %) by Region 2025 & 2033
- Figure 3: North America Micro Mobility Market Revenue (Million), by Vehicle Type 2025 & 2033
- Figure 4: North America Micro Mobility Market Volume (Billion), by Vehicle Type 2025 & 2033
- Figure 5: North America Micro Mobility Market Revenue Share (%), by Vehicle Type 2025 & 2033
- Figure 6: North America Micro Mobility Market Volume Share (%), by Vehicle Type 2025 & 2033
- Figure 7: North America Micro Mobility Market Revenue (Million), by Battery 2025 & 2033
- Figure 8: North America Micro Mobility Market Volume (Billion), by Battery 2025 & 2033
- Figure 9: North America Micro Mobility Market Revenue Share (%), by Battery 2025 & 2033
- Figure 10: North America Micro Mobility Market Volume Share (%), by Battery 2025 & 2033
- Figure 11: North America Micro Mobility Market Revenue (Million), by Voltage 2025 & 2033
- Figure 12: North America Micro Mobility Market Volume (Billion), by Voltage 2025 & 2033
- Figure 13: North America Micro Mobility Market Revenue Share (%), by Voltage 2025 & 2033
- Figure 14: North America Micro Mobility Market Volume Share (%), by Voltage 2025 & 2033
- Figure 15: North America Micro Mobility Market Revenue (Million), by Sharing Type 2025 & 2033
- Figure 16: North America Micro Mobility Market Volume (Billion), by Sharing Type 2025 & 2033
- Figure 17: North America Micro Mobility Market Revenue Share (%), by Sharing Type 2025 & 2033
- Figure 18: North America Micro Mobility Market Volume Share (%), by Sharing Type 2025 & 2033
- Figure 19: North America Micro Mobility Market Revenue (Million), by Country 2025 & 2033
- Figure 20: North America Micro Mobility Market Volume (Billion), by Country 2025 & 2033
- Figure 21: North America Micro Mobility Market Revenue Share (%), by Country 2025 & 2033
- Figure 22: North America Micro Mobility Market Volume Share (%), by Country 2025 & 2033
- Figure 23: Europe Micro Mobility Market Revenue (Million), by Vehicle Type 2025 & 2033
- Figure 24: Europe Micro Mobility Market Volume (Billion), by Vehicle Type 2025 & 2033
- Figure 25: Europe Micro Mobility Market Revenue Share (%), by Vehicle Type 2025 & 2033
- Figure 26: Europe Micro Mobility Market Volume Share (%), by Vehicle Type 2025 & 2033
- Figure 27: Europe Micro Mobility Market Revenue (Million), by Battery 2025 & 2033
- Figure 28: Europe Micro Mobility Market Volume (Billion), by Battery 2025 & 2033
- Figure 29: Europe Micro Mobility Market Revenue Share (%), by Battery 2025 & 2033
- Figure 30: Europe Micro Mobility Market Volume Share (%), by Battery 2025 & 2033
- Figure 31: Europe Micro Mobility Market Revenue (Million), by Voltage 2025 & 2033
- Figure 32: Europe Micro Mobility Market Volume (Billion), by Voltage 2025 & 2033
- Figure 33: Europe Micro Mobility Market Revenue Share (%), by Voltage 2025 & 2033
- Figure 34: Europe Micro Mobility Market Volume Share (%), by Voltage 2025 & 2033
- Figure 35: Europe Micro Mobility Market Revenue (Million), by Sharing Type 2025 & 2033
- Figure 36: Europe Micro Mobility Market Volume (Billion), by Sharing Type 2025 & 2033
- Figure 37: Europe Micro Mobility Market Revenue Share (%), by Sharing Type 2025 & 2033
- Figure 38: Europe Micro Mobility Market Volume Share (%), by Sharing Type 2025 & 2033
- Figure 39: Europe Micro Mobility Market Revenue (Million), by Country 2025 & 2033
- Figure 40: Europe Micro Mobility Market Volume (Billion), by Country 2025 & 2033
- Figure 41: Europe Micro Mobility Market Revenue Share (%), by Country 2025 & 2033
- Figure 42: Europe Micro Mobility Market Volume Share (%), by Country 2025 & 2033
- Figure 43: Asia Pacific Micro Mobility Market Revenue (Million), by Vehicle Type 2025 & 2033
- Figure 44: Asia Pacific Micro Mobility Market Volume (Billion), by Vehicle Type 2025 & 2033
- Figure 45: Asia Pacific Micro Mobility Market Revenue Share (%), by Vehicle Type 2025 & 2033
- Figure 46: Asia Pacific Micro Mobility Market Volume Share (%), by Vehicle Type 2025 & 2033
- Figure 47: Asia Pacific Micro Mobility Market Revenue (Million), by Battery 2025 & 2033
- Figure 48: Asia Pacific Micro Mobility Market Volume (Billion), by Battery 2025 & 2033
- Figure 49: Asia Pacific Micro Mobility Market Revenue Share (%), by Battery 2025 & 2033
- Figure 50: Asia Pacific Micro Mobility Market Volume Share (%), by Battery 2025 & 2033
- Figure 51: Asia Pacific Micro Mobility Market Revenue (Million), by Voltage 2025 & 2033
- Figure 52: Asia Pacific Micro Mobility Market Volume (Billion), by Voltage 2025 & 2033
- Figure 53: Asia Pacific Micro Mobility Market Revenue Share (%), by Voltage 2025 & 2033
- Figure 54: Asia Pacific Micro Mobility Market Volume Share (%), by Voltage 2025 & 2033
- Figure 55: Asia Pacific Micro Mobility Market Revenue (Million), by Sharing Type 2025 & 2033
- Figure 56: Asia Pacific Micro Mobility Market Volume (Billion), by Sharing Type 2025 & 2033
- Figure 57: Asia Pacific Micro Mobility Market Revenue Share (%), by Sharing Type 2025 & 2033
- Figure 58: Asia Pacific Micro Mobility Market Volume Share (%), by Sharing Type 2025 & 2033
- Figure 59: Asia Pacific Micro Mobility Market Revenue (Million), by Country 2025 & 2033
- Figure 60: Asia Pacific Micro Mobility Market Volume (Billion), by Country 2025 & 2033
- Figure 61: Asia Pacific Micro Mobility Market Revenue Share (%), by Country 2025 & 2033
- Figure 62: Asia Pacific Micro Mobility Market Volume Share (%), by Country 2025 & 2033
- Figure 63: Rest of the World Micro Mobility Market Revenue (Million), by Vehicle Type 2025 & 2033
- Figure 64: Rest of the World Micro Mobility Market Volume (Billion), by Vehicle Type 2025 & 2033
- Figure 65: Rest of the World Micro Mobility Market Revenue Share (%), by Vehicle Type 2025 & 2033
- Figure 66: Rest of the World Micro Mobility Market Volume Share (%), by Vehicle Type 2025 & 2033
- Figure 67: Rest of the World Micro Mobility Market Revenue (Million), by Battery 2025 & 2033
- Figure 68: Rest of the World Micro Mobility Market Volume (Billion), by Battery 2025 & 2033
- Figure 69: Rest of the World Micro Mobility Market Revenue Share (%), by Battery 2025 & 2033
- Figure 70: Rest of the World Micro Mobility Market Volume Share (%), by Battery 2025 & 2033
- Figure 71: Rest of the World Micro Mobility Market Revenue (Million), by Voltage 2025 & 2033
- Figure 72: Rest of the World Micro Mobility Market Volume (Billion), by Voltage 2025 & 2033
- Figure 73: Rest of the World Micro Mobility Market Revenue Share (%), by Voltage 2025 & 2033
- Figure 74: Rest of the World Micro Mobility Market Volume Share (%), by Voltage 2025 & 2033
- Figure 75: Rest of the World Micro Mobility Market Revenue (Million), by Sharing Type 2025 & 2033
- Figure 76: Rest of the World Micro Mobility Market Volume (Billion), by Sharing Type 2025 & 2033
- Figure 77: Rest of the World Micro Mobility Market Revenue Share (%), by Sharing Type 2025 & 2033
- Figure 78: Rest of the World Micro Mobility Market Volume Share (%), by Sharing Type 2025 & 2033
- Figure 79: Rest of the World Micro Mobility Market Revenue (Million), by Country 2025 & 2033
- Figure 80: Rest of the World Micro Mobility Market Volume (Billion), by Country 2025 & 2033
- Figure 81: Rest of the World Micro Mobility Market Revenue Share (%), by Country 2025 & 2033
- Figure 82: Rest of the World Micro Mobility Market Volume Share (%), by Country 2025 & 2033
List of Tables
- Table 1: Global Micro Mobility Market Revenue Million Forecast, by Vehicle Type 2020 & 2033
- Table 2: Global Micro Mobility Market Volume Billion Forecast, by Vehicle Type 2020 & 2033
- Table 3: Global Micro Mobility Market Revenue Million Forecast, by Battery 2020 & 2033
- Table 4: Global Micro Mobility Market Volume Billion Forecast, by Battery 2020 & 2033
- Table 5: Global Micro Mobility Market Revenue Million Forecast, by Voltage 2020 & 2033
- Table 6: Global Micro Mobility Market Volume Billion Forecast, by Voltage 2020 & 2033
- Table 7: Global Micro Mobility Market Revenue Million Forecast, by Sharing Type 2020 & 2033
- Table 8: Global Micro Mobility Market Volume Billion Forecast, by Sharing Type 2020 & 2033
- Table 9: Global Micro Mobility Market Revenue Million Forecast, by Region 2020 & 2033
- Table 10: Global Micro Mobility Market Volume Billion Forecast, by Region 2020 & 2033
- Table 11: Global Micro Mobility Market Revenue Million Forecast, by Vehicle Type 2020 & 2033
- Table 12: Global Micro Mobility Market Volume Billion Forecast, by Vehicle Type 2020 & 2033
- Table 13: Global Micro Mobility Market Revenue Million Forecast, by Battery 2020 & 2033
- Table 14: Global Micro Mobility Market Volume Billion Forecast, by Battery 2020 & 2033
- Table 15: Global Micro Mobility Market Revenue Million Forecast, by Voltage 2020 & 2033
- Table 16: Global Micro Mobility Market Volume Billion Forecast, by Voltage 2020 & 2033
- Table 17: Global Micro Mobility Market Revenue Million Forecast, by Sharing Type 2020 & 2033
- Table 18: Global Micro Mobility Market Volume Billion Forecast, by Sharing Type 2020 & 2033
- Table 19: Global Micro Mobility Market Revenue Million Forecast, by Country 2020 & 2033
- Table 20: Global Micro Mobility Market Volume Billion Forecast, by Country 2020 & 2033
- Table 21: United States Micro Mobility Market Revenue (Million) Forecast, by Application 2020 & 2033
- Table 22: United States Micro Mobility Market Volume (Billion) Forecast, by Application 2020 & 2033
- Table 23: Canada Micro Mobility Market Revenue (Million) Forecast, by Application 2020 & 2033
- Table 24: Canada Micro Mobility Market Volume (Billion) Forecast, by Application 2020 & 2033
- Table 25: Rest of North America Micro Mobility Market Revenue (Million) Forecast, by Application 2020 & 2033
- Table 26: Rest of North America Micro Mobility Market Volume (Billion) Forecast, by Application 2020 & 2033
- Table 27: Global Micro Mobility Market Revenue Million Forecast, by Vehicle Type 2020 & 2033
- Table 28: Global Micro Mobility Market Volume Billion Forecast, by Vehicle Type 2020 & 2033
- Table 29: Global Micro Mobility Market Revenue Million Forecast, by Battery 2020 & 2033
- Table 30: Global Micro Mobility Market Volume Billion Forecast, by Battery 2020 & 2033
- Table 31: Global Micro Mobility Market Revenue Million Forecast, by Voltage 2020 & 2033
- Table 32: Global Micro Mobility Market Volume Billion Forecast, by Voltage 2020 & 2033
- Table 33: Global Micro Mobility Market Revenue Million Forecast, by Sharing Type 2020 & 2033
- Table 34: Global Micro Mobility Market Volume Billion Forecast, by Sharing Type 2020 & 2033
- Table 35: Global Micro Mobility Market Revenue Million Forecast, by Country 2020 & 2033
- Table 36: Global Micro Mobility Market Volume Billion Forecast, by Country 2020 & 2033
- Table 37: Germany Micro Mobility Market Revenue (Million) Forecast, by Application 2020 & 2033
- Table 38: Germany Micro Mobility Market Volume (Billion) Forecast, by Application 2020 & 2033
- Table 39: United Kingdom Micro Mobility Market Revenue (Million) Forecast, by Application 2020 & 2033
- Table 40: United Kingdom Micro Mobility Market Volume (Billion) Forecast, by Application 2020 & 2033
- Table 41: France Micro Mobility Market Revenue (Million) Forecast, by Application 2020 & 2033
- Table 42: France Micro Mobility Market Volume (Billion) Forecast, by Application 2020 & 2033
- Table 43: Italy Micro Mobility Market Revenue (Million) Forecast, by Application 2020 & 2033
- Table 44: Italy Micro Mobility Market Volume (Billion) Forecast, by Application 2020 & 2033
- Table 45: Spain Micro Mobility Market Revenue (Million) Forecast, by Application 2020 & 2033
- Table 46: Spain Micro Mobility Market Volume (Billion) Forecast, by Application 2020 & 2033
- Table 47: Rest of Europe Micro Mobility Market Revenue (Million) Forecast, by Application 2020 & 2033
- Table 48: Rest of Europe Micro Mobility Market Volume (Billion) Forecast, by Application 2020 & 2033
- Table 49: Global Micro Mobility Market Revenue Million Forecast, by Vehicle Type 2020 & 2033
- Table 50: Global Micro Mobility Market Volume Billion Forecast, by Vehicle Type 2020 & 2033
- Table 51: Global Micro Mobility Market Revenue Million Forecast, by Battery 2020 & 2033
- Table 52: Global Micro Mobility Market Volume Billion Forecast, by Battery 2020 & 2033
- Table 53: Global Micro Mobility Market Revenue Million Forecast, by Voltage 2020 & 2033
- Table 54: Global Micro Mobility Market Volume Billion Forecast, by Voltage 2020 & 2033
- Table 55: Global Micro Mobility Market Revenue Million Forecast, by Sharing Type 2020 & 2033
- Table 56: Global Micro Mobility Market Volume Billion Forecast, by Sharing Type 2020 & 2033
- Table 57: Global Micro Mobility Market Revenue Million Forecast, by Country 2020 & 2033
- Table 58: Global Micro Mobility Market Volume Billion Forecast, by Country 2020 & 2033
- Table 59: China Micro Mobility Market Revenue (Million) Forecast, by Application 2020 & 2033
- Table 60: China Micro Mobility Market Volume (Billion) Forecast, by Application 2020 & 2033
- Table 61: Japan Micro Mobility Market Revenue (Million) Forecast, by Application 2020 & 2033
- Table 62: Japan Micro Mobility Market Volume (Billion) Forecast, by Application 2020 & 2033
- Table 63: India Micro Mobility Market Revenue (Million) Forecast, by Application 2020 & 2033
- Table 64: India Micro Mobility Market Volume (Billion) Forecast, by Application 2020 & 2033
- Table 65: South Korea Micro Mobility Market Revenue (Million) Forecast, by Application 2020 & 2033
- Table 66: South Korea Micro Mobility Market Volume (Billion) Forecast, by Application 2020 & 2033
- Table 67: Rest of Asia Pacific Micro Mobility Market Revenue (Million) Forecast, by Application 2020 & 2033
- Table 68: Rest of Asia Pacific Micro Mobility Market Volume (Billion) Forecast, by Application 2020 & 2033
- Table 69: Global Micro Mobility Market Revenue Million Forecast, by Vehicle Type 2020 & 2033
- Table 70: Global Micro Mobility Market Volume Billion Forecast, by Vehicle Type 2020 & 2033
- Table 71: Global Micro Mobility Market Revenue Million Forecast, by Battery 2020 & 2033
- Table 72: Global Micro Mobility Market Volume Billion Forecast, by Battery 2020 & 2033
- Table 73: Global Micro Mobility Market Revenue Million Forecast, by Voltage 2020 & 2033
- Table 74: Global Micro Mobility Market Volume Billion Forecast, by Voltage 2020 & 2033
- Table 75: Global Micro Mobility Market Revenue Million Forecast, by Sharing Type 2020 & 2033
- Table 76: Global Micro Mobility Market Volume Billion Forecast, by Sharing Type 2020 & 2033
- Table 77: Global Micro Mobility Market Revenue Million Forecast, by Country 2020 & 2033
- Table 78: Global Micro Mobility Market Volume Billion Forecast, by Country 2020 & 2033
- Table 79: South America Micro Mobility Market Revenue (Million) Forecast, by Application 2020 & 2033
- Table 80: South America Micro Mobility Market Volume (Billion) Forecast, by Application 2020 & 2033
- Table 81: Middle East and Africa Micro Mobility Market Revenue (Million) Forecast, by Application 2020 & 2033
- Table 82: Middle East and Africa Micro Mobility Market Volume (Billion) Forecast, by Application 2020 & 2033
Frequently Asked Questions
1. What is the projected Compound Annual Growth Rate (CAGR) of the Micro Mobility Market?
The projected CAGR is approximately > 12.00%.
2. Which companies are prominent players in the Micro Mobility Market?
Key companies in the market include Beam Mobility Holdings Pte Ltd, Bird Rides, Dott, ElectricFeel, Floatility GmbH, Lime, Yulu Bikes Pvt Ltd, Voi, Superpedestrian Inc.
3. What are the main segments of the Micro Mobility Market?
The market segments include Vehicle Type, Battery, Voltage, Sharing Type.
4. Can you provide details about the market size?
The market size is estimated to be USD 5.43 Million as of 2022.
5. What are some drivers contributing to market growth?
Increasing Urban Congestion and a Shift Toward Sustainable Transportation Solutions to Drive Market Growth.
6. What are the notable trends driving market growth?
Docked Micromobility Paving the Way for Sustainable Urban Transportation.
7. Are there any restraints impacting market growth?
Increasing Urban Congestion and a Shift Toward Sustainable Transportation Solutions to Drive Market Growth.
8. Can you provide examples of recent developments in the market?
March 2023: Voi Technology secured an additional USD 22.8 million in funding to extend its e-scooter services across Europe. This investment will support Voi's plan to increase its fleet and enhance its offerings in urban mobility solutions.
9. What pricing options are available for accessing the report?
Pricing options include single-user, multi-user, and enterprise licenses priced at USD 4750, USD 5250, and USD 8750 respectively.
10. Is the market size provided in terms of value or volume?
The market size is provided in terms of value, measured in Million and volume, measured in Billion.
11. Are there any specific market keywords associated with the report?
Yes, the market keyword associated with the report is "Micro Mobility Market," which aids in identifying and referencing the specific market segment covered.
12. How do I determine which pricing option suits my needs best?
The pricing options vary based on user requirements and access needs. Individual users may opt for single-user licenses, while businesses requiring broader access may choose multi-user or enterprise licenses for cost-effective access to the report.
13. Are there any additional resources or data provided in the Micro Mobility Market report?
While the report offers comprehensive insights, it's advisable to review the specific contents or supplementary materials provided to ascertain if additional resources or data are available.
14. How can I stay updated on further developments or reports in the Micro Mobility Market?
To stay informed about further developments, trends, and reports in the Micro Mobility Market, consider subscribing to industry newsletters, following relevant companies and organizations, or regularly checking reputable industry news sources and publications.
Methodology
Step 1 - Identification of Relevant Samples Size from Population Database


Step 2 - Approaches for Defining Global Market Size (Value, Volume* & Price*)

Note*: In applicable scenarios
Step 3 - Data Sources
Primary Research
- Web Analytics
- Survey Reports
- Research Institute
- Latest Research Reports
- Opinion Leaders
Secondary Research
- Annual Reports
- White Paper
- Latest Press Release
- Industry Association
- Paid Database
- Investor Presentations

Step 4 - Data Triangulation
Involves using different sources of information in order to increase the validity of a study
These sources are likely to be stakeholders in a program - participants, other researchers, program staff, other community members, and so on.
Then we put all data in single framework & apply various statistical tools to find out the dynamic on the market.
During the analysis stage, feedback from the stakeholder groups would be compared to determine areas of agreement as well as areas of divergence