

Key Insights
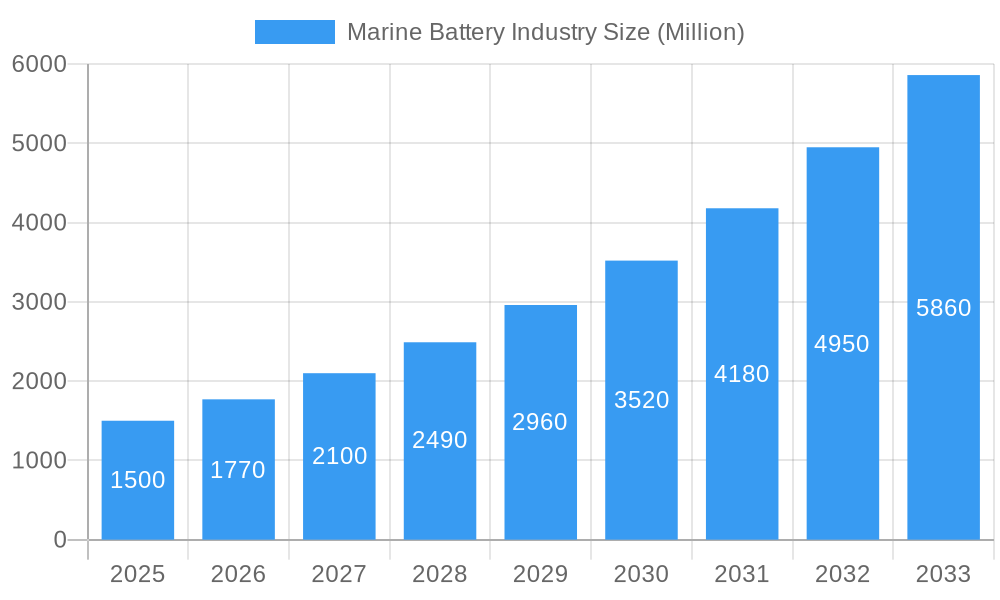
The global marine battery market is experiencing significant expansion, propelled by the increasing adoption of electric and hybrid propulsion systems across commercial and defense maritime sectors. The market, valued at an estimated $1.54 billion in 2025, is projected to grow at a robust Compound Annual Growth Rate (CAGR) of 17.89% from 2025 to 2033. This growth is primarily driven by stringent environmental regulations aimed at reducing maritime emissions and by advancements in battery technologies, notably lithium-ion, offering enhanced energy density and lifespan. The global shift towards sustainable maritime operations underscores the critical role of marine battery systems in eco-friendly vessel design and operation. Additionally, the rise of autonomous and remotely operated vessels further fuels demand for reliable and efficient power solutions.
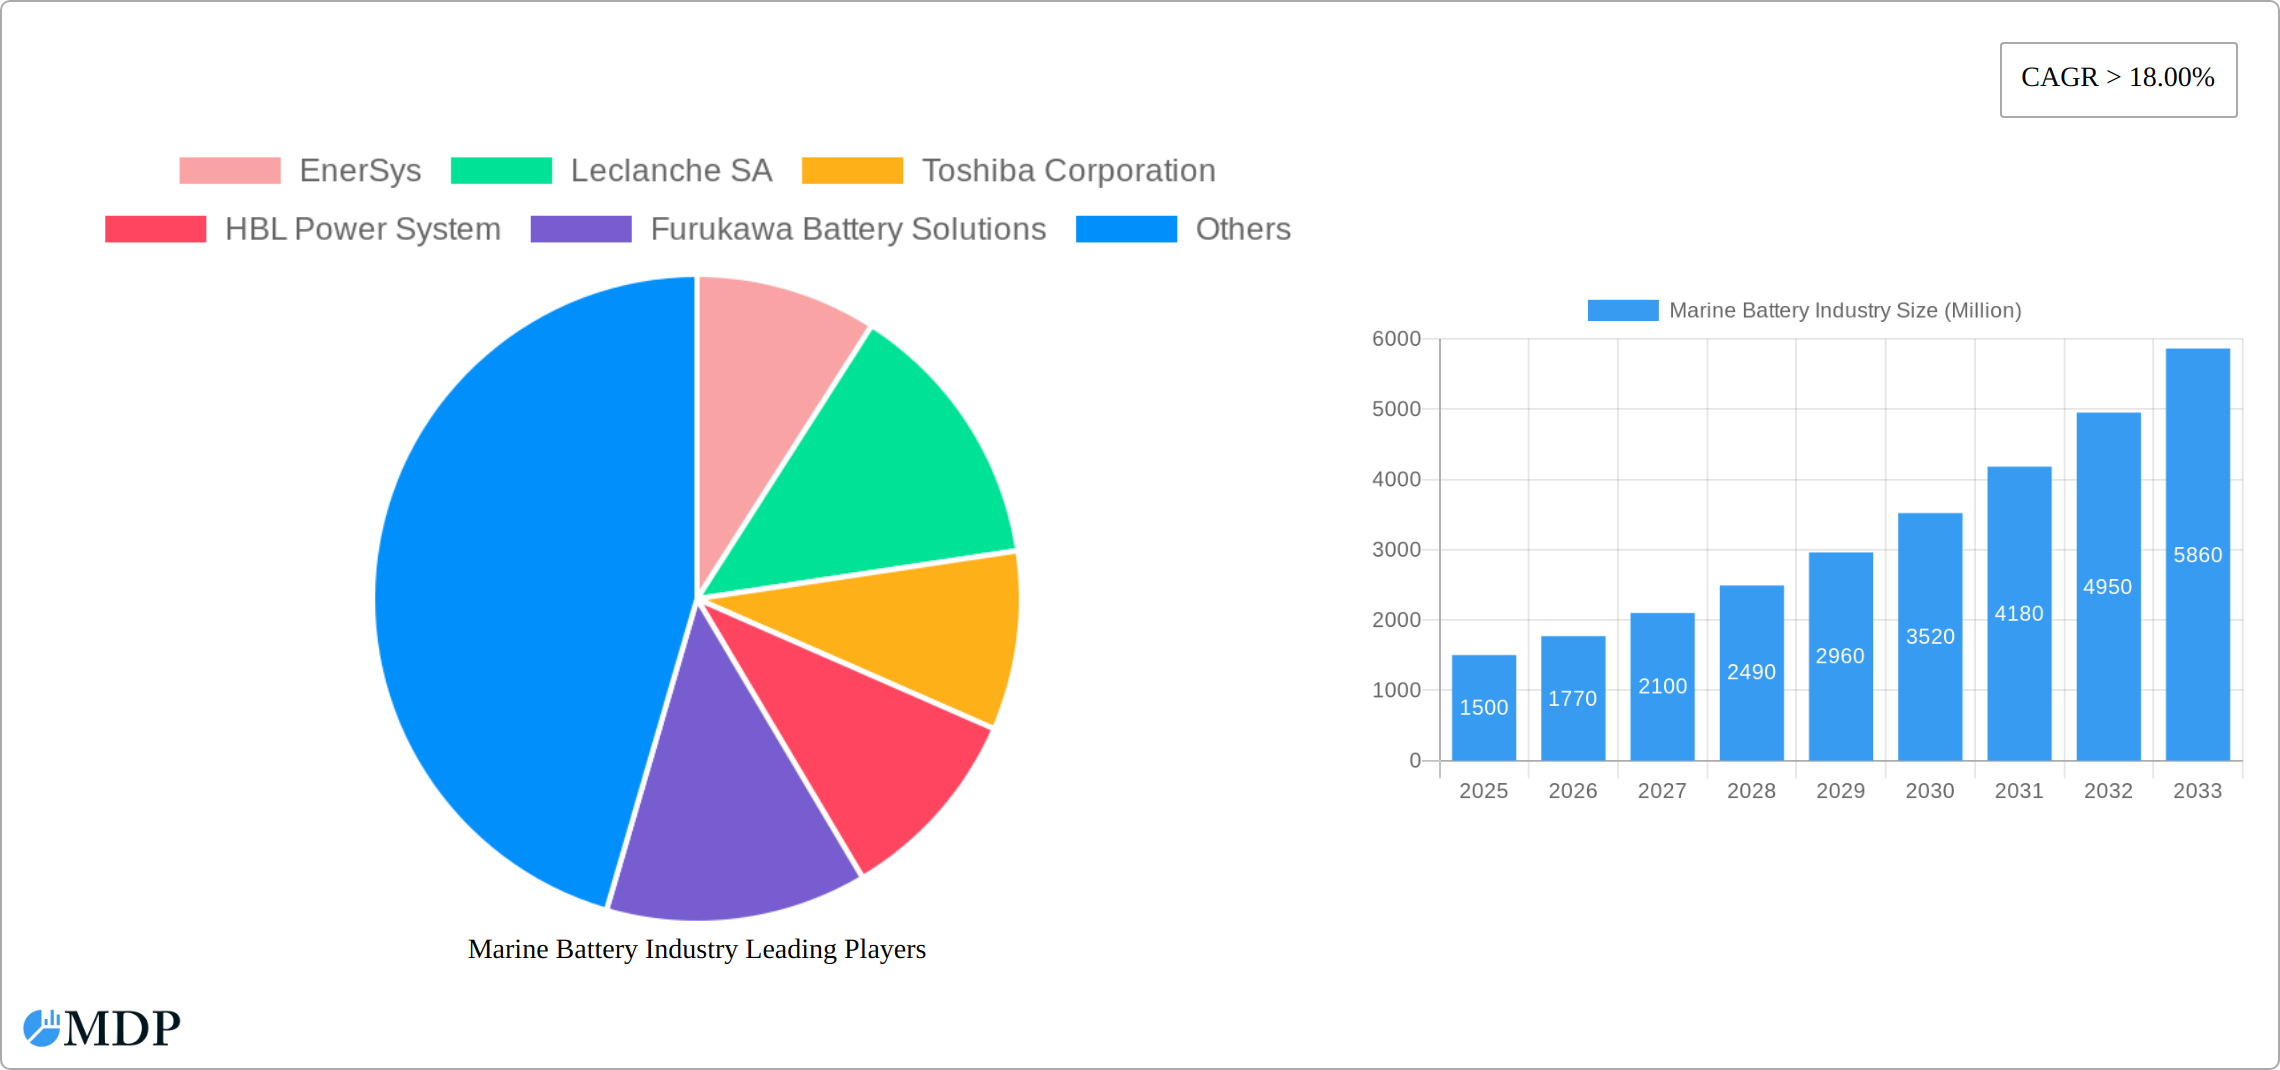
Marine Battery Industry Market Size (In Billion)
Market segmentation highlights a dynamic landscape, with lithium-ion batteries rapidly gaining prominence over traditional lead-acid alternatives, though lead-acid batteries retain a significant presence in specific applications and established fleets. The commercial shipping sector currently dominates the market share, followed by the defense sector's increasing integration of electric propulsion. Geographically, North America and Europe lead in market share due to advanced technological adoption and strict environmental mandates. However, the Asia-Pacific region, particularly China and India, presents substantial growth opportunities, driven by expanding shipbuilding activities and growing investments in green shipping initiatives. Key market restraints include the high initial investment for advanced battery systems, the necessity for improved port charging infrastructure, and considerations regarding battery lifecycle management and recycling. Nevertheless, ongoing technological innovations and supportive government incentives are anticipated to address these challenges, ensuring sustained market growth.
Marine Battery Industry Company Market Share
This report offers a comprehensive analysis of the marine battery industry, covering market dynamics, key players, technological advancements, and future growth projections. With a study period spanning 2019-2033, a base year of 2025, and a forecast period of 2025-2033, this analysis is an essential resource for industry stakeholders, investors, and strategic decision-makers. The market is anticipated to reach $1.54 billion by 2033, demonstrating a CAGR of 17.89% during the forecast period.
Marine Battery Industry Market Dynamics & Concentration
The marine battery market is characterized by a dynamic landscape, exhibiting moderate to increasing concentration with established leaders and emerging innovators. Key players such as EnerSys, Leclanche SA, and Toshiba Corporation continue to hold significant market share, collectively estimated at approximately [Insert Updated Percentage Here]%. However, the industry is experiencing heightened competition due to the strategic entry of new players and continuous technological advancements.
Innovation Drivers: The accelerating global imperative for greener shipping operations, coupled with increasingly stringent emission regulations, are primary catalysts for innovation. Advancements in battery technologies, most notably the superior energy density, lifespan, and performance of lithium-ion batteries, are fundamentally reshaping the market and driving demand for advanced energy storage solutions.
Regulatory Frameworks: International regulations, spearheaded by the International Maritime Organization (IMO) concerning greenhouse gas emissions and sulfur oxide limits, are profoundly influencing the adoption of marine batteries. These frameworks are actively pushing the industry towards cleaner energy solutions and electrifying maritime operations.
Product Substitutes: While marine batteries are currently the prevailing power source for a wide array of applications, emerging technologies such as fuel cells and other alternative energy solutions represent potential long-term substitutes. Although their market penetration is currently limited by factors such as cost and infrastructure development, continuous research and development may alter this landscape in the future.
End-User Trends: The surge in demand for electric and hybrid vessels, particularly within the commercial shipping and defense sectors, is a significant growth engine for the marine battery market. This trend is driven by a desire for enhanced operational efficiency, reduced emissions, and compliance with environmental standards.
M&A Activities: The marine battery industry has witnessed a notable trend of [Insert Updated Number Here] M&A deals during the historical period (e.g., 2019-2024). These activities underscore the ongoing consolidation, strategic alliances, and investment aimed at expanding market reach and technological capabilities within the sector.
Marine Battery Industry Industry Trends & Analysis
The marine battery market is experiencing robust growth, driven by several factors. The increasing adoption of electric and hybrid propulsion systems in commercial vessels, alongside the rising demand for energy-efficient solutions in the defense sector, significantly contributes to this expansion. Technological advancements, especially in lithium-ion battery technology, are improving energy density and lifespan, further boosting market uptake. Consumer preferences are shifting towards environmentally friendly alternatives, further fueling market demand.
The market is characterized by intense competition among established players and new entrants. This competitive landscape is pushing innovation and driving down costs, making marine battery solutions more accessible. The CAGR for the marine battery market during the forecast period (2025-2033) is estimated at xx%. Market penetration of lithium-ion batteries is projected to reach xx% by 2033, significantly surpassing other battery chemistries.
Leading Markets & Segments in Marine Battery Industry
Dominant Region/Segment: The marine battery market is presently dominated by [Name of Region/Country - Insert Updated Name Here], largely attributed to its robust shipbuilding infrastructure, supportive government policies promoting green maritime initiatives, and a high concentration of shipping operations. Within segments, the commercial shipping sector commands the largest market share, driven by the escalating adoption of electric and hybrid vessel technologies to meet regulatory requirements and operational efficiency goals.
Key Drivers by Segment:
- Lithium-ion Batteries: Characterized by their superior energy density, extended lifespan, faster charging capabilities, and overall enhanced performance, making them the preferred choice for modern marine applications.
- Nickel-Cadmium Batteries: A mature and reliable technology with established applications, particularly in certain legacy systems. However, they are increasingly facing competition from the more advanced lithium-ion alternatives.
- Fuel Cell: An emerging technology with significant potential for high-power applications and zero-emission operations. Current limitations include higher costs, complexity, and the need for further development of supporting infrastructure.
- Lead-Acid Batteries: Offer a cost-effective solution for specific, less demanding applications where weight and energy density are not critical factors. However, they face inherent limitations in performance and lifespan compared to newer technologies.
- Commercial Vessels: Driven by stringent global emission regulations, the pursuit of reduced operational costs through fuel savings, and the increasing demand for quieter and more efficient propulsion systems.
- Defense Vessels: Experiencing growing adoption due to critical requirements for stealthy operation (reduced noise and emissions), extended mission endurance, and enhanced operational flexibility.
Dominance Analysis: The sustained growth observed in both the commercial and defense maritime sectors, in tandem with continuous advancements in battery technology, particularly the pervasive adoption of lithium-ion solutions, are reinforcing the dominance of these segments. Furthermore, supportive government regulations, financial incentives, and industry-wide commitments to sustainability are acting as powerful accelerators for this market's expansion.
Marine Battery Industry Product Developments
Significant advancements in battery technology are shaping the marine battery landscape. Lithium-ion batteries are rapidly gaining market share due to their higher energy density and longer lifespan, enabling longer operational ranges for vessels. Innovations in battery management systems (BMS) are improving safety and performance, while advancements in fast-charging technology are addressing range anxiety concerns. This focus on improved energy storage solutions tailored to marine environments is crucial in establishing competitive advantages and driving market adoption.
Key Drivers of Marine Battery Industry Growth
The marine battery industry is experiencing robust and sustained growth, fueled by a compelling synergy of critical factors. Foremost among these are the increasingly stringent environmental regulations enacted globally, aimed at significantly reducing greenhouse gas emissions and other pollutants from maritime activities, thereby mandating the adoption of cleaner energy solutions. Concurrently, the ongoing reduction in the manufacturing costs of lithium-ion batteries is making them an increasingly economically viable alternative to conventional fossil fuels. Technological innovations are also playing a pivotal role, leading to substantial improvements in battery performance, energy density, safety, and operational lifespan, which further accelerates market expansion. Moreover, substantial government incentives, subsidies, and dedicated support for green shipping initiatives across numerous regions are providing a crucial impetus for the widespread adoption of marine battery technology.
Challenges in the Marine Battery Industry Market
Despite its significant growth trajectory, the marine battery market encounters several persistent hurdles. The substantial initial capital outlay required for the installation of advanced battery systems remains a considerable barrier to widespread adoption for many operators, particularly smaller entities. Furthermore, the susceptibility of global supply chains to disruptions, especially concerning the sourcing of critical raw materials like lithium, cobalt, and nickel, can impact production volumes and availability, leading to potential price volatility. The development and implementation of robust, standardized safety protocols and regulatory frameworks specifically tailored for the unique and demanding marine environment present ongoing challenges. These complex factors collectively influence the pace of marine battery adoption, though continuous technological progress and declining cost trends are gradually ameliorating these challenges, paving the way for broader market penetration.
Emerging Opportunities in Marine Battery Industry
The long-term outlook for the marine battery industry is positive. Continued technological breakthroughs, particularly in solid-state battery technology, promise to further enhance energy density and safety. Strategic partnerships between battery manufacturers and shipbuilders are creating integrated solutions optimized for marine applications. The expansion of the electric and hybrid vessel market, driven by both environmental concerns and economic incentives, presents significant growth opportunities.
Leading Players in the Marine Battery Industry Sector
- EnerSys
- Leclanche SA
- Toshiba Corporation
- HBL Power System
- Furukawa Battery Solutions
- Siemens AG
- BorgWarner Inc
- Wartsila
- Saft
- Exide Technologies
- BYD Company Limited
- LG Energy Solution
- Panasonic Corporation
Key Milestones in Marine Battery Industry Industry
October 2022: ABS and CATL signed a cooperation agreement to research lithium battery propulsion for next-generation vessels, focusing on safety-related technologies. This collaboration signifies a significant step towards establishing industry standards for battery-powered vessels.
January 2022: Vision Marine Technologies partnered with Octillion Power Systems to develop a custom high-voltage battery pack for the recreational boating market. This partnership highlights the growing interest in marine battery applications beyond commercial and defense sectors.
Strategic Outlook for Marine Battery Industry Market
The future of the marine battery market is bright, driven by increasing environmental regulations, technological advancements, and a growing demand for sustainable shipping solutions. Strategic partnerships, investments in R&D, and the development of innovative battery technologies will be critical factors in shaping the market's future trajectory. The market is poised for significant expansion as the adoption of electric and hybrid vessels continues to gain momentum across various sectors.
Marine Battery Industry Segmentation
-
1. Battery
- 1.1. Lithium-ion
- 1.2. Nickel-Cadmium
- 1.3. Fuel Cell
- 1.4. Lead Acid
-
2. Ship Type
- 2.1. Commercial
- 2.2. Defense
Marine Battery Industry Segmentation By Geography
-
1. North America
- 1.1. United States
- 1.2. Canada
-
2. Europe
- 2.1. Germany
- 2.2. United Kingdom
- 2.3. France
- 2.4. Russia
- 2.5. Rest of Europe
-
3. Asia Pacific
- 3.1. India
- 3.2. China
- 3.3. Japan
- 3.4. South Korea
- 3.5. Rest of Asia Pacific
-
4. Latin America
- 4.1. Brazil
- 4.2. Rest of Latin America
-
5. Middle East and Africa
- 5.1. United Arab Emirates
- 5.2. Saudi Arabia
- 5.3. Israel
- 5.4. South Africa
- 5.5. Rest of Middle East and Africa
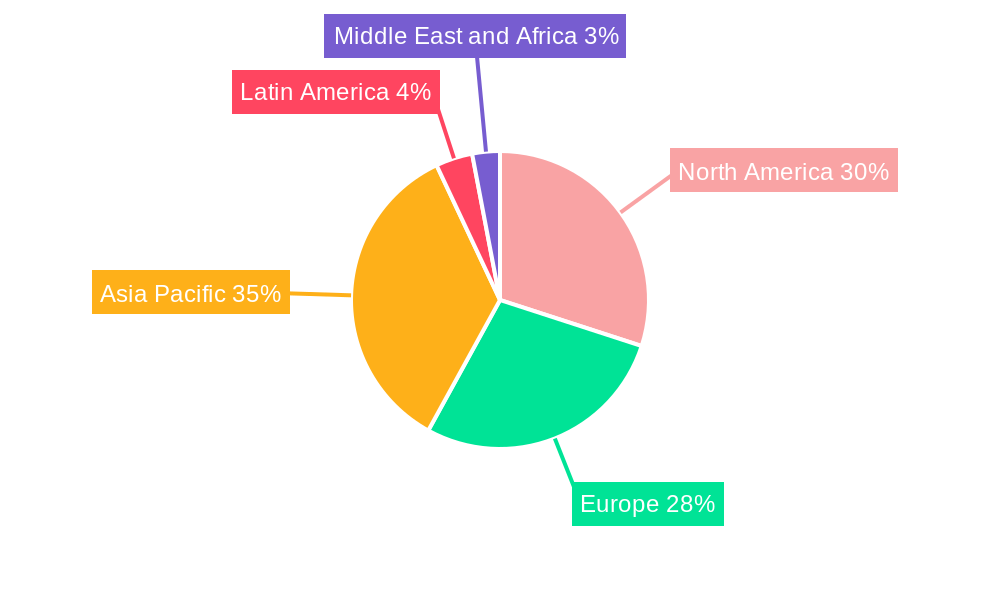
Marine Battery Industry Regional Market Share
Geographic Coverage of Marine Battery Industry
Marine Battery Industry REPORT HIGHLIGHTS
| Aspects | Details |
|---|---|
| Study Period | 2020-2034 |
| Base Year | 2025 |
| Estimated Year | 2026 |
| Forecast Period | 2026-2034 |
| Historical Period | 2020-2025 |
| Growth Rate | CAGR of 17.89% from 2020-2034 |
| Segmentation |
|
Table of Contents
- 1. Introduction
- 1.1. Research Scope
- 1.2. Market Segmentation
- 1.3. Research Objective
- 1.4. Definitions and Assumptions
- 2. Executive Summary
- 2.1. Market Snapshot
- 3. Market Dynamics
- 3.1. Market Drivers
- 3.2. Market Restrains
- 3.3. Market Trends
- 3.4. Market Opportunities
- 4. Market Factor Analysis
- 4.1. Porters Five Forces
- 4.1.1. Bargaining Power of Suppliers
- 4.1.2. Bargaining Power of Buyers
- 4.1.3. Threat of New Entrants
- 4.1.4. Threat of Substitutes
- 4.1.5. Competitive Rivalry
- 4.2. PESTEL analysis
- 4.3. BCG Analysis
- 4.3.1. Stars (High Growth, High Market Share)
- 4.3.2. Cash Cows (Low Growth, High Market Share)
- 4.3.3. Question Mark (High Growth, Low Market Share)
- 4.3.4. Dogs (Low Growth, Low Market Share)
- 4.4. Ansoff Matrix Analysis
- 4.5. Supply Chain Analysis
- 4.6. Regulatory Landscape
- 4.7. Current Market Potential and Opportunity Assessment (TAM–SAM–SOM Framework)
- 4.8. MDP Analyst Note
- 4.1. Porters Five Forces
- 5. Market Analysis, Insights and Forecast 2021-2033
- 5.1. Market Analysis, Insights and Forecast - by Battery
- 5.1.1. Lithium-ion
- 5.1.2. Nickel-Cadmium
- 5.1.3. Fuel Cell
- 5.1.4. Lead Acid
- 5.2. Market Analysis, Insights and Forecast - by Ship Type
- 5.2.1. Commercial
- 5.2.2. Defense
- 5.3. Market Analysis, Insights and Forecast - by Region
- 5.3.1. North America
- 5.3.2. Europe
- 5.3.3. Asia Pacific
- 5.3.4. Latin America
- 5.3.5. Middle East and Africa
- 5.1. Market Analysis, Insights and Forecast - by Battery
- 6. Global Marine Battery Industry Analysis, Insights and Forecast, 2021-2033
- 6.1. Market Analysis, Insights and Forecast - by Battery
- 6.1.1. Lithium-ion
- 6.1.2. Nickel-Cadmium
- 6.1.3. Fuel Cell
- 6.1.4. Lead Acid
- 6.2. Market Analysis, Insights and Forecast - by Ship Type
- 6.2.1. Commercial
- 6.2.2. Defense
- 6.1. Market Analysis, Insights and Forecast - by Battery
- 7. North America Marine Battery Industry Analysis, Insights and Forecast, 2020-2032
- 7.1. Market Analysis, Insights and Forecast - by Battery
- 7.1.1. Lithium-ion
- 7.1.2. Nickel-Cadmium
- 7.1.3. Fuel Cell
- 7.1.4. Lead Acid
- 7.2. Market Analysis, Insights and Forecast - by Ship Type
- 7.2.1. Commercial
- 7.2.2. Defense
- 7.1. Market Analysis, Insights and Forecast - by Battery
- 8. Europe Marine Battery Industry Analysis, Insights and Forecast, 2020-2032
- 8.1. Market Analysis, Insights and Forecast - by Battery
- 8.1.1. Lithium-ion
- 8.1.2. Nickel-Cadmium
- 8.1.3. Fuel Cell
- 8.1.4. Lead Acid
- 8.2. Market Analysis, Insights and Forecast - by Ship Type
- 8.2.1. Commercial
- 8.2.2. Defense
- 8.1. Market Analysis, Insights and Forecast - by Battery
- 9. Asia Pacific Marine Battery Industry Analysis, Insights and Forecast, 2020-2032
- 9.1. Market Analysis, Insights and Forecast - by Battery
- 9.1.1. Lithium-ion
- 9.1.2. Nickel-Cadmium
- 9.1.3. Fuel Cell
- 9.1.4. Lead Acid
- 9.2. Market Analysis, Insights and Forecast - by Ship Type
- 9.2.1. Commercial
- 9.2.2. Defense
- 9.1. Market Analysis, Insights and Forecast - by Battery
- 10. Latin America Marine Battery Industry Analysis, Insights and Forecast, 2020-2032
- 10.1. Market Analysis, Insights and Forecast - by Battery
- 10.1.1. Lithium-ion
- 10.1.2. Nickel-Cadmium
- 10.1.3. Fuel Cell
- 10.1.4. Lead Acid
- 10.2. Market Analysis, Insights and Forecast - by Ship Type
- 10.2.1. Commercial
- 10.2.2. Defense
- 10.1. Market Analysis, Insights and Forecast - by Battery
- 11. Middle East and Africa Marine Battery Industry Analysis, Insights and Forecast, 2020-2032
- 11.1. Market Analysis, Insights and Forecast - by Battery
- 11.1.1. Lithium-ion
- 11.1.2. Nickel-Cadmium
- 11.1.3. Fuel Cell
- 11.1.4. Lead Acid
- 11.2. Market Analysis, Insights and Forecast - by Ship Type
- 11.2.1. Commercial
- 11.2.2. Defense
- 11.1. Market Analysis, Insights and Forecast - by Battery
- 12. Competitive Analysis
- 12.1. Company Profiles
- 12.1.1 EnerSys
- 12.1.1.1. Company Overview
- 12.1.1.2. Products
- 12.1.1.3. Company Financials
- 12.1.1.4. SWOT Analysis
- 12.1.2 Leclanche SA
- 12.1.2.1. Company Overview
- 12.1.2.2. Products
- 12.1.2.3. Company Financials
- 12.1.2.4. SWOT Analysis
- 12.1.3 Toshiba Corporation
- 12.1.3.1. Company Overview
- 12.1.3.2. Products
- 12.1.3.3. Company Financials
- 12.1.3.4. SWOT Analysis
- 12.1.4 HBL Power System
- 12.1.4.1. Company Overview
- 12.1.4.2. Products
- 12.1.4.3. Company Financials
- 12.1.4.4. SWOT Analysis
- 12.1.5 Furukawa Battery Solutions
- 12.1.5.1. Company Overview
- 12.1.5.2. Products
- 12.1.5.3. Company Financials
- 12.1.5.4. SWOT Analysis
- 12.1.6 Siemens AG
- 12.1.6.1. Company Overview
- 12.1.6.2. Products
- 12.1.6.3. Company Financials
- 12.1.6.4. SWOT Analysis
- 12.1.7 BorgWarner Inc
- 12.1.7.1. Company Overview
- 12.1.7.2. Products
- 12.1.7.3. Company Financials
- 12.1.7.4. SWOT Analysis
- 12.1.8 Wartsila
- 12.1.8.1. Company Overview
- 12.1.8.2. Products
- 12.1.8.3. Company Financials
- 12.1.8.4. SWOT Analysis
- 12.1.9 Saft
- 12.1.9.1. Company Overview
- 12.1.9.2. Products
- 12.1.9.3. Company Financials
- 12.1.9.4. SWOT Analysis
- 12.1.10 Exide Technologies
- 12.1.10.1. Company Overview
- 12.1.10.2. Products
- 12.1.10.3. Company Financials
- 12.1.10.4. SWOT Analysis
- 12.1.1 EnerSys
- 12.2. Market Entropy
- 12.2.1 Company's Key Areas Served
- 12.2.2 Recent Developments
- 12.3. Company Market Share Analysis 2025
- 12.3.1 Top 5 Companies Market Share Analysis
- 12.3.2 Top 3 Companies Market Share Analysis
- 12.4. List of Potential Customers
- 13. Research Methodology
List of Figures
- Figure 1: Global Marine Battery Industry Revenue Breakdown (billion, %) by Region 2025 & 2033
- Figure 2: North America Marine Battery Industry Revenue (billion), by Battery 2025 & 2033
- Figure 3: North America Marine Battery Industry Revenue Share (%), by Battery 2025 & 2033
- Figure 4: North America Marine Battery Industry Revenue (billion), by Ship Type 2025 & 2033
- Figure 5: North America Marine Battery Industry Revenue Share (%), by Ship Type 2025 & 2033
- Figure 6: North America Marine Battery Industry Revenue (billion), by Country 2025 & 2033
- Figure 7: North America Marine Battery Industry Revenue Share (%), by Country 2025 & 2033
- Figure 8: Europe Marine Battery Industry Revenue (billion), by Battery 2025 & 2033
- Figure 9: Europe Marine Battery Industry Revenue Share (%), by Battery 2025 & 2033
- Figure 10: Europe Marine Battery Industry Revenue (billion), by Ship Type 2025 & 2033
- Figure 11: Europe Marine Battery Industry Revenue Share (%), by Ship Type 2025 & 2033
- Figure 12: Europe Marine Battery Industry Revenue (billion), by Country 2025 & 2033
- Figure 13: Europe Marine Battery Industry Revenue Share (%), by Country 2025 & 2033
- Figure 14: Asia Pacific Marine Battery Industry Revenue (billion), by Battery 2025 & 2033
- Figure 15: Asia Pacific Marine Battery Industry Revenue Share (%), by Battery 2025 & 2033
- Figure 16: Asia Pacific Marine Battery Industry Revenue (billion), by Ship Type 2025 & 2033
- Figure 17: Asia Pacific Marine Battery Industry Revenue Share (%), by Ship Type 2025 & 2033
- Figure 18: Asia Pacific Marine Battery Industry Revenue (billion), by Country 2025 & 2033
- Figure 19: Asia Pacific Marine Battery Industry Revenue Share (%), by Country 2025 & 2033
- Figure 20: Latin America Marine Battery Industry Revenue (billion), by Battery 2025 & 2033
- Figure 21: Latin America Marine Battery Industry Revenue Share (%), by Battery 2025 & 2033
- Figure 22: Latin America Marine Battery Industry Revenue (billion), by Ship Type 2025 & 2033
- Figure 23: Latin America Marine Battery Industry Revenue Share (%), by Ship Type 2025 & 2033
- Figure 24: Latin America Marine Battery Industry Revenue (billion), by Country 2025 & 2033
- Figure 25: Latin America Marine Battery Industry Revenue Share (%), by Country 2025 & 2033
- Figure 26: Middle East and Africa Marine Battery Industry Revenue (billion), by Battery 2025 & 2033
- Figure 27: Middle East and Africa Marine Battery Industry Revenue Share (%), by Battery 2025 & 2033
- Figure 28: Middle East and Africa Marine Battery Industry Revenue (billion), by Ship Type 2025 & 2033
- Figure 29: Middle East and Africa Marine Battery Industry Revenue Share (%), by Ship Type 2025 & 2033
- Figure 30: Middle East and Africa Marine Battery Industry Revenue (billion), by Country 2025 & 2033
- Figure 31: Middle East and Africa Marine Battery Industry Revenue Share (%), by Country 2025 & 2033
List of Tables
- Table 1: Global Marine Battery Industry Revenue billion Forecast, by Battery 2020 & 2033
- Table 2: Global Marine Battery Industry Revenue billion Forecast, by Ship Type 2020 & 2033
- Table 3: Global Marine Battery Industry Revenue billion Forecast, by Region 2020 & 2033
- Table 4: Global Marine Battery Industry Revenue billion Forecast, by Battery 2020 & 2033
- Table 5: Global Marine Battery Industry Revenue billion Forecast, by Ship Type 2020 & 2033
- Table 6: Global Marine Battery Industry Revenue billion Forecast, by Country 2020 & 2033
- Table 7: United States Marine Battery Industry Revenue (billion) Forecast, by Application 2020 & 2033
- Table 8: Canada Marine Battery Industry Revenue (billion) Forecast, by Application 2020 & 2033
- Table 9: Global Marine Battery Industry Revenue billion Forecast, by Battery 2020 & 2033
- Table 10: Global Marine Battery Industry Revenue billion Forecast, by Ship Type 2020 & 2033
- Table 11: Global Marine Battery Industry Revenue billion Forecast, by Country 2020 & 2033
- Table 12: Germany Marine Battery Industry Revenue (billion) Forecast, by Application 2020 & 2033
- Table 13: United Kingdom Marine Battery Industry Revenue (billion) Forecast, by Application 2020 & 2033
- Table 14: France Marine Battery Industry Revenue (billion) Forecast, by Application 2020 & 2033
- Table 15: Russia Marine Battery Industry Revenue (billion) Forecast, by Application 2020 & 2033
- Table 16: Rest of Europe Marine Battery Industry Revenue (billion) Forecast, by Application 2020 & 2033
- Table 17: Global Marine Battery Industry Revenue billion Forecast, by Battery 2020 & 2033
- Table 18: Global Marine Battery Industry Revenue billion Forecast, by Ship Type 2020 & 2033
- Table 19: Global Marine Battery Industry Revenue billion Forecast, by Country 2020 & 2033
- Table 20: India Marine Battery Industry Revenue (billion) Forecast, by Application 2020 & 2033
- Table 21: China Marine Battery Industry Revenue (billion) Forecast, by Application 2020 & 2033
- Table 22: Japan Marine Battery Industry Revenue (billion) Forecast, by Application 2020 & 2033
- Table 23: South Korea Marine Battery Industry Revenue (billion) Forecast, by Application 2020 & 2033
- Table 24: Rest of Asia Pacific Marine Battery Industry Revenue (billion) Forecast, by Application 2020 & 2033
- Table 25: Global Marine Battery Industry Revenue billion Forecast, by Battery 2020 & 2033
- Table 26: Global Marine Battery Industry Revenue billion Forecast, by Ship Type 2020 & 2033
- Table 27: Global Marine Battery Industry Revenue billion Forecast, by Country 2020 & 2033
- Table 28: Brazil Marine Battery Industry Revenue (billion) Forecast, by Application 2020 & 2033
- Table 29: Rest of Latin America Marine Battery Industry Revenue (billion) Forecast, by Application 2020 & 2033
- Table 30: Global Marine Battery Industry Revenue billion Forecast, by Battery 2020 & 2033
- Table 31: Global Marine Battery Industry Revenue billion Forecast, by Ship Type 2020 & 2033
- Table 32: Global Marine Battery Industry Revenue billion Forecast, by Country 2020 & 2033
- Table 33: United Arab Emirates Marine Battery Industry Revenue (billion) Forecast, by Application 2020 & 2033
- Table 34: Saudi Arabia Marine Battery Industry Revenue (billion) Forecast, by Application 2020 & 2033
- Table 35: Israel Marine Battery Industry Revenue (billion) Forecast, by Application 2020 & 2033
- Table 36: South Africa Marine Battery Industry Revenue (billion) Forecast, by Application 2020 & 2033
- Table 37: Rest of Middle East and Africa Marine Battery Industry Revenue (billion) Forecast, by Application 2020 & 2033
Frequently Asked Questions
1. What is the projected Compound Annual Growth Rate (CAGR) of the Marine Battery Industry?
The projected CAGR is approximately 17.89%.
2. Which companies are prominent players in the Marine Battery Industry?
Key companies in the market include EnerSys, Leclanche SA, Toshiba Corporation, HBL Power System, Furukawa Battery Solutions, Siemens AG, BorgWarner Inc, Wartsila, Saft, Exide Technologies.
3. What are the main segments of the Marine Battery Industry?
The market segments include Battery, Ship Type.
4. Can you provide details about the market size?
The market size is estimated to be USD 1.54 billion as of 2022.
5. What are some drivers contributing to market growth?
Increasing Adoption of 2-wheelers across the Globe.
6. What are the notable trends driving market growth?
Lithium-ion Segment is Projected to Highest Growth During the Forecast Period.
7. Are there any restraints impacting market growth?
Rise in demand of Electric Vehicles.
8. Can you provide examples of recent developments in the market?
October 2022: ABS signed a cooperation agreement with Contemporary Amperex Technology Co., Limited (CATL) to work together and research lithium battery propulsion for next-generation vessels. Under the agreement, the two companies would carry out research on the technical standards for battery-powered vessels, which includes key safety-related technologies such as the charging system, power battery compartment layout, propulsion system, and fire control.
9. What pricing options are available for accessing the report?
Pricing options include single-user, multi-user, and enterprise licenses priced at USD 4750, USD 5250, and USD 8750 respectively.
10. Is the market size provided in terms of value or volume?
The market size is provided in terms of value, measured in billion.
11. Are there any specific market keywords associated with the report?
Yes, the market keyword associated with the report is "Marine Battery Industry," which aids in identifying and referencing the specific market segment covered.
12. How do I determine which pricing option suits my needs best?
The pricing options vary based on user requirements and access needs. Individual users may opt for single-user licenses, while businesses requiring broader access may choose multi-user or enterprise licenses for cost-effective access to the report.
13. Are there any additional resources or data provided in the Marine Battery Industry report?
While the report offers comprehensive insights, it's advisable to review the specific contents or supplementary materials provided to ascertain if additional resources or data are available.
14. How can I stay updated on further developments or reports in the Marine Battery Industry?
To stay informed about further developments, trends, and reports in the Marine Battery Industry, consider subscribing to industry newsletters, following relevant companies and organizations, or regularly checking reputable industry news sources and publications.
Methodology
Step 1 - Identification of Relevant Samples Size from Population Database


Step 2 - Approaches for Defining Global Market Size (Value, Volume* & Price*)

Note*: In applicable scenarios
Step 3 - Data Sources
Primary Research
- Web Analytics
- Survey Reports
- Research Institute
- Latest Research Reports
- Opinion Leaders
Secondary Research
- Annual Reports
- White Paper
- Latest Press Release
- Industry Association
- Paid Database
- Investor Presentations

Step 4 - Data Triangulation
Involves using different sources of information in order to increase the validity of a study
These sources are likely to be stakeholders in a program - participants, other researchers, program staff, other community members, and so on.
Then we put all data in single framework & apply various statistical tools to find out the dynamic on the market.
During the analysis stage, feedback from the stakeholder groups would be compared to determine areas of agreement as well as areas of divergence