

Key Insights
The global heat shield market is experiencing significant growth, driven by the increasing demand for vehicles offering enhanced fuel efficiency and advanced safety features. Projections indicate a sustained upward trajectory, with a projected Compound Annual Growth Rate (CAGR) of 5.5%. This expansion is propelled by stringent global emission regulations, necessitating increased adoption of heat shields in both passenger and commercial vehicles to optimize engine heat management and exhaust system performance. Innovations in materials science are yielding lighter, more durable, and cost-effective heat shield solutions, further accelerating market penetration. The automotive industry's commitment to lightweighting for improved fuel economy also significantly contributes, as heat shields play a vital role in this objective. Segmentation analysis reveals that the engine compartment dominates market share, followed by the exhaust compartment, underscoring the critical nature of thermal management in these areas. While Original Equipment Manufacturers (OEMs) currently lead sales channels, the aftermarket segment is anticipated to grow substantially, driven by demand for replacement and repair parts. Key markets include North America and Asia Pacific, supported by robust automotive production and a high concentration of major manufacturers. The Asia Pacific region is expected to exhibit particularly rapid growth due to its expanding automotive sector and emerging economies.
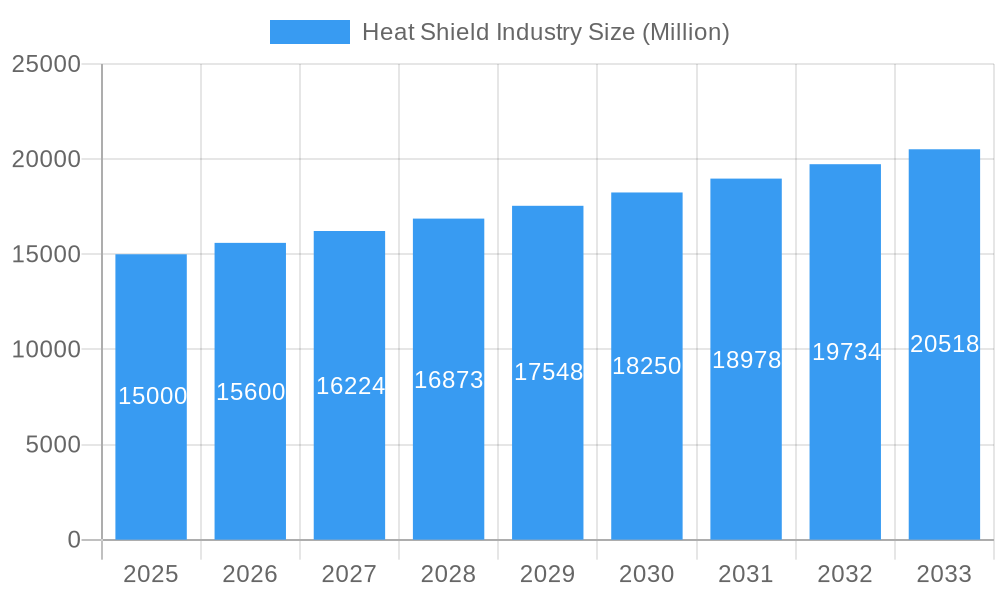
Heat Shield Industry Market Size (In Billion)
Future market expansion hinges on navigating fluctuating raw material costs, potential supply chain disruptions, and evolving regulatory standards. The transition to electric and hybrid vehicles presents both challenges and opportunities. While electric vehicles possess distinct thermal management needs, the demand for heat shields in battery thermal management systems may partially offset declines in traditional internal combustion engine applications. Manufacturers are proactively developing specialized heat shield solutions for these emerging technologies. Continuous innovation in materials and design will be paramount for maintaining a competitive edge and meeting the evolving requirements of the automotive sector, including the integration of advanced driver-assistance systems (ADAS) and autonomous driving technologies.
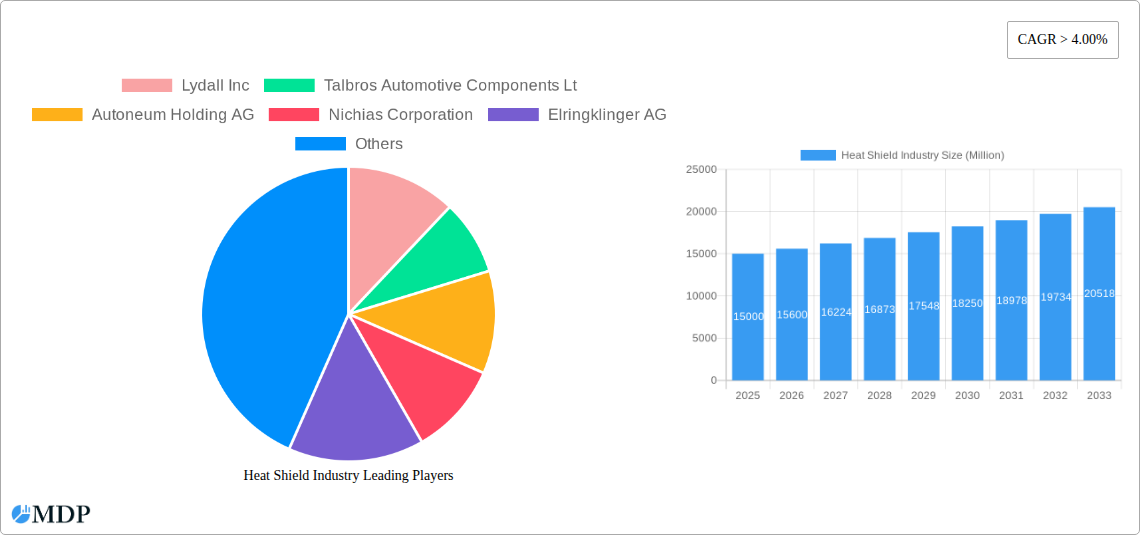
Heat Shield Industry Company Market Share
Heat Shield Market Analysis: Forecast 2025-2033
This comprehensive report delivers an in-depth analysis of the global heat shield market, covering market dynamics, key players, technological advancements, and future growth prospects. The market was valued at approximately $5.18 billion in the base year of 2025 and is projected to reach substantial figures by 2033, demonstrating a CAGR of 5.5%. This analysis spans the period from 2019 to 2033, with 2025 serving as the base and estimated year. Leading industry players such as Lydall Inc, Talbros Automotive Components Ltd, Autoneum Holding AG, Nichias Corporation, Elringklinger AG, Morgan Advanced Materials, Dana Incorporated, and Federal-Mogul Corporation are thoroughly examined. The market is segmented by type (Engine Compartment, Exhaust Compartment, Other Types), vehicle type (Passenger Cars, Commercial Vehicles), and sales channel (OEMs, Aftermarket).
Heat Shield Industry Market Dynamics & Concentration
The global heat shield market is characterized by moderate concentration, with a few major players holding significant market share. The combined market share of the top five companies is estimated at xx%. However, the market exhibits a fragmented landscape with several smaller regional players. Market growth is driven by the increasing demand for fuel efficiency and vehicle safety. Stringent emission regulations globally mandate the use of heat shields to optimize engine performance and reduce heat dissipation. The industry is witnessing significant innovation, with companies focusing on lightweight, high-performance materials to enhance fuel efficiency.
Several factors influence market dynamics:
- Innovation Drivers: Lightweight materials, advanced manufacturing techniques, and improved thermal performance are key innovation drivers.
- Regulatory Frameworks: Stringent emission regulations and safety standards drive adoption.
- Product Substitutes: Limited viable substitutes currently exist, though research into alternative materials is ongoing.
- End-User Trends: The rising demand for electric and hybrid vehicles fuels the need for enhanced thermal management solutions.
- M&A Activities: The number of M&A deals in the heat shield industry has remained steady in recent years, at approximately xx deals annually in the historical period. This trend suggests consolidation and expansion within the industry.
Heat Shield Industry Industry Trends & Analysis
The heat shield industry is experiencing robust growth, primarily driven by the expanding automotive sector and increasing adoption of advanced driver-assistance systems (ADAS). The growing preference for lightweight vehicles, coupled with strict emission norms, necessitates the use of efficient heat shields. Technological advancements, like the development of advanced materials (e.g., ZircoFlex SHIELD) and manufacturing processes, are boosting market expansion. The industry's competitive landscape is dynamic, with existing players focusing on strategic partnerships and product diversification to enhance their market share. Consumer preference shifts towards fuel-efficient and environmentally friendly vehicles are further catalyzing market growth. The market is expected to continue its growth trajectory, with the global market reaching USD XX million by 2033.
Leading Markets & Segments in Heat Shield Industry
The passenger car segment dominates the heat shield market, accounting for approximately xx% of the total market share in 2024. The OEM sales channel also holds a significant share, reflecting the dominance of original equipment manufacturers in supplying heat shields. Geographically, the Asia-Pacific region is projected to be the leading market during the forecast period due to factors like:
- Economic Policies: Government initiatives promoting automotive manufacturing and fuel efficiency standards.
- Infrastructure: Expanding automotive infrastructure and rising vehicle production capacity in countries like China and India.
The dominance of the passenger car segment is attributed to the high volume of passenger vehicle production globally. The OEM channel is prominent due to the long-term contracts and strong relationships established between heat shield manufacturers and automotive OEMs.
- By Type: Engine compartment heat shields hold the largest market share, followed by exhaust compartment and other types.
- By Vehicle Type: Passenger cars dominate, followed by commercial vehicles.
- By Sales Channel: OEMs comprise the largest sales channel, followed by the aftermarket.
Heat Shield Industry Product Developments
Recent product innovations focus on lighter weight, improved thermal performance, and enhanced durability. Zircotec's ZircoFlex SHIELD, launched in March 2021, showcases this trend with its reported 40% lower weight and 46% lower volume compared to competitors. The market also sees increasing use of composite materials and advanced manufacturing techniques to meet the demands for improved thermal management in electric vehicles. These developments reflect the industry's focus on meeting stringent automotive industry standards and customer demands for advanced performance characteristics.
Key Drivers of Heat Shield Industry Growth
Several factors contribute to the growth of the heat shield industry:
- Technological Advancements: Development of lightweight, high-performance materials, and efficient manufacturing processes.
- Economic Growth: Expanding automotive sector globally, particularly in developing economies.
- Regulatory Compliance: Stringent emission regulations and safety standards mandate the use of heat shields. The introduction of stricter regulations, especially concerning greenhouse gas emissions, is driving adoption.
Challenges in the Heat Shield Industry Market
The heat shield industry faces several challenges, including:
- Fluctuating Raw Material Prices: Increased cost of raw materials can affect profitability.
- Supply Chain Disruptions: Global supply chain issues can impact production and timely delivery.
- Intense Competition: The presence of numerous players leads to intense competition, impacting pricing and margins.
Emerging Opportunities in Heat Shield Industry
Significant opportunities exist in the heat shield industry, particularly in the burgeoning electric vehicle (EV) sector, where advanced thermal management solutions are crucial. Partnerships with automotive OEMs to develop customized solutions and explore new markets in developing economies present further potential for growth. Advancements in materials science and manufacturing techniques will continue to unlock new opportunities for innovation and market expansion.
Leading Players in the Heat Shield Industry Sector
- Lydall Inc
- Talbros Automotive Components Ltd
- Autoneum Holding AG
- Nichias Corporation
- Elringklinger AG
- Morgan Advanced Materials
- Dana Incorporated
- Federal-Mogul Corporation
Key Milestones in Heat Shield Industry Industry
- March 2021: Zircotec launched ZircoFlex SHIELD, a lighter and more thermally efficient heat shield. This launch significantly impacted the market by introducing a product with superior performance characteristics.
- [Specific Month and Year, if available]: DuPont invested USD 30 million in a new manufacturing facility in China for thermal interface materials used in EV battery thermal management. This investment signals a significant shift toward supporting the growing electric vehicle market.
Strategic Outlook for Heat Shield Industry Market
The heat shield industry is poised for sustained growth, driven by the expanding automotive sector, especially the EV market. Companies focused on innovation, strategic partnerships, and efficient supply chains are well-positioned to capitalize on emerging opportunities. The increasing demand for lightweight, high-performance heat shields, coupled with stringent emission regulations, presents a favorable outlook for the industry's long-term growth.
Heat Shield Industry Segmentation
-
1. Type
- 1.1. Engine Compartment
- 1.2. Exhaust Compartment
- 1.3. Other Types
-
2. Vehicle Type
- 2.1. Passenger Cars
- 2.2. Commercial Vehicles
-
3. Sales Channel
- 3.1. OEMs
- 3.2. Aftermarket
Heat Shield Industry Segmentation By Geography
-
1. North America
- 1.1. United States
- 1.2. Canada
- 1.3. Rest of North America
-
2. Europe
- 2.1. Germany
- 2.2. United Kingdom
- 2.3. France
- 2.4. Spain
- 2.5. Rest of Europe
-
3. Asia Pacific
- 3.1. India
- 3.2. China
- 3.3. Japan
- 3.4. South Korea
- 3.5. Rest of Asia Pacific
-
4. South America
- 4.1. Brazil
- 4.2. Argentina
- 4.3. Rest of South America
- 5. Middle East
-
6. United Arab Emirates
- 6.1. Saudi Arabia
- 6.2. Rest of Middle East
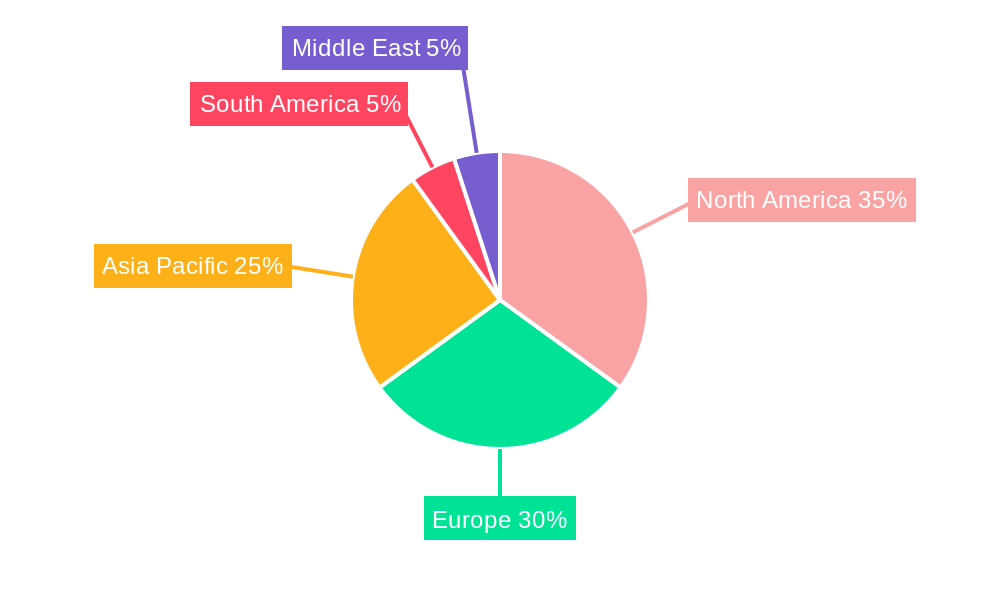
Heat Shield Industry Regional Market Share
Geographic Coverage of Heat Shield Industry
Heat Shield Industry REPORT HIGHLIGHTS
| Aspects | Details |
|---|---|
| Study Period | 2020-2034 |
| Base Year | 2025 |
| Estimated Year | 2026 |
| Forecast Period | 2026-2034 |
| Historical Period | 2020-2025 |
| Growth Rate | CAGR of 5.5% from 2020-2034 |
| Segmentation |
|
Table of Contents
- 1. Introduction
- 1.1. Research Scope
- 1.2. Market Segmentation
- 1.3. Research Objective
- 1.4. Definitions and Assumptions
- 2. Executive Summary
- 2.1. Market Snapshot
- 3. Market Dynamics
- 3.1. Market Drivers
- 3.2. Market Restrains
- 3.3. Market Trends
- 3.4. Market Opportunities
- 4. Market Factor Analysis
- 4.1. Porters Five Forces
- 4.1.1. Bargaining Power of Suppliers
- 4.1.2. Bargaining Power of Buyers
- 4.1.3. Threat of New Entrants
- 4.1.4. Threat of Substitutes
- 4.1.5. Competitive Rivalry
- 4.2. PESTEL analysis
- 4.3. BCG Analysis
- 4.3.1. Stars (High Growth, High Market Share)
- 4.3.2. Cash Cows (Low Growth, High Market Share)
- 4.3.3. Question Mark (High Growth, Low Market Share)
- 4.3.4. Dogs (Low Growth, Low Market Share)
- 4.4. Ansoff Matrix Analysis
- 4.5. Supply Chain Analysis
- 4.6. Regulatory Landscape
- 4.7. Current Market Potential and Opportunity Assessment (TAM–SAM–SOM Framework)
- 4.8. MDP Analyst Note
- 4.1. Porters Five Forces
- 5. Market Analysis, Insights and Forecast 2021-2033
- 5.1. Market Analysis, Insights and Forecast - by Type
- 5.1.1. Engine Compartment
- 5.1.2. Exhaust Compartment
- 5.1.3. Other Types
- 5.2. Market Analysis, Insights and Forecast - by Vehicle Type
- 5.2.1. Passenger Cars
- 5.2.2. Commercial Vehicles
- 5.3. Market Analysis, Insights and Forecast - by Sales Channel
- 5.3.1. OEMs
- 5.3.2. Aftermarket
- 5.4. Market Analysis, Insights and Forecast - by Region
- 5.4.1. North America
- 5.4.2. Europe
- 5.4.3. Asia Pacific
- 5.4.4. South America
- 5.4.5. Middle East
- 5.4.6. United Arab Emirates
- 5.1. Market Analysis, Insights and Forecast - by Type
- 6. Global Heat Shield Industry Analysis, Insights and Forecast, 2021-2033
- 6.1. Market Analysis, Insights and Forecast - by Type
- 6.1.1. Engine Compartment
- 6.1.2. Exhaust Compartment
- 6.1.3. Other Types
- 6.2. Market Analysis, Insights and Forecast - by Vehicle Type
- 6.2.1. Passenger Cars
- 6.2.2. Commercial Vehicles
- 6.3. Market Analysis, Insights and Forecast - by Sales Channel
- 6.3.1. OEMs
- 6.3.2. Aftermarket
- 6.1. Market Analysis, Insights and Forecast - by Type
- 7. North America Heat Shield Industry Analysis, Insights and Forecast, 2020-2032
- 7.1. Market Analysis, Insights and Forecast - by Type
- 7.1.1. Engine Compartment
- 7.1.2. Exhaust Compartment
- 7.1.3. Other Types
- 7.2. Market Analysis, Insights and Forecast - by Vehicle Type
- 7.2.1. Passenger Cars
- 7.2.2. Commercial Vehicles
- 7.3. Market Analysis, Insights and Forecast - by Sales Channel
- 7.3.1. OEMs
- 7.3.2. Aftermarket
- 7.1. Market Analysis, Insights and Forecast - by Type
- 8. Europe Heat Shield Industry Analysis, Insights and Forecast, 2020-2032
- 8.1. Market Analysis, Insights and Forecast - by Type
- 8.1.1. Engine Compartment
- 8.1.2. Exhaust Compartment
- 8.1.3. Other Types
- 8.2. Market Analysis, Insights and Forecast - by Vehicle Type
- 8.2.1. Passenger Cars
- 8.2.2. Commercial Vehicles
- 8.3. Market Analysis, Insights and Forecast - by Sales Channel
- 8.3.1. OEMs
- 8.3.2. Aftermarket
- 8.1. Market Analysis, Insights and Forecast - by Type
- 9. Asia Pacific Heat Shield Industry Analysis, Insights and Forecast, 2020-2032
- 9.1. Market Analysis, Insights and Forecast - by Type
- 9.1.1. Engine Compartment
- 9.1.2. Exhaust Compartment
- 9.1.3. Other Types
- 9.2. Market Analysis, Insights and Forecast - by Vehicle Type
- 9.2.1. Passenger Cars
- 9.2.2. Commercial Vehicles
- 9.3. Market Analysis, Insights and Forecast - by Sales Channel
- 9.3.1. OEMs
- 9.3.2. Aftermarket
- 9.1. Market Analysis, Insights and Forecast - by Type
- 10. South America Heat Shield Industry Analysis, Insights and Forecast, 2020-2032
- 10.1. Market Analysis, Insights and Forecast - by Type
- 10.1.1. Engine Compartment
- 10.1.2. Exhaust Compartment
- 10.1.3. Other Types
- 10.2. Market Analysis, Insights and Forecast - by Vehicle Type
- 10.2.1. Passenger Cars
- 10.2.2. Commercial Vehicles
- 10.3. Market Analysis, Insights and Forecast - by Sales Channel
- 10.3.1. OEMs
- 10.3.2. Aftermarket
- 10.1. Market Analysis, Insights and Forecast - by Type
- 11. Middle East Heat Shield Industry Analysis, Insights and Forecast, 2020-2032
- 11.1. Market Analysis, Insights and Forecast - by Type
- 11.1.1. Engine Compartment
- 11.1.2. Exhaust Compartment
- 11.1.3. Other Types
- 11.2. Market Analysis, Insights and Forecast - by Vehicle Type
- 11.2.1. Passenger Cars
- 11.2.2. Commercial Vehicles
- 11.3. Market Analysis, Insights and Forecast - by Sales Channel
- 11.3.1. OEMs
- 11.3.2. Aftermarket
- 11.1. Market Analysis, Insights and Forecast - by Type
- 12. United Arab Emirates Heat Shield Industry Analysis, Insights and Forecast, 2020-2032
- 12.1. Market Analysis, Insights and Forecast - by Type
- 12.1.1. Engine Compartment
- 12.1.2. Exhaust Compartment
- 12.1.3. Other Types
- 12.2. Market Analysis, Insights and Forecast - by Vehicle Type
- 12.2.1. Passenger Cars
- 12.2.2. Commercial Vehicles
- 12.3. Market Analysis, Insights and Forecast - by Sales Channel
- 12.3.1. OEMs
- 12.3.2. Aftermarket
- 12.1. Market Analysis, Insights and Forecast - by Type
- 13. Competitive Analysis
- 13.1. Company Profiles
- 13.1.1 Lydall Inc
- 13.1.1.1. Company Overview
- 13.1.1.2. Products
- 13.1.1.3. Company Financials
- 13.1.1.4. SWOT Analysis
- 13.1.2 Talbros Automotive Components Lt
- 13.1.2.1. Company Overview
- 13.1.2.2. Products
- 13.1.2.3. Company Financials
- 13.1.2.4. SWOT Analysis
- 13.1.3 Autoneum Holding AG
- 13.1.3.1. Company Overview
- 13.1.3.2. Products
- 13.1.3.3. Company Financials
- 13.1.3.4. SWOT Analysis
- 13.1.4 Nichias Corporation
- 13.1.4.1. Company Overview
- 13.1.4.2. Products
- 13.1.4.3. Company Financials
- 13.1.4.4. SWOT Analysis
- 13.1.5 Elringklinger AG
- 13.1.5.1. Company Overview
- 13.1.5.2. Products
- 13.1.5.3. Company Financials
- 13.1.5.4. SWOT Analysis
- 13.1.6 Morgan Advanced Materials
- 13.1.6.1. Company Overview
- 13.1.6.2. Products
- 13.1.6.3. Company Financials
- 13.1.6.4. SWOT Analysis
- 13.1.7 Dana Incorporated
- 13.1.7.1. Company Overview
- 13.1.7.2. Products
- 13.1.7.3. Company Financials
- 13.1.7.4. SWOT Analysis
- 13.1.8 Federal-Mogul Corporation
- 13.1.8.1. Company Overview
- 13.1.8.2. Products
- 13.1.8.3. Company Financials
- 13.1.8.4. SWOT Analysis
- 13.1.1 Lydall Inc
- 13.2. Market Entropy
- 13.2.1 Company's Key Areas Served
- 13.2.2 Recent Developments
- 13.3. Company Market Share Analysis 2025
- 13.3.1 Top 5 Companies Market Share Analysis
- 13.3.2 Top 3 Companies Market Share Analysis
- 13.4. List of Potential Customers
- 14. Research Methodology
List of Figures
- Figure 1: Global Heat Shield Industry Revenue Breakdown (billion, %) by Region 2025 & 2033
- Figure 2: North America Heat Shield Industry Revenue (billion), by Type 2025 & 2033
- Figure 3: North America Heat Shield Industry Revenue Share (%), by Type 2025 & 2033
- Figure 4: North America Heat Shield Industry Revenue (billion), by Vehicle Type 2025 & 2033
- Figure 5: North America Heat Shield Industry Revenue Share (%), by Vehicle Type 2025 & 2033
- Figure 6: North America Heat Shield Industry Revenue (billion), by Sales Channel 2025 & 2033
- Figure 7: North America Heat Shield Industry Revenue Share (%), by Sales Channel 2025 & 2033
- Figure 8: North America Heat Shield Industry Revenue (billion), by Country 2025 & 2033
- Figure 9: North America Heat Shield Industry Revenue Share (%), by Country 2025 & 2033
- Figure 10: Europe Heat Shield Industry Revenue (billion), by Type 2025 & 2033
- Figure 11: Europe Heat Shield Industry Revenue Share (%), by Type 2025 & 2033
- Figure 12: Europe Heat Shield Industry Revenue (billion), by Vehicle Type 2025 & 2033
- Figure 13: Europe Heat Shield Industry Revenue Share (%), by Vehicle Type 2025 & 2033
- Figure 14: Europe Heat Shield Industry Revenue (billion), by Sales Channel 2025 & 2033
- Figure 15: Europe Heat Shield Industry Revenue Share (%), by Sales Channel 2025 & 2033
- Figure 16: Europe Heat Shield Industry Revenue (billion), by Country 2025 & 2033
- Figure 17: Europe Heat Shield Industry Revenue Share (%), by Country 2025 & 2033
- Figure 18: Asia Pacific Heat Shield Industry Revenue (billion), by Type 2025 & 2033
- Figure 19: Asia Pacific Heat Shield Industry Revenue Share (%), by Type 2025 & 2033
- Figure 20: Asia Pacific Heat Shield Industry Revenue (billion), by Vehicle Type 2025 & 2033
- Figure 21: Asia Pacific Heat Shield Industry Revenue Share (%), by Vehicle Type 2025 & 2033
- Figure 22: Asia Pacific Heat Shield Industry Revenue (billion), by Sales Channel 2025 & 2033
- Figure 23: Asia Pacific Heat Shield Industry Revenue Share (%), by Sales Channel 2025 & 2033
- Figure 24: Asia Pacific Heat Shield Industry Revenue (billion), by Country 2025 & 2033
- Figure 25: Asia Pacific Heat Shield Industry Revenue Share (%), by Country 2025 & 2033
- Figure 26: South America Heat Shield Industry Revenue (billion), by Type 2025 & 2033
- Figure 27: South America Heat Shield Industry Revenue Share (%), by Type 2025 & 2033
- Figure 28: South America Heat Shield Industry Revenue (billion), by Vehicle Type 2025 & 2033
- Figure 29: South America Heat Shield Industry Revenue Share (%), by Vehicle Type 2025 & 2033
- Figure 30: South America Heat Shield Industry Revenue (billion), by Sales Channel 2025 & 2033
- Figure 31: South America Heat Shield Industry Revenue Share (%), by Sales Channel 2025 & 2033
- Figure 32: South America Heat Shield Industry Revenue (billion), by Country 2025 & 2033
- Figure 33: South America Heat Shield Industry Revenue Share (%), by Country 2025 & 2033
- Figure 34: Middle East Heat Shield Industry Revenue (billion), by Type 2025 & 2033
- Figure 35: Middle East Heat Shield Industry Revenue Share (%), by Type 2025 & 2033
- Figure 36: Middle East Heat Shield Industry Revenue (billion), by Vehicle Type 2025 & 2033
- Figure 37: Middle East Heat Shield Industry Revenue Share (%), by Vehicle Type 2025 & 2033
- Figure 38: Middle East Heat Shield Industry Revenue (billion), by Sales Channel 2025 & 2033
- Figure 39: Middle East Heat Shield Industry Revenue Share (%), by Sales Channel 2025 & 2033
- Figure 40: Middle East Heat Shield Industry Revenue (billion), by Country 2025 & 2033
- Figure 41: Middle East Heat Shield Industry Revenue Share (%), by Country 2025 & 2033
- Figure 42: United Arab Emirates Heat Shield Industry Revenue (billion), by Type 2025 & 2033
- Figure 43: United Arab Emirates Heat Shield Industry Revenue Share (%), by Type 2025 & 2033
- Figure 44: United Arab Emirates Heat Shield Industry Revenue (billion), by Vehicle Type 2025 & 2033
- Figure 45: United Arab Emirates Heat Shield Industry Revenue Share (%), by Vehicle Type 2025 & 2033
- Figure 46: United Arab Emirates Heat Shield Industry Revenue (billion), by Sales Channel 2025 & 2033
- Figure 47: United Arab Emirates Heat Shield Industry Revenue Share (%), by Sales Channel 2025 & 2033
- Figure 48: United Arab Emirates Heat Shield Industry Revenue (billion), by Country 2025 & 2033
- Figure 49: United Arab Emirates Heat Shield Industry Revenue Share (%), by Country 2025 & 2033
List of Tables
- Table 1: Global Heat Shield Industry Revenue billion Forecast, by Type 2020 & 2033
- Table 2: Global Heat Shield Industry Revenue billion Forecast, by Vehicle Type 2020 & 2033
- Table 3: Global Heat Shield Industry Revenue billion Forecast, by Sales Channel 2020 & 2033
- Table 4: Global Heat Shield Industry Revenue billion Forecast, by Region 2020 & 2033
- Table 5: Global Heat Shield Industry Revenue billion Forecast, by Type 2020 & 2033
- Table 6: Global Heat Shield Industry Revenue billion Forecast, by Vehicle Type 2020 & 2033
- Table 7: Global Heat Shield Industry Revenue billion Forecast, by Sales Channel 2020 & 2033
- Table 8: Global Heat Shield Industry Revenue billion Forecast, by Country 2020 & 2033
- Table 9: United States Heat Shield Industry Revenue (billion) Forecast, by Application 2020 & 2033
- Table 10: Canada Heat Shield Industry Revenue (billion) Forecast, by Application 2020 & 2033
- Table 11: Rest of North America Heat Shield Industry Revenue (billion) Forecast, by Application 2020 & 2033
- Table 12: Global Heat Shield Industry Revenue billion Forecast, by Type 2020 & 2033
- Table 13: Global Heat Shield Industry Revenue billion Forecast, by Vehicle Type 2020 & 2033
- Table 14: Global Heat Shield Industry Revenue billion Forecast, by Sales Channel 2020 & 2033
- Table 15: Global Heat Shield Industry Revenue billion Forecast, by Country 2020 & 2033
- Table 16: Germany Heat Shield Industry Revenue (billion) Forecast, by Application 2020 & 2033
- Table 17: United Kingdom Heat Shield Industry Revenue (billion) Forecast, by Application 2020 & 2033
- Table 18: France Heat Shield Industry Revenue (billion) Forecast, by Application 2020 & 2033
- Table 19: Spain Heat Shield Industry Revenue (billion) Forecast, by Application 2020 & 2033
- Table 20: Rest of Europe Heat Shield Industry Revenue (billion) Forecast, by Application 2020 & 2033
- Table 21: Global Heat Shield Industry Revenue billion Forecast, by Type 2020 & 2033
- Table 22: Global Heat Shield Industry Revenue billion Forecast, by Vehicle Type 2020 & 2033
- Table 23: Global Heat Shield Industry Revenue billion Forecast, by Sales Channel 2020 & 2033
- Table 24: Global Heat Shield Industry Revenue billion Forecast, by Country 2020 & 2033
- Table 25: India Heat Shield Industry Revenue (billion) Forecast, by Application 2020 & 2033
- Table 26: China Heat Shield Industry Revenue (billion) Forecast, by Application 2020 & 2033
- Table 27: Japan Heat Shield Industry Revenue (billion) Forecast, by Application 2020 & 2033
- Table 28: South Korea Heat Shield Industry Revenue (billion) Forecast, by Application 2020 & 2033
- Table 29: Rest of Asia Pacific Heat Shield Industry Revenue (billion) Forecast, by Application 2020 & 2033
- Table 30: Global Heat Shield Industry Revenue billion Forecast, by Type 2020 & 2033
- Table 31: Global Heat Shield Industry Revenue billion Forecast, by Vehicle Type 2020 & 2033
- Table 32: Global Heat Shield Industry Revenue billion Forecast, by Sales Channel 2020 & 2033
- Table 33: Global Heat Shield Industry Revenue billion Forecast, by Country 2020 & 2033
- Table 34: Brazil Heat Shield Industry Revenue (billion) Forecast, by Application 2020 & 2033
- Table 35: Argentina Heat Shield Industry Revenue (billion) Forecast, by Application 2020 & 2033
- Table 36: Rest of South America Heat Shield Industry Revenue (billion) Forecast, by Application 2020 & 2033
- Table 37: Global Heat Shield Industry Revenue billion Forecast, by Type 2020 & 2033
- Table 38: Global Heat Shield Industry Revenue billion Forecast, by Vehicle Type 2020 & 2033
- Table 39: Global Heat Shield Industry Revenue billion Forecast, by Sales Channel 2020 & 2033
- Table 40: Global Heat Shield Industry Revenue billion Forecast, by Country 2020 & 2033
- Table 41: Global Heat Shield Industry Revenue billion Forecast, by Type 2020 & 2033
- Table 42: Global Heat Shield Industry Revenue billion Forecast, by Vehicle Type 2020 & 2033
- Table 43: Global Heat Shield Industry Revenue billion Forecast, by Sales Channel 2020 & 2033
- Table 44: Global Heat Shield Industry Revenue billion Forecast, by Country 2020 & 2033
- Table 45: Saudi Arabia Heat Shield Industry Revenue (billion) Forecast, by Application 2020 & 2033
- Table 46: Rest of Middle East Heat Shield Industry Revenue (billion) Forecast, by Application 2020 & 2033
Frequently Asked Questions
1. What is the projected Compound Annual Growth Rate (CAGR) of the Heat Shield Industry?
The projected CAGR is approximately 5.5%.
2. Which companies are prominent players in the Heat Shield Industry?
Key companies in the market include Lydall Inc, Talbros Automotive Components Lt, Autoneum Holding AG, Nichias Corporation, Elringklinger AG, Morgan Advanced Materials, Dana Incorporated, Federal-Mogul Corporation.
3. What are the main segments of the Heat Shield Industry?
The market segments include Type, Vehicle Type, Sales Channel.
4. Can you provide details about the market size?
The market size is estimated to be USD 5.18 billion as of 2022.
5. What are some drivers contributing to market growth?
Rising Demand for Small Boats; Expanding Recreational Boating Opportunities.
6. What are the notable trends driving market growth?
High Cost of Heat Shield in Aftermarket and Increasing Electric Vehicle Sales Restraining the Market Growth.
7. Are there any restraints impacting market growth?
Strict Emission Norms for Recreation Boats Likely to Have Negative Impact.
8. Can you provide examples of recent developments in the market?
In March 2021, Zircotec launched ZircoFlex SHIELD. ZircoFlex SHIELD reportedly achieves better thermal performance at 40% lower weight and 46% lower volume than competing heat-shield products.
9. What pricing options are available for accessing the report?
Pricing options include single-user, multi-user, and enterprise licenses priced at USD 4750, USD 5250, and USD 8750 respectively.
10. Is the market size provided in terms of value or volume?
The market size is provided in terms of value, measured in billion.
11. Are there any specific market keywords associated with the report?
Yes, the market keyword associated with the report is "Heat Shield Industry," which aids in identifying and referencing the specific market segment covered.
12. How do I determine which pricing option suits my needs best?
The pricing options vary based on user requirements and access needs. Individual users may opt for single-user licenses, while businesses requiring broader access may choose multi-user or enterprise licenses for cost-effective access to the report.
13. Are there any additional resources or data provided in the Heat Shield Industry report?
While the report offers comprehensive insights, it's advisable to review the specific contents or supplementary materials provided to ascertain if additional resources or data are available.
14. How can I stay updated on further developments or reports in the Heat Shield Industry?
To stay informed about further developments, trends, and reports in the Heat Shield Industry, consider subscribing to industry newsletters, following relevant companies and organizations, or regularly checking reputable industry news sources and publications.
Methodology
Step 1 - Identification of Relevant Samples Size from Population Database


Step 2 - Approaches for Defining Global Market Size (Value, Volume* & Price*)

Note*: In applicable scenarios
Step 3 - Data Sources
Primary Research
- Web Analytics
- Survey Reports
- Research Institute
- Latest Research Reports
- Opinion Leaders
Secondary Research
- Annual Reports
- White Paper
- Latest Press Release
- Industry Association
- Paid Database
- Investor Presentations

Step 4 - Data Triangulation
Involves using different sources of information in order to increase the validity of a study
These sources are likely to be stakeholders in a program - participants, other researchers, program staff, other community members, and so on.
Then we put all data in single framework & apply various statistical tools to find out the dynamic on the market.
During the analysis stage, feedback from the stakeholder groups would be compared to determine areas of agreement as well as areas of divergence