

Key Insights
The Fuel Cell Electric Bus (FCEB) market is experiencing substantial growth, driven by heightened concerns over urban air quality and greenhouse gas emissions. The market is projected for robust expansion, with an estimated Compound Annual Growth Rate (CAGR) of 27.85%. This growth is supported by government initiatives promoting sustainable transport, stringent emission standards, and increasing demand for eco-friendly public transit solutions in metropolitan areas. The market is segmented by application (intercity and intracity) and bus type (new hydrogen buses and retrofitted hydrogen buses). While new hydrogen buses currently lead, retrofitting existing diesel buses presents a cost-effective entry point for FCEB adoption, especially for smaller operators. Leading companies such as Ballard Power Systems and Hino Motors are at the forefront of FCEB technology development and deployment. Geographically, North America, Europe, and Asia-Pacific demonstrate significant growth potential, influenced by supportive government policies and infrastructure development. Despite challenges like high initial investment and limited refueling infrastructure, ongoing technological advancements and regulatory support are expected to propel considerable market expansion. The current market size is estimated at 501 million, with a base year of 2023.
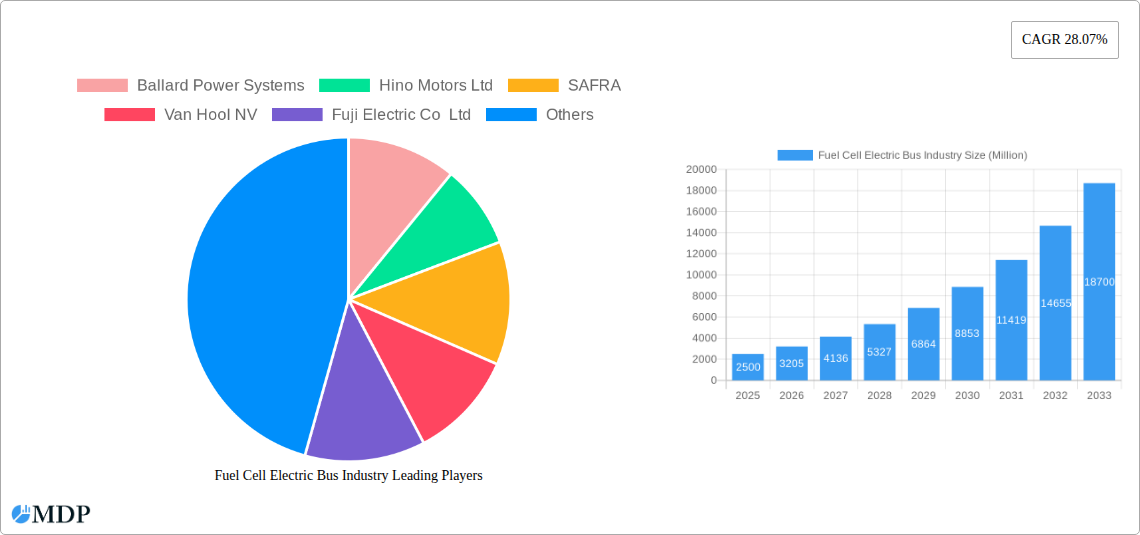
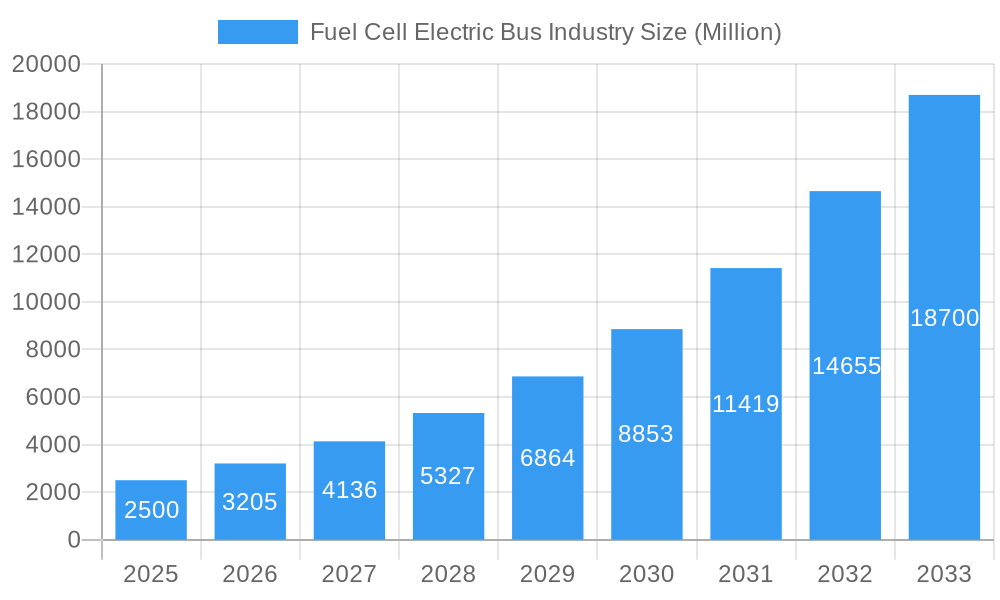
Fuel Cell Electric Bus Industry Market Size (In Million)
The FCEB market's competitive environment features a blend of established automotive manufacturers and specialized fuel cell technology providers, fostering innovation and technology maturation. Future market success depends on addressing challenges in hydrogen production and distribution, cost optimization, and fuel cell system durability. Continued research and development focused on enhancing fuel cell efficiency, lowering manufacturing expenses, and expanding refueling networks will be critical for unlocking greater market potential and achieving widespread FCEB adoption for a sustainable transportation future. Emerging markets in Asia-Pacific and other regions present significant expansion opportunities for industry players.
Fuel Cell Electric Bus Industry Company Market Share
Fuel Cell Electric Bus Industry: A Comprehensive Market Report (2019-2033)
This in-depth report provides a comprehensive analysis of the Fuel Cell Electric Bus industry, encompassing market dynamics, key players, technological advancements, and future growth prospects. The study period covers 2019-2033, with a base year of 2025 and a forecast period of 2025-2033. We project a xx Million market value by 2033, driven by increasing environmental concerns and supportive government policies. This report is essential for industry stakeholders, investors, and anyone seeking to understand this rapidly evolving sector.
Fuel Cell Electric Bus Industry Market Dynamics & Concentration
The fuel cell electric bus market is experiencing significant growth, fueled by stringent emission regulations, rising fuel costs, and the increasing adoption of sustainable transportation solutions. Market concentration is currently moderate, with several key players vying for market share. However, strategic partnerships and mergers & acquisitions (M&A) are reshaping the competitive landscape. We estimate a xx% market share for the top 5 players in 2025.
- Market Concentration: Moderate, with a trend towards consolidation.
- Innovation Drivers: Government incentives, technological advancements in fuel cell technology, and the need for sustainable transportation.
- Regulatory Frameworks: Stringent emission regulations in several regions are driving the adoption of fuel cell buses.
- Product Substitutes: Battery electric buses (BEBs) pose a significant competitive threat, though fuel cell buses offer advantages in terms of range and refueling time.
- End-User Trends: Transit authorities are increasingly incorporating fuel cell buses into their fleets due to their operational efficiency and environmental benefits.
- M&A Activities: A significant number of M&A deals (xx in 2022) have been observed in recent years, primarily driven by the consolidation of technology and manufacturing capabilities.
Fuel Cell Electric Bus Industry Industry Trends & Analysis
The fuel cell electric bus market is witnessing robust growth, with a projected Compound Annual Growth Rate (CAGR) of xx% during the forecast period (2025-2033). This growth is being driven by factors such as government support through subsidies and tax incentives, increasing environmental awareness among consumers, and technological advancements that are improving the efficiency and cost-effectiveness of fuel cell technology. Market penetration is expected to reach xx% by 2033, largely concentrated in developed economies. Technological disruptions, such as improved fuel cell stack efficiency and advancements in hydrogen storage, are further accelerating market growth. Competitive dynamics are characterized by intense competition among established players and the emergence of new entrants, prompting innovation and strategic partnerships.
Leading Markets & Segments in Fuel Cell Electric Bus Industry
The leading market segment is expected to be the Intracity application, followed by Intercity, driven primarily by the high passenger volume in urban areas and the increasing need for cleaner public transportation. New Hydrogen Buses currently dominate the Bus Type segment, but Retrofitted Hydrogen Buses are expected to witness increasing adoption as the technology matures. China and Europe are the leading geographical markets.
- Key Drivers for Intracity dominance: High passenger volume, government initiatives promoting clean public transportation, and well-established public transport infrastructure.
- Key Drivers for New Hydrogen Buses dominance: Superior performance compared to retrofitted buses and the initial cost-benefit favoring new build.
- Dominance Analysis: China's strong government support and proactive policies, coupled with Europe's stringent emission regulations and focus on green technologies, have established these regions as leaders in fuel cell bus deployment.
Fuel Cell Electric Bus Industry Product Developments
Recent product developments have focused on improving fuel cell efficiency, increasing bus range, reducing refueling time, and enhancing overall operational reliability. The introduction of models like New Flyer's Xcelsior CHARGE FC showcases advancements in fuel cell technology integration and demonstrates compliance with stringent testing standards. The development of hydrogen fuel cell journey coaches specifically designed for the European market signifies the industry's responsiveness to regional regulations and market demand.
Key Drivers of Fuel Cell Electric Bus Industry Growth
Several factors are driving the growth of the fuel cell electric bus market:
- Technological Advancements: Improvements in fuel cell efficiency, hydrogen storage, and overall system durability.
- Economic Incentives: Government subsidies, tax breaks, and other financial incentives are making fuel cell buses more affordable.
- Stringent Emission Regulations: Governments are increasingly imposing stricter emission standards, making fuel cell buses a more attractive option.
Challenges in the Fuel Cell Electric Bus Industry Market
Significant hurdles remain:
- High Initial Costs: Fuel cell buses are still more expensive than traditional diesel buses.
- Hydrogen Infrastructure: Lack of widespread hydrogen refueling infrastructure limits the adoption of fuel cell buses.
- Supply Chain Bottlenecks: Production capacity constraints and supply chain disruptions can impact the availability of fuel cell buses.
Emerging Opportunities in Fuel Cell Electric Bus Industry
The long-term growth outlook is positive:
- Technological breakthroughs are likely to significantly reduce costs and improve performance.
- Strategic partnerships between fuel cell manufacturers, bus manufacturers, and hydrogen infrastructure developers will expand market reach.
- Expansion into new markets, particularly in developing countries with growing urbanization, presents significant opportunities.
Leading Players in the Fuel Cell Electric Bus Industry Sector
- Ballard Power Systems
- Hino Motors Ltd
- SAFRA
- Van Hool NV
- Fuji Electric Co Ltd
- IVECO Group
- EvoBus GmbH
- NovaBus Corporation
- Tata Motors Limited
- MAN Truck & Bus SE
- SunLine Transit Agency
- New Flyer Industries Ltd
- Cummins Inc
- Proton Motor Fuel Cell GmbH
- Nuvera Fuel Cells LLC
Key Milestones in Fuel Cell Electric Bus Industry Industry
- September 2022: New Flyer unveils the Xcelsior CHARGE FC fuel cell bus, featuring Ballard Power Systems' fuel cell module. This signifies a significant step towards commercially viable fuel cell bus technology.
- September 2022: Guangdong Sino-Synergy Hydrogen Technology Co., Ltd. introduces the first "Hydrogen Fuel Cell Journey Coach" in Europe, highlighting the growing international collaboration in the sector.
- September 2022: Marcopolo showcases its first hydrogen-powered bus at IAA Transportation 2022, signaling the increasing participation of major players in the bus manufacturing industry.
Strategic Outlook for Fuel Cell Electric Bus Industry Market
The fuel cell electric bus market is poised for substantial growth over the next decade. Continued technological advancements, coupled with supportive government policies and increasing environmental awareness, will drive market expansion. Strategic partnerships and investments in hydrogen infrastructure will play a crucial role in accelerating market adoption. The market presents significant opportunities for players who can effectively address the challenges related to cost, infrastructure, and supply chain.
Fuel Cell Electric Bus Industry Segmentation
-
1. Application
- 1.1. Intercity
- 1.2. Intracity
-
2. Bus Type
- 2.1. New Hydrogen Buses
- 2.2. Retrofitted Hydrogen Buses
Fuel Cell Electric Bus Industry Segmentation By Geography
-
1. North America
- 1.1. United States
- 1.2. Canada
- 1.3. Mexico
- 1.4. Rest of North America
-
2. Europe
- 2.1. Germany
- 2.2. United Kingdom
- 2.3. France
- 2.4. Italy
- 2.5. Spain
- 2.6. Rest of Europe
-
3. Asia Pacific
- 3.1. India
- 3.2. China
- 3.3. South Korea
- 3.4. Japan
- 3.5. Rest of Asia Pacific
-
4. Rest of the World
- 4.1. South America
- 4.2. Middle East and Africa

Fuel Cell Electric Bus Industry Regional Market Share
Geographic Coverage of Fuel Cell Electric Bus Industry
Fuel Cell Electric Bus Industry REPORT HIGHLIGHTS
| Aspects | Details |
|---|---|
| Study Period | 2020-2034 |
| Base Year | 2025 |
| Estimated Year | 2026 |
| Forecast Period | 2026-2034 |
| Historical Period | 2020-2025 |
| Growth Rate | CAGR of 27.85% from 2020-2034 |
| Segmentation |
|
Table of Contents
- 1. Introduction
- 1.1. Research Scope
- 1.2. Market Segmentation
- 1.3. Research Objective
- 1.4. Definitions and Assumptions
- 2. Executive Summary
- 2.1. Market Snapshot
- 3. Market Dynamics
- 3.1. Market Drivers
- 3.2. Market Restrains
- 3.3. Market Trends
- 3.4. Market Opportunities
- 4. Market Factor Analysis
- 4.1. Porters Five Forces
- 4.1.1. Bargaining Power of Suppliers
- 4.1.2. Bargaining Power of Buyers
- 4.1.3. Threat of New Entrants
- 4.1.4. Threat of Substitutes
- 4.1.5. Competitive Rivalry
- 4.2. PESTEL analysis
- 4.3. BCG Analysis
- 4.3.1. Stars (High Growth, High Market Share)
- 4.3.2. Cash Cows (Low Growth, High Market Share)
- 4.3.3. Question Mark (High Growth, Low Market Share)
- 4.3.4. Dogs (Low Growth, Low Market Share)
- 4.4. Ansoff Matrix Analysis
- 4.5. Supply Chain Analysis
- 4.6. Regulatory Landscape
- 4.7. Current Market Potential and Opportunity Assessment (TAM–SAM–SOM Framework)
- 4.8. MDP Analyst Note
- 4.1. Porters Five Forces
- 5. Market Analysis, Insights and Forecast 2021-2033
- 5.1. Market Analysis, Insights and Forecast - by Application
- 5.1.1. Intercity
- 5.1.2. Intracity
- 5.2. Market Analysis, Insights and Forecast - by Bus Type
- 5.2.1. New Hydrogen Buses
- 5.2.2. Retrofitted Hydrogen Buses
- 5.3. Market Analysis, Insights and Forecast - by Region
- 5.3.1. North America
- 5.3.2. Europe
- 5.3.3. Asia Pacific
- 5.3.4. Rest of the World
- 5.1. Market Analysis, Insights and Forecast - by Application
- 6. Global Fuel Cell Electric Bus Industry Analysis, Insights and Forecast, 2021-2033
- 6.1. Market Analysis, Insights and Forecast - by Application
- 6.1.1. Intercity
- 6.1.2. Intracity
- 6.2. Market Analysis, Insights and Forecast - by Bus Type
- 6.2.1. New Hydrogen Buses
- 6.2.2. Retrofitted Hydrogen Buses
- 6.1. Market Analysis, Insights and Forecast - by Application
- 7. North America Fuel Cell Electric Bus Industry Analysis, Insights and Forecast, 2020-2032
- 7.1. Market Analysis, Insights and Forecast - by Application
- 7.1.1. Intercity
- 7.1.2. Intracity
- 7.2. Market Analysis, Insights and Forecast - by Bus Type
- 7.2.1. New Hydrogen Buses
- 7.2.2. Retrofitted Hydrogen Buses
- 7.1. Market Analysis, Insights and Forecast - by Application
- 8. Europe Fuel Cell Electric Bus Industry Analysis, Insights and Forecast, 2020-2032
- 8.1. Market Analysis, Insights and Forecast - by Application
- 8.1.1. Intercity
- 8.1.2. Intracity
- 8.2. Market Analysis, Insights and Forecast - by Bus Type
- 8.2.1. New Hydrogen Buses
- 8.2.2. Retrofitted Hydrogen Buses
- 8.1. Market Analysis, Insights and Forecast - by Application
- 9. Asia Pacific Fuel Cell Electric Bus Industry Analysis, Insights and Forecast, 2020-2032
- 9.1. Market Analysis, Insights and Forecast - by Application
- 9.1.1. Intercity
- 9.1.2. Intracity
- 9.2. Market Analysis, Insights and Forecast - by Bus Type
- 9.2.1. New Hydrogen Buses
- 9.2.2. Retrofitted Hydrogen Buses
- 9.1. Market Analysis, Insights and Forecast - by Application
- 10. Rest of the World Fuel Cell Electric Bus Industry Analysis, Insights and Forecast, 2020-2032
- 10.1. Market Analysis, Insights and Forecast - by Application
- 10.1.1. Intercity
- 10.1.2. Intracity
- 10.2. Market Analysis, Insights and Forecast - by Bus Type
- 10.2.1. New Hydrogen Buses
- 10.2.2. Retrofitted Hydrogen Buses
- 10.1. Market Analysis, Insights and Forecast - by Application
- 11. Competitive Analysis
- 11.1. Company Profiles
- 11.1.1 Ballard Power Systems
- 11.1.1.1. Company Overview
- 11.1.1.2. Products
- 11.1.1.3. Company Financials
- 11.1.1.4. SWOT Analysis
- 11.1.2 Hino Motors Ltd
- 11.1.2.1. Company Overview
- 11.1.2.2. Products
- 11.1.2.3. Company Financials
- 11.1.2.4. SWOT Analysis
- 11.1.3 SAFRA
- 11.1.3.1. Company Overview
- 11.1.3.2. Products
- 11.1.3.3. Company Financials
- 11.1.3.4. SWOT Analysis
- 11.1.4 Van Hool NV
- 11.1.4.1. Company Overview
- 11.1.4.2. Products
- 11.1.4.3. Company Financials
- 11.1.4.4. SWOT Analysis
- 11.1.5 Fuji Electric Co Ltd
- 11.1.5.1. Company Overview
- 11.1.5.2. Products
- 11.1.5.3. Company Financials
- 11.1.5.4. SWOT Analysis
- 11.1.6 IVECO Group
- 11.1.6.1. Company Overview
- 11.1.6.2. Products
- 11.1.6.3. Company Financials
- 11.1.6.4. SWOT Analysis
- 11.1.7 EvoBus GmbH
- 11.1.7.1. Company Overview
- 11.1.7.2. Products
- 11.1.7.3. Company Financials
- 11.1.7.4. SWOT Analysis
- 11.1.8 NovaBus Corporation
- 11.1.8.1. Company Overview
- 11.1.8.2. Products
- 11.1.8.3. Company Financials
- 11.1.8.4. SWOT Analysis
- 11.1.9 Tata Motors Limited
- 11.1.9.1. Company Overview
- 11.1.9.2. Products
- 11.1.9.3. Company Financials
- 11.1.9.4. SWOT Analysis
- 11.1.10 MAN Truck & Bus SE
- 11.1.10.1. Company Overview
- 11.1.10.2. Products
- 11.1.10.3. Company Financials
- 11.1.10.4. SWOT Analysis
- 11.1.11 SunLine Transit Agency *List Not Exhaustive
- 11.1.11.1. Company Overview
- 11.1.11.2. Products
- 11.1.11.3. Company Financials
- 11.1.11.4. SWOT Analysis
- 11.1.12 New Flyer Industries Ltd
- 11.1.12.1. Company Overview
- 11.1.12.2. Products
- 11.1.12.3. Company Financials
- 11.1.12.4. SWOT Analysis
- 11.1.13 Cummins Inc
- 11.1.13.1. Company Overview
- 11.1.13.2. Products
- 11.1.13.3. Company Financials
- 11.1.13.4. SWOT Analysis
- 11.1.14 Proton Motor Fuel Cell GmbH
- 11.1.14.1. Company Overview
- 11.1.14.2. Products
- 11.1.14.3. Company Financials
- 11.1.14.4. SWOT Analysis
- 11.1.15 Nuvera Fuel Cells LLC
- 11.1.15.1. Company Overview
- 11.1.15.2. Products
- 11.1.15.3. Company Financials
- 11.1.15.4. SWOT Analysis
- 11.1.1 Ballard Power Systems
- 11.2. Market Entropy
- 11.2.1 Company's Key Areas Served
- 11.2.2 Recent Developments
- 11.3. Company Market Share Analysis 2025
- 11.3.1 Top 5 Companies Market Share Analysis
- 11.3.2 Top 3 Companies Market Share Analysis
- 11.4. List of Potential Customers
- 12. Research Methodology
List of Figures
- Figure 1: Global Fuel Cell Electric Bus Industry Revenue Breakdown (million, %) by Region 2025 & 2033
- Figure 2: North America Fuel Cell Electric Bus Industry Revenue (million), by Application 2025 & 2033
- Figure 3: North America Fuel Cell Electric Bus Industry Revenue Share (%), by Application 2025 & 2033
- Figure 4: North America Fuel Cell Electric Bus Industry Revenue (million), by Bus Type 2025 & 2033
- Figure 5: North America Fuel Cell Electric Bus Industry Revenue Share (%), by Bus Type 2025 & 2033
- Figure 6: North America Fuel Cell Electric Bus Industry Revenue (million), by Country 2025 & 2033
- Figure 7: North America Fuel Cell Electric Bus Industry Revenue Share (%), by Country 2025 & 2033
- Figure 8: Europe Fuel Cell Electric Bus Industry Revenue (million), by Application 2025 & 2033
- Figure 9: Europe Fuel Cell Electric Bus Industry Revenue Share (%), by Application 2025 & 2033
- Figure 10: Europe Fuel Cell Electric Bus Industry Revenue (million), by Bus Type 2025 & 2033
- Figure 11: Europe Fuel Cell Electric Bus Industry Revenue Share (%), by Bus Type 2025 & 2033
- Figure 12: Europe Fuel Cell Electric Bus Industry Revenue (million), by Country 2025 & 2033
- Figure 13: Europe Fuel Cell Electric Bus Industry Revenue Share (%), by Country 2025 & 2033
- Figure 14: Asia Pacific Fuel Cell Electric Bus Industry Revenue (million), by Application 2025 & 2033
- Figure 15: Asia Pacific Fuel Cell Electric Bus Industry Revenue Share (%), by Application 2025 & 2033
- Figure 16: Asia Pacific Fuel Cell Electric Bus Industry Revenue (million), by Bus Type 2025 & 2033
- Figure 17: Asia Pacific Fuel Cell Electric Bus Industry Revenue Share (%), by Bus Type 2025 & 2033
- Figure 18: Asia Pacific Fuel Cell Electric Bus Industry Revenue (million), by Country 2025 & 2033
- Figure 19: Asia Pacific Fuel Cell Electric Bus Industry Revenue Share (%), by Country 2025 & 2033
- Figure 20: Rest of the World Fuel Cell Electric Bus Industry Revenue (million), by Application 2025 & 2033
- Figure 21: Rest of the World Fuel Cell Electric Bus Industry Revenue Share (%), by Application 2025 & 2033
- Figure 22: Rest of the World Fuel Cell Electric Bus Industry Revenue (million), by Bus Type 2025 & 2033
- Figure 23: Rest of the World Fuel Cell Electric Bus Industry Revenue Share (%), by Bus Type 2025 & 2033
- Figure 24: Rest of the World Fuel Cell Electric Bus Industry Revenue (million), by Country 2025 & 2033
- Figure 25: Rest of the World Fuel Cell Electric Bus Industry Revenue Share (%), by Country 2025 & 2033
List of Tables
- Table 1: Global Fuel Cell Electric Bus Industry Revenue million Forecast, by Application 2020 & 2033
- Table 2: Global Fuel Cell Electric Bus Industry Revenue million Forecast, by Bus Type 2020 & 2033
- Table 3: Global Fuel Cell Electric Bus Industry Revenue million Forecast, by Region 2020 & 2033
- Table 4: Global Fuel Cell Electric Bus Industry Revenue million Forecast, by Application 2020 & 2033
- Table 5: Global Fuel Cell Electric Bus Industry Revenue million Forecast, by Bus Type 2020 & 2033
- Table 6: Global Fuel Cell Electric Bus Industry Revenue million Forecast, by Country 2020 & 2033
- Table 7: United States Fuel Cell Electric Bus Industry Revenue (million) Forecast, by Application 2020 & 2033
- Table 8: Canada Fuel Cell Electric Bus Industry Revenue (million) Forecast, by Application 2020 & 2033
- Table 9: Mexico Fuel Cell Electric Bus Industry Revenue (million) Forecast, by Application 2020 & 2033
- Table 10: Rest of North America Fuel Cell Electric Bus Industry Revenue (million) Forecast, by Application 2020 & 2033
- Table 11: Global Fuel Cell Electric Bus Industry Revenue million Forecast, by Application 2020 & 2033
- Table 12: Global Fuel Cell Electric Bus Industry Revenue million Forecast, by Bus Type 2020 & 2033
- Table 13: Global Fuel Cell Electric Bus Industry Revenue million Forecast, by Country 2020 & 2033
- Table 14: Germany Fuel Cell Electric Bus Industry Revenue (million) Forecast, by Application 2020 & 2033
- Table 15: United Kingdom Fuel Cell Electric Bus Industry Revenue (million) Forecast, by Application 2020 & 2033
- Table 16: France Fuel Cell Electric Bus Industry Revenue (million) Forecast, by Application 2020 & 2033
- Table 17: Italy Fuel Cell Electric Bus Industry Revenue (million) Forecast, by Application 2020 & 2033
- Table 18: Spain Fuel Cell Electric Bus Industry Revenue (million) Forecast, by Application 2020 & 2033
- Table 19: Rest of Europe Fuel Cell Electric Bus Industry Revenue (million) Forecast, by Application 2020 & 2033
- Table 20: Global Fuel Cell Electric Bus Industry Revenue million Forecast, by Application 2020 & 2033
- Table 21: Global Fuel Cell Electric Bus Industry Revenue million Forecast, by Bus Type 2020 & 2033
- Table 22: Global Fuel Cell Electric Bus Industry Revenue million Forecast, by Country 2020 & 2033
- Table 23: India Fuel Cell Electric Bus Industry Revenue (million) Forecast, by Application 2020 & 2033
- Table 24: China Fuel Cell Electric Bus Industry Revenue (million) Forecast, by Application 2020 & 2033
- Table 25: South Korea Fuel Cell Electric Bus Industry Revenue (million) Forecast, by Application 2020 & 2033
- Table 26: Japan Fuel Cell Electric Bus Industry Revenue (million) Forecast, by Application 2020 & 2033
- Table 27: Rest of Asia Pacific Fuel Cell Electric Bus Industry Revenue (million) Forecast, by Application 2020 & 2033
- Table 28: Global Fuel Cell Electric Bus Industry Revenue million Forecast, by Application 2020 & 2033
- Table 29: Global Fuel Cell Electric Bus Industry Revenue million Forecast, by Bus Type 2020 & 2033
- Table 30: Global Fuel Cell Electric Bus Industry Revenue million Forecast, by Country 2020 & 2033
- Table 31: South America Fuel Cell Electric Bus Industry Revenue (million) Forecast, by Application 2020 & 2033
- Table 32: Middle East and Africa Fuel Cell Electric Bus Industry Revenue (million) Forecast, by Application 2020 & 2033
Frequently Asked Questions
1. What is the projected Compound Annual Growth Rate (CAGR) of the Fuel Cell Electric Bus Industry?
The projected CAGR is approximately 27.85%.
2. Which companies are prominent players in the Fuel Cell Electric Bus Industry?
Key companies in the market include Ballard Power Systems, Hino Motors Ltd, SAFRA, Van Hool NV, Fuji Electric Co Ltd, IVECO Group, EvoBus GmbH, NovaBus Corporation, Tata Motors Limited, MAN Truck & Bus SE, SunLine Transit Agency *List Not Exhaustive, New Flyer Industries Ltd, Cummins Inc, Proton Motor Fuel Cell GmbH, Nuvera Fuel Cells LLC.
3. What are the main segments of the Fuel Cell Electric Bus Industry?
The market segments include Application, Bus Type.
4. Can you provide details about the market size?
The market size is estimated to be USD 501 million as of 2022.
5. What are some drivers contributing to market growth?
Increase in Passenger Car Sales Propelling Market Growth.
6. What are the notable trends driving market growth?
Emission Concerns and Increasing Hydrogen Bus Testing Fueling Market Demand.
7. Are there any restraints impacting market growth?
Fluctuation in Raw Material Prices.
8. Can you provide examples of recent developments in the market?
In September 2022, The Xcelsior CHARGE FC fuel cell bus model from New Flyer, which features a fuel cell module from Ballard Power Systems and a Siemens ELFA 3 driveline, was unveiled . The model is similar to the Xcelsior CHARGE H2, and it comes in both 40-foot and 60-foot lengths. Both of these models pass the Federal Transit Administration Model Bus Testing Program in Altoona, Pennsylvania.
9. What pricing options are available for accessing the report?
Pricing options include single-user, multi-user, and enterprise licenses priced at USD 4750, USD 5250, and USD 8750 respectively.
10. Is the market size provided in terms of value or volume?
The market size is provided in terms of value, measured in million.
11. Are there any specific market keywords associated with the report?
Yes, the market keyword associated with the report is "Fuel Cell Electric Bus Industry," which aids in identifying and referencing the specific market segment covered.
12. How do I determine which pricing option suits my needs best?
The pricing options vary based on user requirements and access needs. Individual users may opt for single-user licenses, while businesses requiring broader access may choose multi-user or enterprise licenses for cost-effective access to the report.
13. Are there any additional resources or data provided in the Fuel Cell Electric Bus Industry report?
While the report offers comprehensive insights, it's advisable to review the specific contents or supplementary materials provided to ascertain if additional resources or data are available.
14. How can I stay updated on further developments or reports in the Fuel Cell Electric Bus Industry?
To stay informed about further developments, trends, and reports in the Fuel Cell Electric Bus Industry, consider subscribing to industry newsletters, following relevant companies and organizations, or regularly checking reputable industry news sources and publications.
Methodology
Step 1 - Identification of Relevant Samples Size from Population Database


Step 2 - Approaches for Defining Global Market Size (Value, Volume* & Price*)

Note*: In applicable scenarios
Step 3 - Data Sources
Primary Research
- Web Analytics
- Survey Reports
- Research Institute
- Latest Research Reports
- Opinion Leaders
Secondary Research
- Annual Reports
- White Paper
- Latest Press Release
- Industry Association
- Paid Database
- Investor Presentations

Step 4 - Data Triangulation
Involves using different sources of information in order to increase the validity of a study
These sources are likely to be stakeholders in a program - participants, other researchers, program staff, other community members, and so on.
Then we put all data in single framework & apply various statistical tools to find out the dynamic on the market.
During the analysis stage, feedback from the stakeholder groups would be compared to determine areas of agreement as well as areas of divergence