

Key Insights
The Flue Gas Desulfurization (FGD) Systems market is poised for significant expansion, propelled by increasingly stringent environmental regulations mandating the reduction of sulfur dioxide (SO2) emissions from key industrial sectors, including power generation and cement manufacturing. Projections indicate a compound annual growth rate (CAGR) of 13.06%, highlighting robust market momentum. The market size was valued at 9.55 billion in the base year 2025 and is anticipated to grow substantially. Key growth drivers include a global surge in air quality improvement initiatives and the escalating demand for cleaner energy solutions. The increasing adoption of highly efficient wet FGD systems, which outperform dry FGD systems in SO2 removal, is a notable market trend. However, substantial initial investment costs for FGD system installation, alongside ongoing operational and maintenance expenditures, present market challenges. The power generation sector dominates the market share, reflecting its significant contribution to SO2 emissions. Geographically, North America and Asia-Pacific are current market leaders, with the Middle East and Africa expected to experience considerable growth fueled by industrialization and power infrastructure investments.
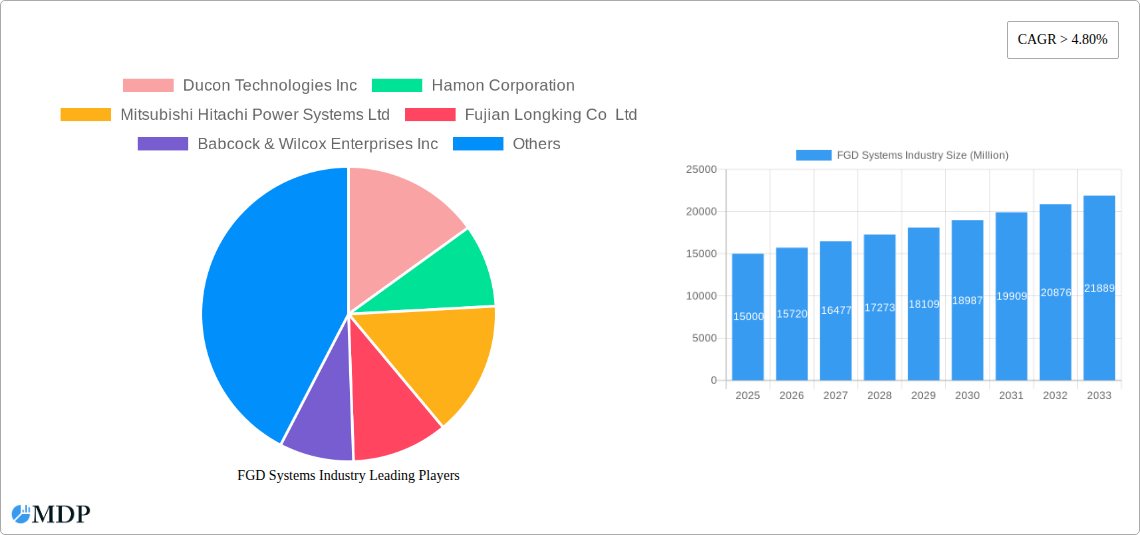
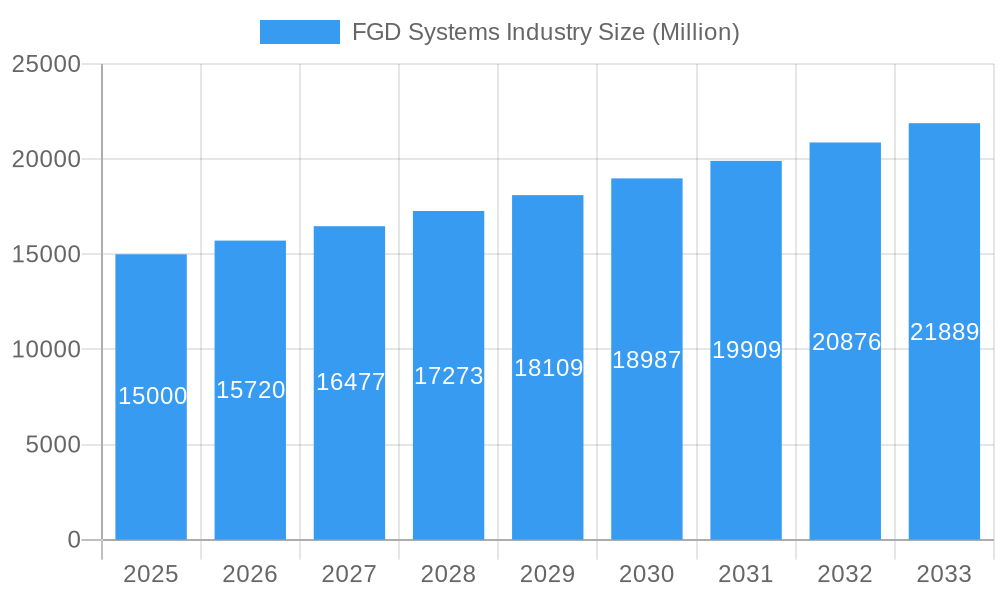
FGD Systems Industry Market Size (In Billion)
The outlook for the FGD Systems market remains highly positive, with sustained growth driven by heightened awareness of air pollution's adverse impacts on public health and the environment. This growing consciousness fuels demand for advanced emission control technologies. While upfront costs are a consideration, the long-term advantages of improved air quality and regulatory compliance provide compelling incentives for adoption. Future market developments are expected to focus on technological innovations that enhance efficiency, lower operational expenses, and promote sustainable solutions. Geographic market penetration is set to increase, particularly in developing economies undergoing rapid industrialization and requiring robust emission control infrastructure. This continuous expansion will be supported by governmental policies, tighter environmental mandates, and a growing commitment to corporate social responsibility, solidifying FGD systems' role in a sustainable energy future.
FGD Systems Industry Company Market Share
FGD Systems Industry Market Report: 2019-2033 - A Comprehensive Analysis
Uncover lucrative opportunities and navigate the complexities of the FGD Systems market with this in-depth report, projecting a market value exceeding $XX Million by 2033. This comprehensive study provides a granular analysis of the FGD Systems industry, encompassing market dynamics, leading players, emerging trends, and future growth prospects. The report covers the period 2019-2033, with a focus on the 2025-2033 forecast period, offering invaluable insights for strategic decision-making.
FGD Systems Industry Market Dynamics & Concentration
The FGD Systems market, valued at $XX Million in 2025, is characterized by a moderately concentrated landscape with key players like Ducon Technologies Inc, Hamon Corporation, Mitsubishi Hitachi Power Systems Ltd, Fujian Longking Co Ltd, Babcock & Wilcox Enterprises Inc, Thermax Ltd, John Wood Group PLC, Alstom S.A., General Electric Company, and Andritz AG holding significant market share. Market concentration is expected to remain relatively stable throughout the forecast period, although potential M&A activity could reshape the competitive dynamics. Innovation in areas like dry FGD systems and advanced materials is driving market growth. Stringent environmental regulations, particularly concerning SO2 emissions, are strong catalysts. Product substitutes, such as alternative emission control technologies, pose a moderate competitive threat. End-user trends indicate a growing preference for more efficient and environmentally friendly FGD systems.
- Market Share (2025): Ducon Technologies Inc (XX%), Hamon Corporation (XX%), Mitsubishi Hitachi Power Systems Ltd (XX%), Others (XX%)
- M&A Activity (2019-2024): XX deals, primarily focused on technology acquisition and market expansion.
- Innovation Drivers: Development of advanced materials, improved efficiency, and integration with digital technologies.
- Regulatory Framework: Stringent environmental regulations globally driving demand.
FGD Systems Industry Industry Trends & Analysis
The FGD Systems market is projected to experience a Compound Annual Growth Rate (CAGR) of XX% from 2025 to 2033, reaching a market value exceeding $XX Million. This robust growth is driven by the increasing global focus on reducing SO2 emissions from power generation, cement, chemical, and other industrial processes. Technological advancements, such as the development of more efficient and cost-effective dry FGD systems, are further boosting market expansion. The market penetration of FGD systems in emerging economies is also expected to rise significantly. Consumer preferences are shifting towards environmentally sustainable solutions, fueling demand for advanced FGD technologies. Competitive dynamics are characterized by intense rivalry among established players and the emergence of new entrants offering innovative solutions.
Leading Markets & Segments in FGD Systems Industry
The Power Generation segment currently dominates the FGD Systems market, accounting for XX% of the total revenue in 2025. However, the Chemical and Cement segments are exhibiting significant growth potential. Geographically, Asia-Pacific is currently the leading market, driven by rapid industrialization and stringent emission control regulations.
Key Drivers in Asia-Pacific:
- Rapid growth in power generation capacity.
- Increasing adoption of stringent environmental regulations.
- Growing investments in infrastructure projects.
Dominance Analysis: Asia-Pacific's dominance stems from a confluence of factors including its large industrial base, expanding power generation capacity, and strict environmental policies. The region's robust economic growth fuels significant investment in emission control technologies, making it the primary market for FGD systems.
Type: Wet FGD remains dominant in 2025, accounting for XX% of the market due to its established technology and effectiveness. Dry FGD, however, is gaining traction, expected to grow at a higher CAGR due to its lower water consumption and operational costs.
End-User Industry: Power Generation is the largest end-user segment, accounting for XX% of market share, followed by Cement and Chemical industries.
FGD Systems Industry Product Developments
Recent product innovations focus on enhancing efficiency, reducing operational costs, and minimizing environmental impact. Dry FGD systems are gaining prominence due to their reduced water consumption and lower maintenance requirements. Companies are integrating advanced control systems and digital technologies to optimize system performance and reduce energy consumption. These improvements enhance the market competitiveness of FGD systems, driving widespread adoption across diverse industries.
Key Drivers of FGD Systems Industry Growth
The FGD Systems market growth is propelled by several factors: stringent environmental regulations mandating SO2 emission reductions, increasing industrialization and power generation capacity in developing economies, technological advancements leading to more efficient and cost-effective systems, and growing awareness of environmental sustainability among industrial stakeholders. Government incentives and subsidies for cleaner technologies further contribute to market expansion.
Challenges in the FGD Systems Industry Market
The FGD Systems industry faces several challenges: high initial investment costs, complexities in installation and maintenance, potential supply chain disruptions impacting component availability, and competition from alternative emission control technologies. Regulatory uncertainties in some regions also pose a challenge to market expansion. The fluctuating prices of raw materials further contribute to cost pressures on manufacturers.
Emerging Opportunities in FGD Systems Industry
The FGD Systems industry presents several exciting opportunities. Technological breakthroughs in dry FGD and hybrid systems offer avenues for enhanced efficiency and cost reduction. Strategic partnerships and collaborations among manufacturers, technology providers, and end-users can unlock new market segments. Expansion into emerging economies with stringent environmental regulations presents substantial growth prospects.
Leading Players in the FGD Systems Industry Sector
Key Milestones in FGD Systems Industry Industry
- 2020: Introduction of a new dry FGD system with enhanced efficiency by Ducon Technologies Inc.
- 2021: Merger between two smaller FGD system providers, leading to increased market share.
- 2022: Launch of a government initiative promoting the adoption of FGD systems in a specific region.
- 2023: Significant investment in R&D by major players for advanced FGD technologies.
- 2024: Introduction of new environmental regulations further driving demand for FGD systems.
Strategic Outlook for FGD Systems Industry Market
The FGD Systems market is poised for continued growth driven by technological advancements, increasing environmental regulations, and growing industrialization. Companies focusing on innovation, strategic partnerships, and expansion into emerging markets are well-positioned to capitalize on the considerable growth potential. The market is expected to witness increased consolidation through mergers and acquisitions, as companies seek to enhance their market share and technological capabilities.
FGD Systems Industry Segmentation
-
1. Type
- 1.1. Dry FGD
- 1.2. Wet FGD
-
2. End-User Industry
- 2.1. Power Generation
- 2.2. Cement
- 2.3. Chemical
- 2.4. Iron and Steel
- 2.5. Other End-User Industries
FGD Systems Industry Segmentation By Geography
- 1. North America
- 2. Europe
- 3. Asia Pacific
- 4. South America
- 5. Middle East and Africa
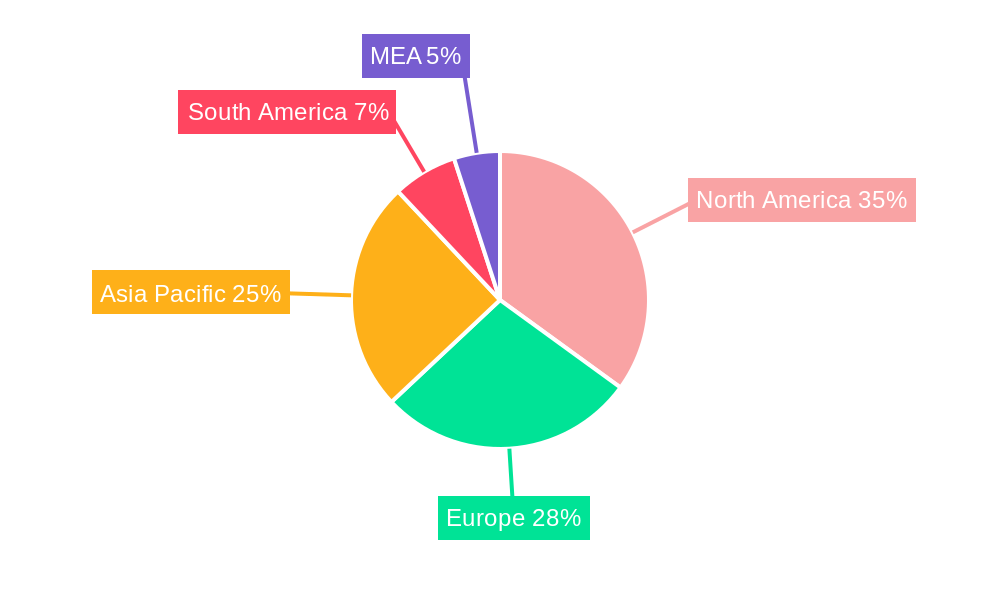
FGD Systems Industry Regional Market Share
Geographic Coverage of FGD Systems Industry
FGD Systems Industry REPORT HIGHLIGHTS
| Aspects | Details |
|---|---|
| Study Period | 2020-2034 |
| Base Year | 2025 |
| Estimated Year | 2026 |
| Forecast Period | 2026-2034 |
| Historical Period | 2020-2025 |
| Growth Rate | CAGR of 13.06% from 2020-2034 |
| Segmentation |
|
Table of Contents
- 1. Introduction
- 1.1. Research Scope
- 1.2. Market Segmentation
- 1.3. Research Objective
- 1.4. Definitions and Assumptions
- 2. Executive Summary
- 2.1. Market Snapshot
- 3. Market Dynamics
- 3.1. Market Drivers
- 3.2. Market Restrains
- 3.3. Market Trends
- 3.4. Market Opportunities
- 4. Market Factor Analysis
- 4.1. Porters Five Forces
- 4.1.1. Bargaining Power of Suppliers
- 4.1.2. Bargaining Power of Buyers
- 4.1.3. Threat of New Entrants
- 4.1.4. Threat of Substitutes
- 4.1.5. Competitive Rivalry
- 4.2. PESTEL analysis
- 4.3. BCG Analysis
- 4.3.1. Stars (High Growth, High Market Share)
- 4.3.2. Cash Cows (Low Growth, High Market Share)
- 4.3.3. Question Mark (High Growth, Low Market Share)
- 4.3.4. Dogs (Low Growth, Low Market Share)
- 4.4. Ansoff Matrix Analysis
- 4.5. Supply Chain Analysis
- 4.6. Regulatory Landscape
- 4.7. Current Market Potential and Opportunity Assessment (TAM–SAM–SOM Framework)
- 4.8. MDP Analyst Note
- 4.1. Porters Five Forces
- 5. Market Analysis, Insights and Forecast 2021-2033
- 5.1. Market Analysis, Insights and Forecast - by Type
- 5.1.1. Dry FGD
- 5.1.2. Wet FGD
- 5.2. Market Analysis, Insights and Forecast - by End-User Industry
- 5.2.1. Power Generation
- 5.2.2. Cement
- 5.2.3. Chemical
- 5.2.4. Iron and Steel
- 5.2.5. Other End-User Industries
- 5.3. Market Analysis, Insights and Forecast - by Region
- 5.3.1. North America
- 5.3.2. Europe
- 5.3.3. Asia Pacific
- 5.3.4. South America
- 5.3.5. Middle East and Africa
- 5.1. Market Analysis, Insights and Forecast - by Type
- 6. Global FGD Systems Industry Analysis, Insights and Forecast, 2021-2033
- 6.1. Market Analysis, Insights and Forecast - by Type
- 6.1.1. Dry FGD
- 6.1.2. Wet FGD
- 6.2. Market Analysis, Insights and Forecast - by End-User Industry
- 6.2.1. Power Generation
- 6.2.2. Cement
- 6.2.3. Chemical
- 6.2.4. Iron and Steel
- 6.2.5. Other End-User Industries
- 6.1. Market Analysis, Insights and Forecast - by Type
- 7. North America FGD Systems Industry Analysis, Insights and Forecast, 2020-2032
- 7.1. Market Analysis, Insights and Forecast - by Type
- 7.1.1. Dry FGD
- 7.1.2. Wet FGD
- 7.2. Market Analysis, Insights and Forecast - by End-User Industry
- 7.2.1. Power Generation
- 7.2.2. Cement
- 7.2.3. Chemical
- 7.2.4. Iron and Steel
- 7.2.5. Other End-User Industries
- 7.1. Market Analysis, Insights and Forecast - by Type
- 8. Europe FGD Systems Industry Analysis, Insights and Forecast, 2020-2032
- 8.1. Market Analysis, Insights and Forecast - by Type
- 8.1.1. Dry FGD
- 8.1.2. Wet FGD
- 8.2. Market Analysis, Insights and Forecast - by End-User Industry
- 8.2.1. Power Generation
- 8.2.2. Cement
- 8.2.3. Chemical
- 8.2.4. Iron and Steel
- 8.2.5. Other End-User Industries
- 8.1. Market Analysis, Insights and Forecast - by Type
- 9. Asia Pacific FGD Systems Industry Analysis, Insights and Forecast, 2020-2032
- 9.1. Market Analysis, Insights and Forecast - by Type
- 9.1.1. Dry FGD
- 9.1.2. Wet FGD
- 9.2. Market Analysis, Insights and Forecast - by End-User Industry
- 9.2.1. Power Generation
- 9.2.2. Cement
- 9.2.3. Chemical
- 9.2.4. Iron and Steel
- 9.2.5. Other End-User Industries
- 9.1. Market Analysis, Insights and Forecast - by Type
- 10. South America FGD Systems Industry Analysis, Insights and Forecast, 2020-2032
- 10.1. Market Analysis, Insights and Forecast - by Type
- 10.1.1. Dry FGD
- 10.1.2. Wet FGD
- 10.2. Market Analysis, Insights and Forecast - by End-User Industry
- 10.2.1. Power Generation
- 10.2.2. Cement
- 10.2.3. Chemical
- 10.2.4. Iron and Steel
- 10.2.5. Other End-User Industries
- 10.1. Market Analysis, Insights and Forecast - by Type
- 11. Middle East and Africa FGD Systems Industry Analysis, Insights and Forecast, 2020-2032
- 11.1. Market Analysis, Insights and Forecast - by Type
- 11.1.1. Dry FGD
- 11.1.2. Wet FGD
- 11.2. Market Analysis, Insights and Forecast - by End-User Industry
- 11.2.1. Power Generation
- 11.2.2. Cement
- 11.2.3. Chemical
- 11.2.4. Iron and Steel
- 11.2.5. Other End-User Industries
- 11.1. Market Analysis, Insights and Forecast - by Type
- 12. Competitive Analysis
- 12.1. Company Profiles
- 12.1.1 Ducon Technologies Inc
- 12.1.1.1. Company Overview
- 12.1.1.2. Products
- 12.1.1.3. Company Financials
- 12.1.1.4. SWOT Analysis
- 12.1.2 Hamon Corporation
- 12.1.2.1. Company Overview
- 12.1.2.2. Products
- 12.1.2.3. Company Financials
- 12.1.2.4. SWOT Analysis
- 12.1.3 Mitsubishi Hitachi Power Systems Ltd
- 12.1.3.1. Company Overview
- 12.1.3.2. Products
- 12.1.3.3. Company Financials
- 12.1.3.4. SWOT Analysis
- 12.1.4 Fujian Longking Co Ltd
- 12.1.4.1. Company Overview
- 12.1.4.2. Products
- 12.1.4.3. Company Financials
- 12.1.4.4. SWOT Analysis
- 12.1.5 Babcock & Wilcox Enterprises Inc
- 12.1.5.1. Company Overview
- 12.1.5.2. Products
- 12.1.5.3. Company Financials
- 12.1.5.4. SWOT Analysis
- 12.1.6 Thermax Ltd*List Not Exhaustive
- 12.1.6.1. Company Overview
- 12.1.6.2. Products
- 12.1.6.3. Company Financials
- 12.1.6.4. SWOT Analysis
- 12.1.7 John Wood Group PLC
- 12.1.7.1. Company Overview
- 12.1.7.2. Products
- 12.1.7.3. Company Financials
- 12.1.7.4. SWOT Analysis
- 12.1.8 Alstom S A
- 12.1.8.1. Company Overview
- 12.1.8.2. Products
- 12.1.8.3. Company Financials
- 12.1.8.4. SWOT Analysis
- 12.1.9 General Electric Company
- 12.1.9.1. Company Overview
- 12.1.9.2. Products
- 12.1.9.3. Company Financials
- 12.1.9.4. SWOT Analysis
- 12.1.10 Andritz AG
- 12.1.10.1. Company Overview
- 12.1.10.2. Products
- 12.1.10.3. Company Financials
- 12.1.10.4. SWOT Analysis
- 12.1.1 Ducon Technologies Inc
- 12.2. Market Entropy
- 12.2.1 Company's Key Areas Served
- 12.2.2 Recent Developments
- 12.3. Company Market Share Analysis 2025
- 12.3.1 Top 5 Companies Market Share Analysis
- 12.3.2 Top 3 Companies Market Share Analysis
- 12.4. List of Potential Customers
- 13. Research Methodology
List of Figures
- Figure 1: Global FGD Systems Industry Revenue Breakdown (billion, %) by Region 2025 & 2033
- Figure 2: North America FGD Systems Industry Revenue (billion), by Type 2025 & 2033
- Figure 3: North America FGD Systems Industry Revenue Share (%), by Type 2025 & 2033
- Figure 4: North America FGD Systems Industry Revenue (billion), by End-User Industry 2025 & 2033
- Figure 5: North America FGD Systems Industry Revenue Share (%), by End-User Industry 2025 & 2033
- Figure 6: North America FGD Systems Industry Revenue (billion), by Country 2025 & 2033
- Figure 7: North America FGD Systems Industry Revenue Share (%), by Country 2025 & 2033
- Figure 8: Europe FGD Systems Industry Revenue (billion), by Type 2025 & 2033
- Figure 9: Europe FGD Systems Industry Revenue Share (%), by Type 2025 & 2033
- Figure 10: Europe FGD Systems Industry Revenue (billion), by End-User Industry 2025 & 2033
- Figure 11: Europe FGD Systems Industry Revenue Share (%), by End-User Industry 2025 & 2033
- Figure 12: Europe FGD Systems Industry Revenue (billion), by Country 2025 & 2033
- Figure 13: Europe FGD Systems Industry Revenue Share (%), by Country 2025 & 2033
- Figure 14: Asia Pacific FGD Systems Industry Revenue (billion), by Type 2025 & 2033
- Figure 15: Asia Pacific FGD Systems Industry Revenue Share (%), by Type 2025 & 2033
- Figure 16: Asia Pacific FGD Systems Industry Revenue (billion), by End-User Industry 2025 & 2033
- Figure 17: Asia Pacific FGD Systems Industry Revenue Share (%), by End-User Industry 2025 & 2033
- Figure 18: Asia Pacific FGD Systems Industry Revenue (billion), by Country 2025 & 2033
- Figure 19: Asia Pacific FGD Systems Industry Revenue Share (%), by Country 2025 & 2033
- Figure 20: South America FGD Systems Industry Revenue (billion), by Type 2025 & 2033
- Figure 21: South America FGD Systems Industry Revenue Share (%), by Type 2025 & 2033
- Figure 22: South America FGD Systems Industry Revenue (billion), by End-User Industry 2025 & 2033
- Figure 23: South America FGD Systems Industry Revenue Share (%), by End-User Industry 2025 & 2033
- Figure 24: South America FGD Systems Industry Revenue (billion), by Country 2025 & 2033
- Figure 25: South America FGD Systems Industry Revenue Share (%), by Country 2025 & 2033
- Figure 26: Middle East and Africa FGD Systems Industry Revenue (billion), by Type 2025 & 2033
- Figure 27: Middle East and Africa FGD Systems Industry Revenue Share (%), by Type 2025 & 2033
- Figure 28: Middle East and Africa FGD Systems Industry Revenue (billion), by End-User Industry 2025 & 2033
- Figure 29: Middle East and Africa FGD Systems Industry Revenue Share (%), by End-User Industry 2025 & 2033
- Figure 30: Middle East and Africa FGD Systems Industry Revenue (billion), by Country 2025 & 2033
- Figure 31: Middle East and Africa FGD Systems Industry Revenue Share (%), by Country 2025 & 2033
List of Tables
- Table 1: Global FGD Systems Industry Revenue billion Forecast, by Type 2020 & 2033
- Table 2: Global FGD Systems Industry Revenue billion Forecast, by End-User Industry 2020 & 2033
- Table 3: Global FGD Systems Industry Revenue billion Forecast, by Region 2020 & 2033
- Table 4: Global FGD Systems Industry Revenue billion Forecast, by Type 2020 & 2033
- Table 5: Global FGD Systems Industry Revenue billion Forecast, by End-User Industry 2020 & 2033
- Table 6: Global FGD Systems Industry Revenue billion Forecast, by Country 2020 & 2033
- Table 7: Global FGD Systems Industry Revenue billion Forecast, by Type 2020 & 2033
- Table 8: Global FGD Systems Industry Revenue billion Forecast, by End-User Industry 2020 & 2033
- Table 9: Global FGD Systems Industry Revenue billion Forecast, by Country 2020 & 2033
- Table 10: Global FGD Systems Industry Revenue billion Forecast, by Type 2020 & 2033
- Table 11: Global FGD Systems Industry Revenue billion Forecast, by End-User Industry 2020 & 2033
- Table 12: Global FGD Systems Industry Revenue billion Forecast, by Country 2020 & 2033
- Table 13: Global FGD Systems Industry Revenue billion Forecast, by Type 2020 & 2033
- Table 14: Global FGD Systems Industry Revenue billion Forecast, by End-User Industry 2020 & 2033
- Table 15: Global FGD Systems Industry Revenue billion Forecast, by Country 2020 & 2033
- Table 16: Global FGD Systems Industry Revenue billion Forecast, by Type 2020 & 2033
- Table 17: Global FGD Systems Industry Revenue billion Forecast, by End-User Industry 2020 & 2033
- Table 18: Global FGD Systems Industry Revenue billion Forecast, by Country 2020 & 2033
Frequently Asked Questions
1. What is the projected Compound Annual Growth Rate (CAGR) of the FGD Systems Industry?
The projected CAGR is approximately 13.06%.
2. Which companies are prominent players in the FGD Systems Industry?
Key companies in the market include Ducon Technologies Inc, Hamon Corporation, Mitsubishi Hitachi Power Systems Ltd, Fujian Longking Co Ltd, Babcock & Wilcox Enterprises Inc, Thermax Ltd*List Not Exhaustive, John Wood Group PLC, Alstom S A, General Electric Company, Andritz AG.
3. What are the main segments of the FGD Systems Industry?
The market segments include Type, End-User Industry.
4. Can you provide details about the market size?
The market size is estimated to be USD 9.55 billion as of 2022.
5. What are some drivers contributing to market growth?
4.; Increasing Industrialization across the World4.; Expansion and Development of New Power Plants.
6. What are the notable trends driving market growth?
Increasing Demand from Power Generation Sector.
7. Are there any restraints impacting market growth?
4.; Increasing Adoption of Renewable Energy.
8. Can you provide examples of recent developments in the market?
N/A
9. What pricing options are available for accessing the report?
Pricing options include single-user, multi-user, and enterprise licenses priced at USD 4750, USD 5250, and USD 8750 respectively.
10. Is the market size provided in terms of value or volume?
The market size is provided in terms of value, measured in billion.
11. Are there any specific market keywords associated with the report?
Yes, the market keyword associated with the report is "FGD Systems Industry," which aids in identifying and referencing the specific market segment covered.
12. How do I determine which pricing option suits my needs best?
The pricing options vary based on user requirements and access needs. Individual users may opt for single-user licenses, while businesses requiring broader access may choose multi-user or enterprise licenses for cost-effective access to the report.
13. Are there any additional resources or data provided in the FGD Systems Industry report?
While the report offers comprehensive insights, it's advisable to review the specific contents or supplementary materials provided to ascertain if additional resources or data are available.
14. How can I stay updated on further developments or reports in the FGD Systems Industry?
To stay informed about further developments, trends, and reports in the FGD Systems Industry, consider subscribing to industry newsletters, following relevant companies and organizations, or regularly checking reputable industry news sources and publications.
Methodology
Step 1 - Identification of Relevant Samples Size from Population Database


Step 2 - Approaches for Defining Global Market Size (Value, Volume* & Price*)

Note*: In applicable scenarios
Step 3 - Data Sources
Primary Research
- Web Analytics
- Survey Reports
- Research Institute
- Latest Research Reports
- Opinion Leaders
Secondary Research
- Annual Reports
- White Paper
- Latest Press Release
- Industry Association
- Paid Database
- Investor Presentations

Step 4 - Data Triangulation
Involves using different sources of information in order to increase the validity of a study
These sources are likely to be stakeholders in a program - participants, other researchers, program staff, other community members, and so on.
Then we put all data in single framework & apply various statistical tools to find out the dynamic on the market.
During the analysis stage, feedback from the stakeholder groups would be compared to determine areas of agreement as well as areas of divergence