

Key Insights
The Energy Demand Response Management (DERM) market is experiencing robust growth, projected to reach a substantial size driven by increasing energy costs, growing concerns about grid stability, and the expanding adoption of renewable energy sources. The 26.50% CAGR indicates a significant upward trajectory, fueled by several key market drivers. The rising penetration of smart meters and advanced energy management systems facilitates real-time data analysis and precise load control, enabling efficient demand response strategies. Furthermore, government incentives and regulations promoting energy efficiency and grid modernization are accelerating market expansion. Incentive-based programs, particularly in the commercial and industrial sectors, are proving highly effective in encouraging participation, while price-based programs are gaining traction among residential consumers. Technological advancements, such as the development of sophisticated algorithms for predictive analytics and AI-powered load forecasting, are further enhancing the efficiency and effectiveness of DERM solutions. While the initial investment costs associated with implementing DERM technologies might represent a restraint for some stakeholders, the long-term cost savings and environmental benefits are compelling enough to drive wider adoption. The market is segmented across various demand response types (price-based, incentive-based, direct load control), technologies (smart meters, load control devices, etc.), and applications (residential, commercial, industrial, and transportation). Key players such as Itron Inc., Honeywell International Inc., and ABB Ltd. are actively shaping the market landscape through innovation and strategic partnerships. Geographic expansion is also noteworthy, with North America and Europe currently leading the market, followed by rapid growth in the Asia-Pacific region driven by substantial investments in smart grid infrastructure and increasing energy consumption.
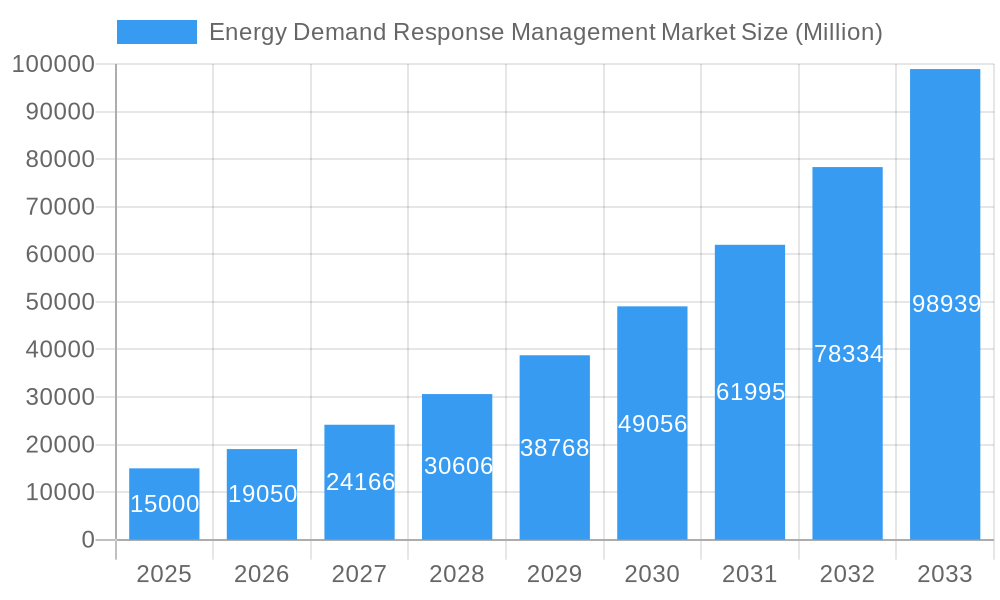
Energy Demand Response Management Market Market Size (In Billion)
The future of the DERM market is bright, with continued technological advancements promising even greater efficiency and cost-effectiveness. The integration of DERM with other smart grid technologies, such as microgrids and distributed generation, will further enhance its capabilities and expand its market potential. The focus is likely to shift towards more sophisticated, AI-driven solutions capable of predicting and managing energy consumption with unparalleled accuracy. Regulatory support, coupled with increasing consumer awareness of energy efficiency and sustainability, will continue to fuel market growth. However, challenges remain, including cybersecurity concerns related to the increasing connectivity of DERM systems and the need to address the digital divide to ensure equitable access to these technologies across different socioeconomic segments. Addressing these challenges effectively will be crucial to ensuring the sustained and inclusive growth of the DERM market in the coming years.
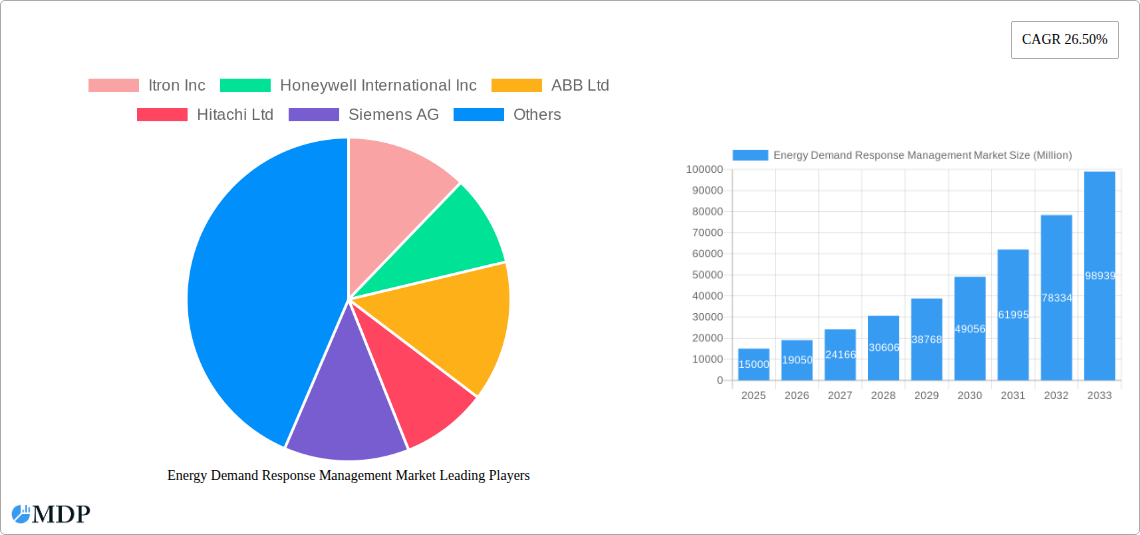
Energy Demand Response Management Market Company Market Share
Energy Demand Response Management Market: A Comprehensive Report (2019-2033)
This comprehensive report provides an in-depth analysis of the Energy Demand Response Management (DR) market, offering invaluable insights for stakeholders across the energy sector. The study period spans from 2019 to 2033, with a base year of 2025 and a forecast period from 2025 to 2033. The report leverages historical data from 2019-2024 to project future market trends accurately. The market is segmented by Type of Demand Response (Price-based, Incentive-based, Direct Load Control), Technology (Smart Meters, Load Control Devices, Energy Management Systems, Demand Response Software), and Application (Residential, Commercial, Industrial, Transportation). Key players such as Itron Inc, Honeywell International Inc, ABB Ltd, Hitachi Ltd, Siemens AG, Mitsubishi Electric Corporation, Autogrid Systems Inc, Schneider Electric SE, Eaton Corporation PLC, and General Electric Company are analyzed for their market share, strategies, and innovation. The market is expected to reach xx Million by 2033, exhibiting a CAGR of xx% during the forecast period.
Energy Demand Response Management Market Dynamics & Concentration
The Energy Demand Response Management market exhibits a moderately consolidated structure, with several established players holding significant market share. Market concentration is influenced by factors like technological advancements, regulatory changes, and mergers & acquisitions (M&A). Innovation plays a crucial role, driving the development of sophisticated energy management systems and demand response software. Stringent regulatory frameworks promoting energy efficiency and grid stability are key drivers. While product substitutes exist (e.g., traditional energy management solutions), the growing need for grid optimization and cost reduction favors the adoption of DR solutions. End-user trends, especially the shift towards smart grids and renewable energy integration, further propel market growth. M&A activities are frequent, with xx M&A deals observed in the historical period (2019-2024), signifying companies' strategic moves to enhance capabilities and expand their market presence. Major players' market share varies based on their technological prowess and geographical reach. For instance, Itron Inc. holds an estimated xx% market share in 2025, while ABB Ltd. commands approximately xx%.
Energy Demand Response Management Market Industry Trends & Analysis
The Energy Demand Response Management market is experiencing substantial growth, fueled by several factors. The increasing adoption of smart grids and renewable energy sources necessitates effective demand management solutions, boosting DR market penetration. Technological advancements, such as the proliferation of smart meters and advanced analytics, are enhancing the efficiency and scalability of DR programs. Consumer preferences are shifting towards sustainable energy solutions, further driving the demand for DR technologies. The competitive landscape is dynamic, with both established players and new entrants vying for market share through product innovation and strategic partnerships. The market exhibited a CAGR of xx% from 2019-2024 and is projected to maintain a CAGR of xx% from 2025-2033, reaching an estimated market size of xx Million by 2033. This growth is predominantly driven by the increasing penetration of smart meters in residential and commercial sectors, which is expected to reach xx% by 2033.
Leading Markets & Segments in Energy Demand Response Management Market
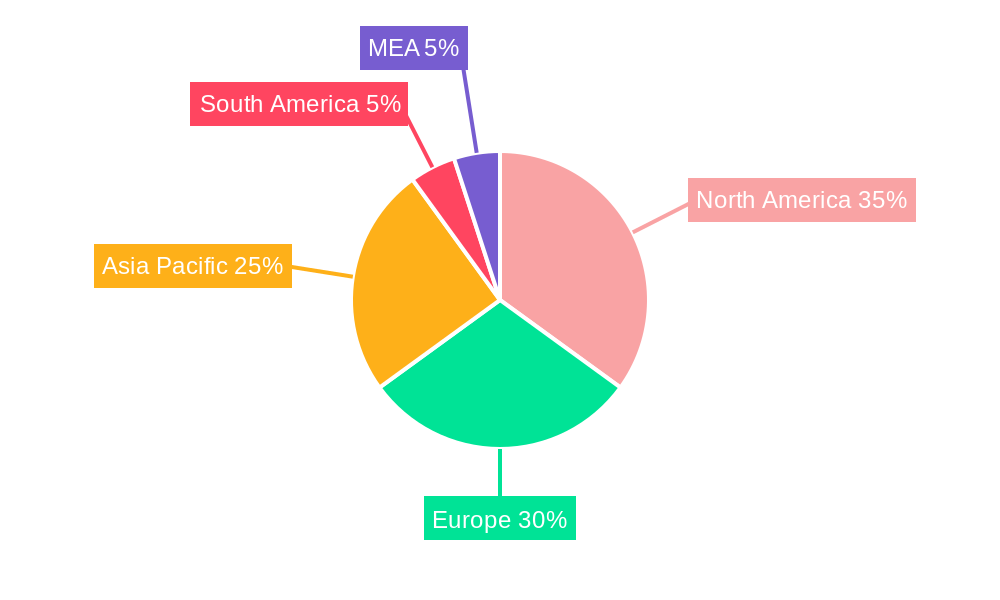
The North American region holds a dominant position in the Energy Demand Response Management market, driven by supportive government policies, robust infrastructure, and a high concentration of technology providers. Within the segments, the commercial sector exhibits the highest growth rate, fueled by the need to optimize energy consumption and reduce operating costs. Among the technologies, smart meters dominate, owing to their widespread deployment and cost-effectiveness. The incentive-based demand response mechanism is most prevalent, driven by the ease of implementation and its effectiveness in encouraging energy conservation.
- Key Drivers for North American Dominance:
- Supportive regulatory frameworks and government incentives.
- Extensive smart grid infrastructure.
- High adoption rate of smart meters.
- Significant investments in renewable energy.
- Commercial Sector Dominance:
- High energy consumption and cost-optimization needs.
- Availability of sophisticated energy management systems.
- Focus on enhancing operational efficiency.
- Incentive-Based Demand Response:
- Ease of implementation and cost-effectiveness.
- High participation rate from consumers and businesses.
- Strong emphasis on energy conservation initiatives.
Energy Demand Response Management Market Product Developments
Recent product developments focus on enhancing the functionalities of existing technologies, such as improving the accuracy and responsiveness of smart meters, integrating advanced analytics into energy management systems, and developing user-friendly interfaces for demand response software. This evolution underscores the trend towards integrating artificial intelligence (AI) and machine learning (ML) to enhance decision-making in demand response programs. This is largely to improve prediction accuracy and optimization of energy consumption patterns, improving cost savings and grid stability.
Key Drivers of Energy Demand Response Management Market Growth
The Energy Demand Response Management market is propelled by several key factors. Stringent environmental regulations driving energy efficiency are paramount. The increasing adoption of renewable energy sources necessitates effective grid management, pushing for DR solutions. Furthermore, technological advancements, such as AI-powered energy management systems, improve accuracy and efficiency. Economic incentives, such as government subsidies and tax breaks, encourage adoption.
Challenges in the Energy Demand Response Management Market
Several challenges hinder market growth. High initial investment costs for smart grid infrastructure and DR technologies can be a barrier for adoption. Regulatory hurdles and variations in policies across different regions create complexity. Furthermore, concerns over data privacy and cybersecurity risks need addressing. Competitive pressures among providers and technological obsolescence are additional hurdles. The lack of standardized communication protocols across different systems adds complexity and can hinder interoperability. This results in slow adoption, particularly among small businesses and residential customers.
Emerging Opportunities in Energy Demand Response Management Market
The integration of blockchain technology for secure and transparent energy transactions presents a significant opportunity. The development of advanced analytics and AI-driven solutions will further enhance the efficiency and effectiveness of DR programs. Strategic partnerships between energy providers and technology companies can accelerate market penetration. Expanding into emerging markets with growing energy demands presents substantial growth potential.
Leading Players in the Energy Demand Response Management Market Sector
Key Milestones in Energy Demand Response Management Market Industry
- 2020: Several countries introduced updated energy efficiency regulations, driving demand for DR solutions.
- 2021: Major technology companies announced partnerships for the development of advanced DR software.
- 2022: Significant investments were made in smart grid infrastructure development.
- 2023: Launch of several new energy management systems with AI capabilities.
- 2024: Increase in M&A activities among key players in the market.
Strategic Outlook for Energy Demand Response Management Market Market
The Energy Demand Response Management market presents a promising outlook, with significant growth potential driven by evolving technological landscapes and supportive government policies. The increasing integration of renewable energy, coupled with the need for grid modernization and resilience, will continue to propel market expansion. Strategic investments in innovation, coupled with strong partnerships and effective market expansion strategies, will allow companies to capitalize on this burgeoning market and achieve sustainable growth in the coming years.
Energy Demand Response Management Market Segmentation
- 1. Production Analysis
- 2. Consumption Analysis
- 3. Import Market Analysis (Value & Volume)
- 4. Export Market Analysis (Value & Volume)
- 5. Price Trend Analysis
Energy Demand Response Management Market Segmentation By Geography
-
1. North America
- 1.1. United States
- 1.2. Canada
- 1.3. Rest of North America
-
2. Asia Pacific
- 2.1. Australia
- 2.2. China
- 2.3. Japan
- 2.4. South Korea
- 2.5. India
- 2.6. Rest of Asia Pacific
-
3. Europe
- 3.1. France
- 3.2. Germany
- 3.3. Italy
- 3.4. United Kingdom
- 3.5. Rest of Europe
-
4. Middle East and Africa
- 4.1. United Arab Emirates
- 4.2. South Africa
- 4.3. Saudi Arabia
- 4.4. Rest of Middle East and Africa
-
5. South America
- 5.1. Brazil
- 5.2. Argentina
- 5.3. Colombia
- 5.4. Rest of South America
Energy Demand Response Management Market Regional Market Share
Geographic Coverage of Energy Demand Response Management Market
Energy Demand Response Management Market REPORT HIGHLIGHTS
| Aspects | Details |
|---|---|
| Study Period | 2020-2034 |
| Base Year | 2025 |
| Estimated Year | 2026 |
| Forecast Period | 2026-2034 |
| Historical Period | 2020-2025 |
| Growth Rate | CAGR of 28.5% from 2020-2034 |
| Segmentation |
|
Table of Contents
- 1. Introduction
- 1.1. Research Scope
- 1.2. Market Segmentation
- 1.3. Research Methodology
- 1.4. Definitions and Assumptions
- 2. Executive Summary
- 2.1. Introduction
- 3. Market Dynamics
- 3.1. Introduction
- 3.2. Market Drivers
- 3.2.1. 4.; Growing Vehicle Ownership4.; Government Initiatives
- 3.3. Market Restrains
- 3.3.1. 4.; Volatile Crude Oil Prices
- 3.4. Market Trends
- 3.4.1. Increased Adoption of Smart Grid Technologies
- 4. Market Factor Analysis
- 4.1. Porters Five Forces
- 4.2. Supply/Value Chain
- 4.3. PESTEL analysis
- 4.4. Market Entropy
- 4.5. Patent/Trademark Analysis
- 5. Global Energy Demand Response Management Market Analysis, Insights and Forecast, 2020-2032
- 5.1. Market Analysis, Insights and Forecast - by Production Analysis
- 5.2. Market Analysis, Insights and Forecast - by Consumption Analysis
- 5.3. Market Analysis, Insights and Forecast - by Import Market Analysis (Value & Volume)
- 5.4. Market Analysis, Insights and Forecast - by Export Market Analysis (Value & Volume)
- 5.5. Market Analysis, Insights and Forecast - by Price Trend Analysis
- 5.6. Market Analysis, Insights and Forecast - by Region
- 5.6.1. North America
- 5.6.2. Asia Pacific
- 5.6.3. Europe
- 5.6.4. Middle East and Africa
- 5.6.5. South America
- 5.1. Market Analysis, Insights and Forecast - by Production Analysis
- 6. North America Energy Demand Response Management Market Analysis, Insights and Forecast, 2020-2032
- 6.1. Market Analysis, Insights and Forecast - by Production Analysis
- 6.2. Market Analysis, Insights and Forecast - by Consumption Analysis
- 6.3. Market Analysis, Insights and Forecast - by Import Market Analysis (Value & Volume)
- 6.4. Market Analysis, Insights and Forecast - by Export Market Analysis (Value & Volume)
- 6.5. Market Analysis, Insights and Forecast - by Price Trend Analysis
- 6.1. Market Analysis, Insights and Forecast - by Production Analysis
- 7. Asia Pacific Energy Demand Response Management Market Analysis, Insights and Forecast, 2020-2032
- 7.1. Market Analysis, Insights and Forecast - by Production Analysis
- 7.2. Market Analysis, Insights and Forecast - by Consumption Analysis
- 7.3. Market Analysis, Insights and Forecast - by Import Market Analysis (Value & Volume)
- 7.4. Market Analysis, Insights and Forecast - by Export Market Analysis (Value & Volume)
- 7.5. Market Analysis, Insights and Forecast - by Price Trend Analysis
- 7.1. Market Analysis, Insights and Forecast - by Production Analysis
- 8. Europe Energy Demand Response Management Market Analysis, Insights and Forecast, 2020-2032
- 8.1. Market Analysis, Insights and Forecast - by Production Analysis
- 8.2. Market Analysis, Insights and Forecast - by Consumption Analysis
- 8.3. Market Analysis, Insights and Forecast - by Import Market Analysis (Value & Volume)
- 8.4. Market Analysis, Insights and Forecast - by Export Market Analysis (Value & Volume)
- 8.5. Market Analysis, Insights and Forecast - by Price Trend Analysis
- 8.1. Market Analysis, Insights and Forecast - by Production Analysis
- 9. Middle East and Africa Energy Demand Response Management Market Analysis, Insights and Forecast, 2020-2032
- 9.1. Market Analysis, Insights and Forecast - by Production Analysis
- 9.2. Market Analysis, Insights and Forecast - by Consumption Analysis
- 9.3. Market Analysis, Insights and Forecast - by Import Market Analysis (Value & Volume)
- 9.4. Market Analysis, Insights and Forecast - by Export Market Analysis (Value & Volume)
- 9.5. Market Analysis, Insights and Forecast - by Price Trend Analysis
- 9.1. Market Analysis, Insights and Forecast - by Production Analysis
- 10. South America Energy Demand Response Management Market Analysis, Insights and Forecast, 2020-2032
- 10.1. Market Analysis, Insights and Forecast - by Production Analysis
- 10.2. Market Analysis, Insights and Forecast - by Consumption Analysis
- 10.3. Market Analysis, Insights and Forecast - by Import Market Analysis (Value & Volume)
- 10.4. Market Analysis, Insights and Forecast - by Export Market Analysis (Value & Volume)
- 10.5. Market Analysis, Insights and Forecast - by Price Trend Analysis
- 10.1. Market Analysis, Insights and Forecast - by Production Analysis
- 11. Competitive Analysis
- 11.1. Global Market Share Analysis 2025
- 11.2. Company Profiles
- 11.2.1 Itron Inc
- 11.2.1.1. Overview
- 11.2.1.2. Products
- 11.2.1.3. SWOT Analysis
- 11.2.1.4. Recent Developments
- 11.2.1.5. Financials (Based on Availability)
- 11.2.2 Honeywell International Inc
- 11.2.2.1. Overview
- 11.2.2.2. Products
- 11.2.2.3. SWOT Analysis
- 11.2.2.4. Recent Developments
- 11.2.2.5. Financials (Based on Availability)
- 11.2.3 ABB Ltd
- 11.2.3.1. Overview
- 11.2.3.2. Products
- 11.2.3.3. SWOT Analysis
- 11.2.3.4. Recent Developments
- 11.2.3.5. Financials (Based on Availability)
- 11.2.4 Hitachi Ltd
- 11.2.4.1. Overview
- 11.2.4.2. Products
- 11.2.4.3. SWOT Analysis
- 11.2.4.4. Recent Developments
- 11.2.4.5. Financials (Based on Availability)
- 11.2.5 Siemens AG
- 11.2.5.1. Overview
- 11.2.5.2. Products
- 11.2.5.3. SWOT Analysis
- 11.2.5.4. Recent Developments
- 11.2.5.5. Financials (Based on Availability)
- 11.2.6 Mitsubishi Electric Corporation
- 11.2.6.1. Overview
- 11.2.6.2. Products
- 11.2.6.3. SWOT Analysis
- 11.2.6.4. Recent Developments
- 11.2.6.5. Financials (Based on Availability)
- 11.2.7 Autogrid Systems Inc
- 11.2.7.1. Overview
- 11.2.7.2. Products
- 11.2.7.3. SWOT Analysis
- 11.2.7.4. Recent Developments
- 11.2.7.5. Financials (Based on Availability)
- 11.2.8 Schneider Electric SE
- 11.2.8.1. Overview
- 11.2.8.2. Products
- 11.2.8.3. SWOT Analysis
- 11.2.8.4. Recent Developments
- 11.2.8.5. Financials (Based on Availability)
- 11.2.9 Eaton Corporation PLC
- 11.2.9.1. Overview
- 11.2.9.2. Products
- 11.2.9.3. SWOT Analysis
- 11.2.9.4. Recent Developments
- 11.2.9.5. Financials (Based on Availability)
- 11.2.10 General Electric Company
- 11.2.10.1. Overview
- 11.2.10.2. Products
- 11.2.10.3. SWOT Analysis
- 11.2.10.4. Recent Developments
- 11.2.10.5. Financials (Based on Availability)
- 11.2.1 Itron Inc
List of Figures
- Figure 1: Global Energy Demand Response Management Market Revenue Breakdown (undefined, %) by Region 2025 & 2033
- Figure 2: North America Energy Demand Response Management Market Revenue (undefined), by Production Analysis 2025 & 2033
- Figure 3: North America Energy Demand Response Management Market Revenue Share (%), by Production Analysis 2025 & 2033
- Figure 4: North America Energy Demand Response Management Market Revenue (undefined), by Consumption Analysis 2025 & 2033
- Figure 5: North America Energy Demand Response Management Market Revenue Share (%), by Consumption Analysis 2025 & 2033
- Figure 6: North America Energy Demand Response Management Market Revenue (undefined), by Import Market Analysis (Value & Volume) 2025 & 2033
- Figure 7: North America Energy Demand Response Management Market Revenue Share (%), by Import Market Analysis (Value & Volume) 2025 & 2033
- Figure 8: North America Energy Demand Response Management Market Revenue (undefined), by Export Market Analysis (Value & Volume) 2025 & 2033
- Figure 9: North America Energy Demand Response Management Market Revenue Share (%), by Export Market Analysis (Value & Volume) 2025 & 2033
- Figure 10: North America Energy Demand Response Management Market Revenue (undefined), by Price Trend Analysis 2025 & 2033
- Figure 11: North America Energy Demand Response Management Market Revenue Share (%), by Price Trend Analysis 2025 & 2033
- Figure 12: North America Energy Demand Response Management Market Revenue (undefined), by Country 2025 & 2033
- Figure 13: North America Energy Demand Response Management Market Revenue Share (%), by Country 2025 & 2033
- Figure 14: Asia Pacific Energy Demand Response Management Market Revenue (undefined), by Production Analysis 2025 & 2033
- Figure 15: Asia Pacific Energy Demand Response Management Market Revenue Share (%), by Production Analysis 2025 & 2033
- Figure 16: Asia Pacific Energy Demand Response Management Market Revenue (undefined), by Consumption Analysis 2025 & 2033
- Figure 17: Asia Pacific Energy Demand Response Management Market Revenue Share (%), by Consumption Analysis 2025 & 2033
- Figure 18: Asia Pacific Energy Demand Response Management Market Revenue (undefined), by Import Market Analysis (Value & Volume) 2025 & 2033
- Figure 19: Asia Pacific Energy Demand Response Management Market Revenue Share (%), by Import Market Analysis (Value & Volume) 2025 & 2033
- Figure 20: Asia Pacific Energy Demand Response Management Market Revenue (undefined), by Export Market Analysis (Value & Volume) 2025 & 2033
- Figure 21: Asia Pacific Energy Demand Response Management Market Revenue Share (%), by Export Market Analysis (Value & Volume) 2025 & 2033
- Figure 22: Asia Pacific Energy Demand Response Management Market Revenue (undefined), by Price Trend Analysis 2025 & 2033
- Figure 23: Asia Pacific Energy Demand Response Management Market Revenue Share (%), by Price Trend Analysis 2025 & 2033
- Figure 24: Asia Pacific Energy Demand Response Management Market Revenue (undefined), by Country 2025 & 2033
- Figure 25: Asia Pacific Energy Demand Response Management Market Revenue Share (%), by Country 2025 & 2033
- Figure 26: Europe Energy Demand Response Management Market Revenue (undefined), by Production Analysis 2025 & 2033
- Figure 27: Europe Energy Demand Response Management Market Revenue Share (%), by Production Analysis 2025 & 2033
- Figure 28: Europe Energy Demand Response Management Market Revenue (undefined), by Consumption Analysis 2025 & 2033
- Figure 29: Europe Energy Demand Response Management Market Revenue Share (%), by Consumption Analysis 2025 & 2033
- Figure 30: Europe Energy Demand Response Management Market Revenue (undefined), by Import Market Analysis (Value & Volume) 2025 & 2033
- Figure 31: Europe Energy Demand Response Management Market Revenue Share (%), by Import Market Analysis (Value & Volume) 2025 & 2033
- Figure 32: Europe Energy Demand Response Management Market Revenue (undefined), by Export Market Analysis (Value & Volume) 2025 & 2033
- Figure 33: Europe Energy Demand Response Management Market Revenue Share (%), by Export Market Analysis (Value & Volume) 2025 & 2033
- Figure 34: Europe Energy Demand Response Management Market Revenue (undefined), by Price Trend Analysis 2025 & 2033
- Figure 35: Europe Energy Demand Response Management Market Revenue Share (%), by Price Trend Analysis 2025 & 2033
- Figure 36: Europe Energy Demand Response Management Market Revenue (undefined), by Country 2025 & 2033
- Figure 37: Europe Energy Demand Response Management Market Revenue Share (%), by Country 2025 & 2033
- Figure 38: Middle East and Africa Energy Demand Response Management Market Revenue (undefined), by Production Analysis 2025 & 2033
- Figure 39: Middle East and Africa Energy Demand Response Management Market Revenue Share (%), by Production Analysis 2025 & 2033
- Figure 40: Middle East and Africa Energy Demand Response Management Market Revenue (undefined), by Consumption Analysis 2025 & 2033
- Figure 41: Middle East and Africa Energy Demand Response Management Market Revenue Share (%), by Consumption Analysis 2025 & 2033
- Figure 42: Middle East and Africa Energy Demand Response Management Market Revenue (undefined), by Import Market Analysis (Value & Volume) 2025 & 2033
- Figure 43: Middle East and Africa Energy Demand Response Management Market Revenue Share (%), by Import Market Analysis (Value & Volume) 2025 & 2033
- Figure 44: Middle East and Africa Energy Demand Response Management Market Revenue (undefined), by Export Market Analysis (Value & Volume) 2025 & 2033
- Figure 45: Middle East and Africa Energy Demand Response Management Market Revenue Share (%), by Export Market Analysis (Value & Volume) 2025 & 2033
- Figure 46: Middle East and Africa Energy Demand Response Management Market Revenue (undefined), by Price Trend Analysis 2025 & 2033
- Figure 47: Middle East and Africa Energy Demand Response Management Market Revenue Share (%), by Price Trend Analysis 2025 & 2033
- Figure 48: Middle East and Africa Energy Demand Response Management Market Revenue (undefined), by Country 2025 & 2033
- Figure 49: Middle East and Africa Energy Demand Response Management Market Revenue Share (%), by Country 2025 & 2033
- Figure 50: South America Energy Demand Response Management Market Revenue (undefined), by Production Analysis 2025 & 2033
- Figure 51: South America Energy Demand Response Management Market Revenue Share (%), by Production Analysis 2025 & 2033
- Figure 52: South America Energy Demand Response Management Market Revenue (undefined), by Consumption Analysis 2025 & 2033
- Figure 53: South America Energy Demand Response Management Market Revenue Share (%), by Consumption Analysis 2025 & 2033
- Figure 54: South America Energy Demand Response Management Market Revenue (undefined), by Import Market Analysis (Value & Volume) 2025 & 2033
- Figure 55: South America Energy Demand Response Management Market Revenue Share (%), by Import Market Analysis (Value & Volume) 2025 & 2033
- Figure 56: South America Energy Demand Response Management Market Revenue (undefined), by Export Market Analysis (Value & Volume) 2025 & 2033
- Figure 57: South America Energy Demand Response Management Market Revenue Share (%), by Export Market Analysis (Value & Volume) 2025 & 2033
- Figure 58: South America Energy Demand Response Management Market Revenue (undefined), by Price Trend Analysis 2025 & 2033
- Figure 59: South America Energy Demand Response Management Market Revenue Share (%), by Price Trend Analysis 2025 & 2033
- Figure 60: South America Energy Demand Response Management Market Revenue (undefined), by Country 2025 & 2033
- Figure 61: South America Energy Demand Response Management Market Revenue Share (%), by Country 2025 & 2033
List of Tables
- Table 1: Global Energy Demand Response Management Market Revenue undefined Forecast, by Production Analysis 2020 & 2033
- Table 2: Global Energy Demand Response Management Market Revenue undefined Forecast, by Consumption Analysis 2020 & 2033
- Table 3: Global Energy Demand Response Management Market Revenue undefined Forecast, by Import Market Analysis (Value & Volume) 2020 & 2033
- Table 4: Global Energy Demand Response Management Market Revenue undefined Forecast, by Export Market Analysis (Value & Volume) 2020 & 2033
- Table 5: Global Energy Demand Response Management Market Revenue undefined Forecast, by Price Trend Analysis 2020 & 2033
- Table 6: Global Energy Demand Response Management Market Revenue undefined Forecast, by Region 2020 & 2033
- Table 7: Global Energy Demand Response Management Market Revenue undefined Forecast, by Production Analysis 2020 & 2033
- Table 8: Global Energy Demand Response Management Market Revenue undefined Forecast, by Consumption Analysis 2020 & 2033
- Table 9: Global Energy Demand Response Management Market Revenue undefined Forecast, by Import Market Analysis (Value & Volume) 2020 & 2033
- Table 10: Global Energy Demand Response Management Market Revenue undefined Forecast, by Export Market Analysis (Value & Volume) 2020 & 2033
- Table 11: Global Energy Demand Response Management Market Revenue undefined Forecast, by Price Trend Analysis 2020 & 2033
- Table 12: Global Energy Demand Response Management Market Revenue undefined Forecast, by Country 2020 & 2033
- Table 13: United States Energy Demand Response Management Market Revenue (undefined) Forecast, by Application 2020 & 2033
- Table 14: Canada Energy Demand Response Management Market Revenue (undefined) Forecast, by Application 2020 & 2033
- Table 15: Rest of North America Energy Demand Response Management Market Revenue (undefined) Forecast, by Application 2020 & 2033
- Table 16: Global Energy Demand Response Management Market Revenue undefined Forecast, by Production Analysis 2020 & 2033
- Table 17: Global Energy Demand Response Management Market Revenue undefined Forecast, by Consumption Analysis 2020 & 2033
- Table 18: Global Energy Demand Response Management Market Revenue undefined Forecast, by Import Market Analysis (Value & Volume) 2020 & 2033
- Table 19: Global Energy Demand Response Management Market Revenue undefined Forecast, by Export Market Analysis (Value & Volume) 2020 & 2033
- Table 20: Global Energy Demand Response Management Market Revenue undefined Forecast, by Price Trend Analysis 2020 & 2033
- Table 21: Global Energy Demand Response Management Market Revenue undefined Forecast, by Country 2020 & 2033
- Table 22: Australia Energy Demand Response Management Market Revenue (undefined) Forecast, by Application 2020 & 2033
- Table 23: China Energy Demand Response Management Market Revenue (undefined) Forecast, by Application 2020 & 2033
- Table 24: Japan Energy Demand Response Management Market Revenue (undefined) Forecast, by Application 2020 & 2033
- Table 25: South Korea Energy Demand Response Management Market Revenue (undefined) Forecast, by Application 2020 & 2033
- Table 26: India Energy Demand Response Management Market Revenue (undefined) Forecast, by Application 2020 & 2033
- Table 27: Rest of Asia Pacific Energy Demand Response Management Market Revenue (undefined) Forecast, by Application 2020 & 2033
- Table 28: Global Energy Demand Response Management Market Revenue undefined Forecast, by Production Analysis 2020 & 2033
- Table 29: Global Energy Demand Response Management Market Revenue undefined Forecast, by Consumption Analysis 2020 & 2033
- Table 30: Global Energy Demand Response Management Market Revenue undefined Forecast, by Import Market Analysis (Value & Volume) 2020 & 2033
- Table 31: Global Energy Demand Response Management Market Revenue undefined Forecast, by Export Market Analysis (Value & Volume) 2020 & 2033
- Table 32: Global Energy Demand Response Management Market Revenue undefined Forecast, by Price Trend Analysis 2020 & 2033
- Table 33: Global Energy Demand Response Management Market Revenue undefined Forecast, by Country 2020 & 2033
- Table 34: France Energy Demand Response Management Market Revenue (undefined) Forecast, by Application 2020 & 2033
- Table 35: Germany Energy Demand Response Management Market Revenue (undefined) Forecast, by Application 2020 & 2033
- Table 36: Italy Energy Demand Response Management Market Revenue (undefined) Forecast, by Application 2020 & 2033
- Table 37: United Kingdom Energy Demand Response Management Market Revenue (undefined) Forecast, by Application 2020 & 2033
- Table 38: Rest of Europe Energy Demand Response Management Market Revenue (undefined) Forecast, by Application 2020 & 2033
- Table 39: Global Energy Demand Response Management Market Revenue undefined Forecast, by Production Analysis 2020 & 2033
- Table 40: Global Energy Demand Response Management Market Revenue undefined Forecast, by Consumption Analysis 2020 & 2033
- Table 41: Global Energy Demand Response Management Market Revenue undefined Forecast, by Import Market Analysis (Value & Volume) 2020 & 2033
- Table 42: Global Energy Demand Response Management Market Revenue undefined Forecast, by Export Market Analysis (Value & Volume) 2020 & 2033
- Table 43: Global Energy Demand Response Management Market Revenue undefined Forecast, by Price Trend Analysis 2020 & 2033
- Table 44: Global Energy Demand Response Management Market Revenue undefined Forecast, by Country 2020 & 2033
- Table 45: United Arab Emirates Energy Demand Response Management Market Revenue (undefined) Forecast, by Application 2020 & 2033
- Table 46: South Africa Energy Demand Response Management Market Revenue (undefined) Forecast, by Application 2020 & 2033
- Table 47: Saudi Arabia Energy Demand Response Management Market Revenue (undefined) Forecast, by Application 2020 & 2033
- Table 48: Rest of Middle East and Africa Energy Demand Response Management Market Revenue (undefined) Forecast, by Application 2020 & 2033
- Table 49: Global Energy Demand Response Management Market Revenue undefined Forecast, by Production Analysis 2020 & 2033
- Table 50: Global Energy Demand Response Management Market Revenue undefined Forecast, by Consumption Analysis 2020 & 2033
- Table 51: Global Energy Demand Response Management Market Revenue undefined Forecast, by Import Market Analysis (Value & Volume) 2020 & 2033
- Table 52: Global Energy Demand Response Management Market Revenue undefined Forecast, by Export Market Analysis (Value & Volume) 2020 & 2033
- Table 53: Global Energy Demand Response Management Market Revenue undefined Forecast, by Price Trend Analysis 2020 & 2033
- Table 54: Global Energy Demand Response Management Market Revenue undefined Forecast, by Country 2020 & 2033
- Table 55: Brazil Energy Demand Response Management Market Revenue (undefined) Forecast, by Application 2020 & 2033
- Table 56: Argentina Energy Demand Response Management Market Revenue (undefined) Forecast, by Application 2020 & 2033
- Table 57: Colombia Energy Demand Response Management Market Revenue (undefined) Forecast, by Application 2020 & 2033
- Table 58: Rest of South America Energy Demand Response Management Market Revenue (undefined) Forecast, by Application 2020 & 2033
Frequently Asked Questions
1. What is the projected Compound Annual Growth Rate (CAGR) of the Energy Demand Response Management Market?
The projected CAGR is approximately 28.5%.
2. Which companies are prominent players in the Energy Demand Response Management Market?
Key companies in the market include Itron Inc, Honeywell International Inc, ABB Ltd, Hitachi Ltd, Siemens AG, Mitsubishi Electric Corporation, Autogrid Systems Inc, Schneider Electric SE, Eaton Corporation PLC, General Electric Company.
3. What are the main segments of the Energy Demand Response Management Market?
The market segments include Production Analysis, Consumption Analysis, Import Market Analysis (Value & Volume), Export Market Analysis (Value & Volume), Price Trend Analysis.
4. Can you provide details about the market size?
The market size is estimated to be USD XXX N/A as of 2022.
5. What are some drivers contributing to market growth?
4.; Growing Vehicle Ownership4.; Government Initiatives.
6. What are the notable trends driving market growth?
Increased Adoption of Smart Grid Technologies.
7. Are there any restraints impacting market growth?
4.; Volatile Crude Oil Prices.
8. Can you provide examples of recent developments in the market?
N/A
9. What pricing options are available for accessing the report?
Pricing options include single-user, multi-user, and enterprise licenses priced at USD 4750, USD 5250, and USD 8750 respectively.
10. Is the market size provided in terms of value or volume?
The market size is provided in terms of value, measured in N/A.
11. Are there any specific market keywords associated with the report?
Yes, the market keyword associated with the report is "Energy Demand Response Management Market," which aids in identifying and referencing the specific market segment covered.
12. How do I determine which pricing option suits my needs best?
The pricing options vary based on user requirements and access needs. Individual users may opt for single-user licenses, while businesses requiring broader access may choose multi-user or enterprise licenses for cost-effective access to the report.
13. Are there any additional resources or data provided in the Energy Demand Response Management Market report?
While the report offers comprehensive insights, it's advisable to review the specific contents or supplementary materials provided to ascertain if additional resources or data are available.
14. How can I stay updated on further developments or reports in the Energy Demand Response Management Market?
To stay informed about further developments, trends, and reports in the Energy Demand Response Management Market, consider subscribing to industry newsletters, following relevant companies and organizations, or regularly checking reputable industry news sources and publications.
Methodology
Step 1 - Identification of Relevant Samples Size from Population Database


Step 2 - Approaches for Defining Global Market Size (Value, Volume* & Price*)

Note*: In applicable scenarios
Step 3 - Data Sources
Primary Research
- Web Analytics
- Survey Reports
- Research Institute
- Latest Research Reports
- Opinion Leaders
Secondary Research
- Annual Reports
- White Paper
- Latest Press Release
- Industry Association
- Paid Database
- Investor Presentations

Step 4 - Data Triangulation
Involves using different sources of information in order to increase the validity of a study
These sources are likely to be stakeholders in a program - participants, other researchers, program staff, other community members, and so on.
Then we put all data in single framework & apply various statistical tools to find out the dynamic on the market.
During the analysis stage, feedback from the stakeholder groups would be compared to determine areas of agreement as well as areas of divergence