

Key Insights
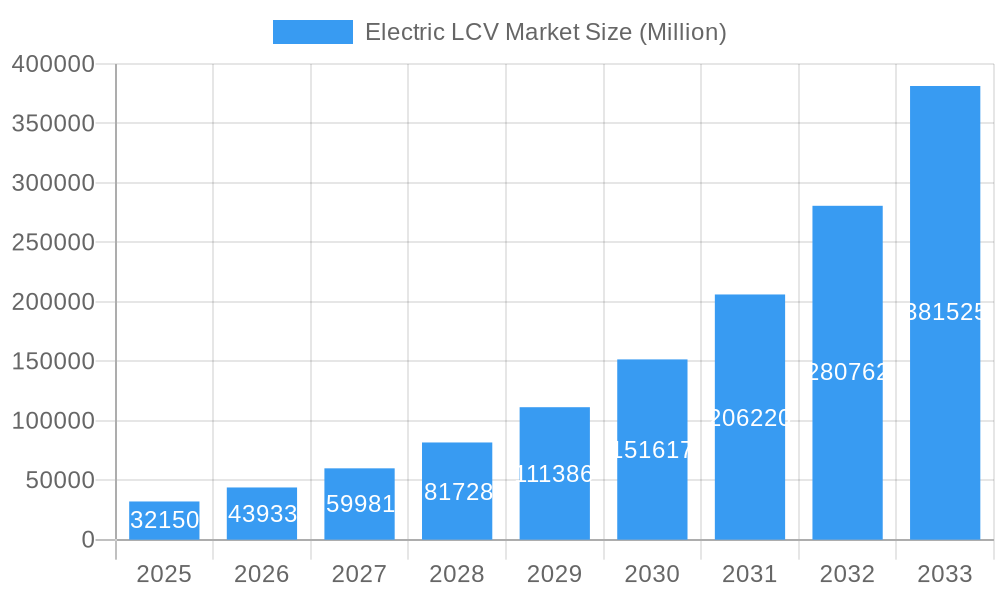
The Electric Light Commercial Vehicle (LCV) market is experiencing explosive growth, projected to reach a market size of $32.15 billion in 2025 and exhibiting a remarkable Compound Annual Growth Rate (CAGR) of 36.40%. Several key factors drive this expansion. Stringent emission regulations globally are pushing the adoption of cleaner transportation solutions, making electric LCVs an attractive alternative to traditional diesel-powered vehicles. Furthermore, advancements in battery technology are leading to increased range and reduced charging times, addressing crucial concerns hindering wider acceptance. The decreasing cost of battery packs also contributes significantly to the market's affordability and rapid growth. Government incentives and subsidies in many regions further stimulate demand, particularly in countries like China and the European Union. The market segmentation reveals promising opportunities across various vehicle types, with battery electric vehicles (BEVs) currently dominating, followed by hybrid electric vehicles (HEVs). The demand for electric vans and pickup trucks is particularly strong, fueled by the burgeoning e-commerce sector and last-mile delivery services. Higher power output (above 250 kW) LCVs are also witnessing growth, driven by the need for heavier-duty applications. Leading players such as Tata Motors, Volkswagen, Nissan, and Tesla are strategically investing in research and development and expanding their product portfolios to capitalize on this rapidly evolving market.
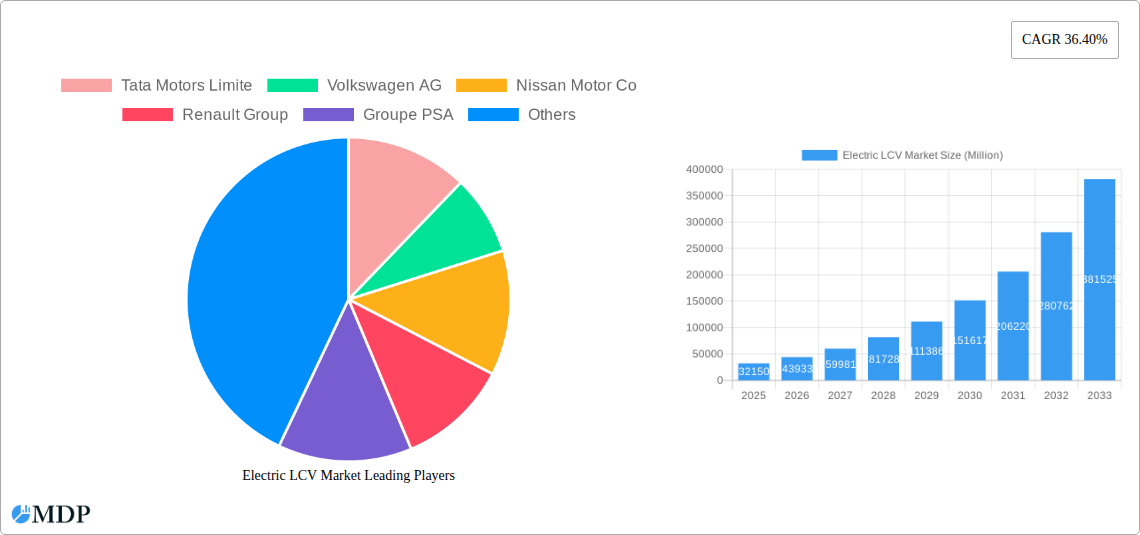
Electric LCV Market Market Size (In Billion)
The Asia-Pacific region, particularly China and India, is expected to dominate the Electric LCV market due to strong government support, large manufacturing bases, and a significant demand for efficient and affordable last-mile delivery solutions. North America and Europe are also poised for significant growth, although at a slightly slower pace compared to Asia-Pacific. The competitive landscape is highly dynamic, with both established automotive giants and emerging electric vehicle (EV) startups vying for market share. While challenges remain, including the establishment of robust charging infrastructure and the need for further advancements in battery technology to achieve longer ranges, the overall outlook for the Electric LCV market remains extremely positive over the forecast period (2025-2033). Continued technological advancements, supportive government policies, and rising consumer awareness of environmental concerns will continue to fuel the market's remarkable growth trajectory.
Electric LCV Market Company Market Share
Unlock the potential of the booming Electric Light Commercial Vehicle (LCV) market with this in-depth report. This comprehensive study provides a detailed analysis of the global Electric LCV market, offering invaluable insights for industry stakeholders, investors, and strategic decision-makers. From market dynamics and concentration to leading players and future opportunities, this report equips you with the knowledge you need to navigate this rapidly evolving landscape. The report covers the period 2019-2033, with a base year of 2025 and a forecast period of 2025-2033. Expected market size is xx Million by 2033, experiencing a CAGR of xx% during the forecast period.
Electric LCV Market Market Dynamics & Concentration
The Electric LCV market is witnessing significant growth driven by stringent emission regulations, increasing fuel costs, and growing environmental concerns. Market concentration is currently moderate, with key players such as Tata Motors, Volkswagen, and BYD holding significant market share, but a fragmented landscape with numerous smaller players also exists. Innovation is key, with continuous improvements in battery technology, charging infrastructure, and vehicle design driving market expansion. Mergers and acquisitions (M&A) activity is expected to increase as larger companies seek to consolidate their market position and acquire smaller, innovative players. The regulatory environment plays a critical role, with government incentives and subsidies significantly impacting market growth. The availability of alternative fuel vehicles (e.g., CNG) creates substitution pressure, however the growing advantages of electric vehicles in terms of lower running costs and reduced emissions is overcoming this.
- Market Share (2024 Estimate): Tata Motors: xx%, Volkswagen: xx%, BYD: xx%, Others: xx%
- M&A Deal Count (2019-2024): xx deals
- Key Innovation Drivers: Battery technology advancements, improved charging infrastructure, autonomous driving features.
- Regulatory Frameworks: Increasingly stringent emission standards in major markets.
- End-User Trends: Growing preference for environmentally friendly vehicles among businesses and logistics companies.
Electric LCV Market Industry Trends & Analysis
The Electric LCV market is experiencing robust growth, driven primarily by government regulations promoting electric vehicle adoption, rising consumer demand for sustainable transportation, and technological advancements resulting in improved battery performance and reduced vehicle costs. The market is witnessing significant technological disruptions, with the emergence of solid-state batteries and advancements in fast-charging technologies. This, alongside the shift in consumer preferences towards eco-friendly options, is further accelerating market expansion. Competitive dynamics are intensifying, with established automakers and new entrants vying for market share through product innovation and strategic partnerships. The market penetration rate of electric LCVs is expected to increase significantly over the forecast period, driven by factors including decreasing battery prices and expanding charging infrastructure.
Leading Markets & Segments in Electric LCV Market
The Electric LCV market is witnessing significant growth across various regions, with [mention the dominant region, e.g., Europe or China] emerging as the leading market. Within this region, [mention the dominant country, e.g., Germany or China] is particularly prominent due to supportive government policies and a robust charging infrastructure.
By Propulsion Type:
- BEV (Battery Electric Vehicle): Dominates the market due to its maturity and range improvements.
- HEV (Hybrid Electric Vehicle): Holds a smaller share, offering a transitional solution.
- FCEV (Fuel Cell Electric Vehicle): Limited market penetration due to high costs and limited refueling infrastructure.
By Vehicle Type:
- Van: The largest segment due to high demand in last-mile delivery and logistics.
- Pick-up Truck: Shows significant growth potential, especially in construction and utility sectors.
By Power Output:
100-250 kW: The most popular power range due to its balance of performance and cost-effectiveness.
Key Drivers in Dominant Region/Country: Strong government support through subsidies and tax incentives, well-developed charging infrastructure, and high consumer awareness of environmental benefits.
Electric LCV Market Product Developments
Recent product innovations focus on enhancing battery range, improving charging speed, and integrating advanced driver-assistance systems (ADAS). New models are incorporating features like telematics and connectivity, optimizing logistics and fleet management. Competitive advantages are being established through superior battery technology, cost-effective manufacturing processes, and extensive after-sales service networks. The market is witnessing a trend towards modular designs allowing for flexibility and customization to meet diverse customer needs.
Key Drivers of Electric LCV Market Growth
Several factors are fueling the growth of the Electric LCV market:
- Stringent Emission Regulations: Governments worldwide are implementing stricter emission norms, pushing the adoption of electric vehicles.
- Falling Battery Costs: The decreasing cost of batteries is making electric vehicles increasingly affordable.
- Government Incentives: Subsidies and tax breaks are significantly boosting demand.
- Improved Battery Technology: Advancements in battery technology are resulting in longer ranges and faster charging times.
Challenges in the Electric LCV Market Market
The Electric LCV market faces several challenges:
- High Initial Purchase Price: Electric LCVs are often more expensive than their internal combustion engine counterparts.
- Limited Charging Infrastructure: Lack of widespread charging infrastructure hinders adoption, especially in rural areas.
- Range Anxiety: Concerns about the limited range of electric vehicles persist among potential buyers.
- Battery Lifespan and Recycling: Concerns around battery lifespan and the need for efficient recycling solutions.
Emerging Opportunities in Electric LCV Market
The long-term growth of the Electric LCV market is promising due to several emerging opportunities:
- Technological Advancements: Developments in solid-state batteries and fast-charging technologies offer potential for significantly improved performance.
- Strategic Partnerships: Collaborations between automakers, battery manufacturers, and charging infrastructure providers can accelerate market penetration.
- Expansion into New Markets: Untapped markets in developing economies present significant growth potential.
Leading Players in the Electric LCV Market Sector
Key Milestones in Electric LCV Market Industry
- 2020: Introduction of several new electric LCV models by major automakers.
- 2021: Significant investments in charging infrastructure by governments and private companies.
- 2022: Launch of several government incentive programs to promote electric vehicle adoption.
- 2023: Several key partnerships formed between automakers and battery manufacturers.
- 2024: Several new entrants enter the market with innovative electric LCV solutions.
Strategic Outlook for Electric LCV Market Market
The Electric LCV market is poised for substantial growth in the coming years. Strategic opportunities exist in investing in battery technology, expanding charging infrastructure, and developing innovative vehicle designs. Focusing on efficient fleet management solutions and leveraging technological advancements in autonomous driving and connectivity will play a significant role in shaping the future of this market. The market is expected to be driven by a combination of technological advancements, supportive government policies, and growing consumer demand for sustainable transportation.
Electric LCV Market Segmentation
-
1. Propulsion Type
- 1.1. BEV
- 1.2. HEV
- 1.3. FCEV
-
2. Vehicle Type
- 2.1. Van
- 2.2. Pick-up Truck
-
3. Power Output
- 3.1. Less Than 100 kW
- 3.2. 100 -250 kW
- 3.3. More Than 250 kW
Electric LCV Market Segmentation By Geography
-
1. North America
- 1.1. United States
- 1.2. Canada
- 1.3. Rest of North America
-
2. Europe
- 2.1. Germany
- 2.2. United Kingdom
- 2.3. France
- 2.4. Rest of Europe
-
3. Asia Pacific
- 3.1. India
- 3.2. China
- 3.3. Japan
- 3.4. South Korea
- 3.5. Rest of Asia Pacific
-
4. Rest of the World
- 4.1. Brazil
- 4.2. Mexico
- 4.3. United Arab Emirates
- 4.4. Other Countries
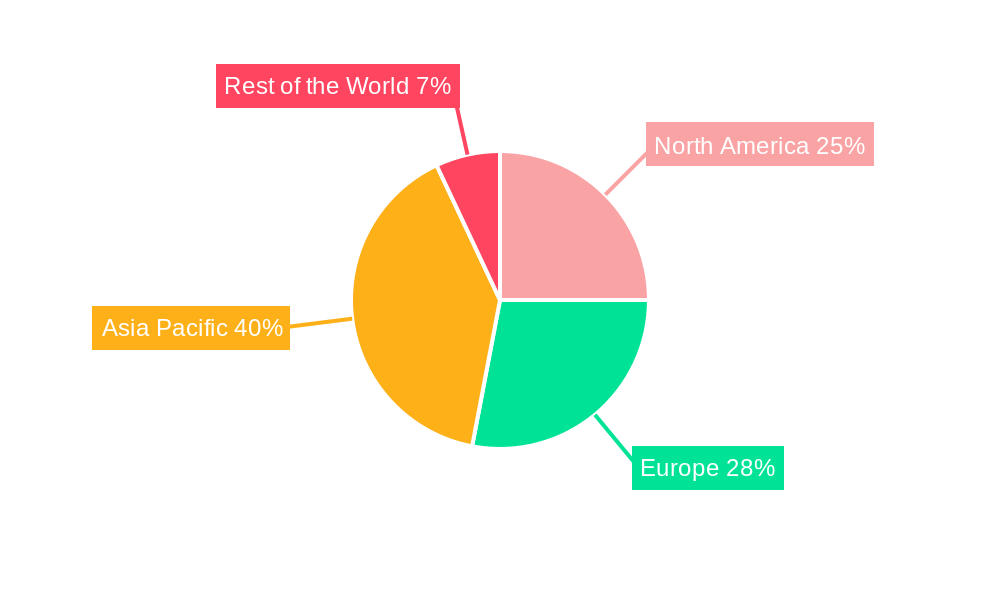
Electric LCV Market Regional Market Share
Geographic Coverage of Electric LCV Market
Electric LCV Market REPORT HIGHLIGHTS
| Aspects | Details |
|---|---|
| Study Period | 2020-2034 |
| Base Year | 2025 |
| Estimated Year | 2026 |
| Forecast Period | 2026-2034 |
| Historical Period | 2020-2025 |
| Growth Rate | CAGR of 36.40% from 2020-2034 |
| Segmentation |
|
Table of Contents
- 1. Introduction
- 1.1. Research Scope
- 1.2. Market Segmentation
- 1.3. Research Objective
- 1.4. Definitions and Assumptions
- 2. Executive Summary
- 2.1. Market Snapshot
- 3. Market Dynamics
- 3.1. Market Drivers
- 3.2. Market Restrains
- 3.3. Market Trends
- 3.4. Market Opportunities
- 4. Market Factor Analysis
- 4.1. Porters Five Forces
- 4.1.1. Bargaining Power of Suppliers
- 4.1.2. Bargaining Power of Buyers
- 4.1.3. Threat of New Entrants
- 4.1.4. Threat of Substitutes
- 4.1.5. Competitive Rivalry
- 4.2. PESTEL analysis
- 4.3. BCG Analysis
- 4.3.1. Stars (High Growth, High Market Share)
- 4.3.2. Cash Cows (Low Growth, High Market Share)
- 4.3.3. Question Mark (High Growth, Low Market Share)
- 4.3.4. Dogs (Low Growth, Low Market Share)
- 4.4. Ansoff Matrix Analysis
- 4.5. Supply Chain Analysis
- 4.6. Regulatory Landscape
- 4.7. Current Market Potential and Opportunity Assessment (TAM–SAM–SOM Framework)
- 4.8. MDP Analyst Note
- 4.1. Porters Five Forces
- 5. Market Analysis, Insights and Forecast 2021-2033
- 5.1. Market Analysis, Insights and Forecast - by Propulsion Type
- 5.1.1. BEV
- 5.1.2. HEV
- 5.1.3. FCEV
- 5.2. Market Analysis, Insights and Forecast - by Vehicle Type
- 5.2.1. Van
- 5.2.2. Pick-up Truck
- 5.3. Market Analysis, Insights and Forecast - by Power Output
- 5.3.1. Less Than 100 kW
- 5.3.2. 100 -250 kW
- 5.3.3. More Than 250 kW
- 5.4. Market Analysis, Insights and Forecast - by Region
- 5.4.1. North America
- 5.4.2. Europe
- 5.4.3. Asia Pacific
- 5.4.4. Rest of the World
- 5.1. Market Analysis, Insights and Forecast - by Propulsion Type
- 6. Global Electric LCV Market Analysis, Insights and Forecast, 2021-2033
- 6.1. Market Analysis, Insights and Forecast - by Propulsion Type
- 6.1.1. BEV
- 6.1.2. HEV
- 6.1.3. FCEV
- 6.2. Market Analysis, Insights and Forecast - by Vehicle Type
- 6.2.1. Van
- 6.2.2. Pick-up Truck
- 6.3. Market Analysis, Insights and Forecast - by Power Output
- 6.3.1. Less Than 100 kW
- 6.3.2. 100 -250 kW
- 6.3.3. More Than 250 kW
- 6.1. Market Analysis, Insights and Forecast - by Propulsion Type
- 7. North America Electric LCV Market Analysis, Insights and Forecast, 2020-2032
- 7.1. Market Analysis, Insights and Forecast - by Propulsion Type
- 7.1.1. BEV
- 7.1.2. HEV
- 7.1.3. FCEV
- 7.2. Market Analysis, Insights and Forecast - by Vehicle Type
- 7.2.1. Van
- 7.2.2. Pick-up Truck
- 7.3. Market Analysis, Insights and Forecast - by Power Output
- 7.3.1. Less Than 100 kW
- 7.3.2. 100 -250 kW
- 7.3.3. More Than 250 kW
- 7.1. Market Analysis, Insights and Forecast - by Propulsion Type
- 8. Europe Electric LCV Market Analysis, Insights and Forecast, 2020-2032
- 8.1. Market Analysis, Insights and Forecast - by Propulsion Type
- 8.1.1. BEV
- 8.1.2. HEV
- 8.1.3. FCEV
- 8.2. Market Analysis, Insights and Forecast - by Vehicle Type
- 8.2.1. Van
- 8.2.2. Pick-up Truck
- 8.3. Market Analysis, Insights and Forecast - by Power Output
- 8.3.1. Less Than 100 kW
- 8.3.2. 100 -250 kW
- 8.3.3. More Than 250 kW
- 8.1. Market Analysis, Insights and Forecast - by Propulsion Type
- 9. Asia Pacific Electric LCV Market Analysis, Insights and Forecast, 2020-2032
- 9.1. Market Analysis, Insights and Forecast - by Propulsion Type
- 9.1.1. BEV
- 9.1.2. HEV
- 9.1.3. FCEV
- 9.2. Market Analysis, Insights and Forecast - by Vehicle Type
- 9.2.1. Van
- 9.2.2. Pick-up Truck
- 9.3. Market Analysis, Insights and Forecast - by Power Output
- 9.3.1. Less Than 100 kW
- 9.3.2. 100 -250 kW
- 9.3.3. More Than 250 kW
- 9.1. Market Analysis, Insights and Forecast - by Propulsion Type
- 10. Rest of the World Electric LCV Market Analysis, Insights and Forecast, 2020-2032
- 10.1. Market Analysis, Insights and Forecast - by Propulsion Type
- 10.1.1. BEV
- 10.1.2. HEV
- 10.1.3. FCEV
- 10.2. Market Analysis, Insights and Forecast - by Vehicle Type
- 10.2.1. Van
- 10.2.2. Pick-up Truck
- 10.3. Market Analysis, Insights and Forecast - by Power Output
- 10.3.1. Less Than 100 kW
- 10.3.2. 100 -250 kW
- 10.3.3. More Than 250 kW
- 10.1. Market Analysis, Insights and Forecast - by Propulsion Type
- 11. Competitive Analysis
- 11.1. Company Profiles
- 11.1.1 Tata Motors Limite
- 11.1.1.1. Company Overview
- 11.1.1.2. Products
- 11.1.1.3. Company Financials
- 11.1.1.4. SWOT Analysis
- 11.1.2 Volkswagen AG
- 11.1.2.1. Company Overview
- 11.1.2.2. Products
- 11.1.2.3. Company Financials
- 11.1.2.4. SWOT Analysis
- 11.1.3 Nissan Motor Co
- 11.1.3.1. Company Overview
- 11.1.3.2. Products
- 11.1.3.3. Company Financials
- 11.1.3.4. SWOT Analysis
- 11.1.4 Renault Group
- 11.1.4.1. Company Overview
- 11.1.4.2. Products
- 11.1.4.3. Company Financials
- 11.1.4.4. SWOT Analysis
- 11.1.5 Groupe PSA
- 11.1.5.1. Company Overview
- 11.1.5.2. Products
- 11.1.5.3. Company Financials
- 11.1.5.4. SWOT Analysis
- 11.1.6 Mahindra and Mahindra Ltd
- 11.1.6.1. Company Overview
- 11.1.6.2. Products
- 11.1.6.3. Company Financials
- 11.1.6.4. SWOT Analysis
- 11.1.7 BYD Group
- 11.1.7.1. Company Overview
- 11.1.7.2. Products
- 11.1.7.3. Company Financials
- 11.1.7.4. SWOT Analysis
- 11.1.8 Tesla Inc
- 11.1.8.1. Company Overview
- 11.1.8.2. Products
- 11.1.8.3. Company Financials
- 11.1.8.4. SWOT Analysis
- 11.1.9 Arrival Ltd
- 11.1.9.1. Company Overview
- 11.1.9.2. Products
- 11.1.9.3. Company Financials
- 11.1.9.4. SWOT Analysis
- 11.1.10 Rivian Automotive
- 11.1.10.1. Company Overview
- 11.1.10.2. Products
- 11.1.10.3. Company Financials
- 11.1.10.4. SWOT Analysis
- 11.1.11 BAIC Group
- 11.1.11.1. Company Overview
- 11.1.11.2. Products
- 11.1.11.3. Company Financials
- 11.1.11.4. SWOT Analysis
- 11.1.1 Tata Motors Limite
- 11.2. Market Entropy
- 11.2.1 Company's Key Areas Served
- 11.2.2 Recent Developments
- 11.3. Company Market Share Analysis 2025
- 11.3.1 Top 5 Companies Market Share Analysis
- 11.3.2 Top 3 Companies Market Share Analysis
- 11.4. List of Potential Customers
- 12. Research Methodology
List of Figures
- Figure 1: Global Electric LCV Market Revenue Breakdown (Million, %) by Region 2025 & 2033
- Figure 2: North America Electric LCV Market Revenue (Million), by Propulsion Type 2025 & 2033
- Figure 3: North America Electric LCV Market Revenue Share (%), by Propulsion Type 2025 & 2033
- Figure 4: North America Electric LCV Market Revenue (Million), by Vehicle Type 2025 & 2033
- Figure 5: North America Electric LCV Market Revenue Share (%), by Vehicle Type 2025 & 2033
- Figure 6: North America Electric LCV Market Revenue (Million), by Power Output 2025 & 2033
- Figure 7: North America Electric LCV Market Revenue Share (%), by Power Output 2025 & 2033
- Figure 8: North America Electric LCV Market Revenue (Million), by Country 2025 & 2033
- Figure 9: North America Electric LCV Market Revenue Share (%), by Country 2025 & 2033
- Figure 10: Europe Electric LCV Market Revenue (Million), by Propulsion Type 2025 & 2033
- Figure 11: Europe Electric LCV Market Revenue Share (%), by Propulsion Type 2025 & 2033
- Figure 12: Europe Electric LCV Market Revenue (Million), by Vehicle Type 2025 & 2033
- Figure 13: Europe Electric LCV Market Revenue Share (%), by Vehicle Type 2025 & 2033
- Figure 14: Europe Electric LCV Market Revenue (Million), by Power Output 2025 & 2033
- Figure 15: Europe Electric LCV Market Revenue Share (%), by Power Output 2025 & 2033
- Figure 16: Europe Electric LCV Market Revenue (Million), by Country 2025 & 2033
- Figure 17: Europe Electric LCV Market Revenue Share (%), by Country 2025 & 2033
- Figure 18: Asia Pacific Electric LCV Market Revenue (Million), by Propulsion Type 2025 & 2033
- Figure 19: Asia Pacific Electric LCV Market Revenue Share (%), by Propulsion Type 2025 & 2033
- Figure 20: Asia Pacific Electric LCV Market Revenue (Million), by Vehicle Type 2025 & 2033
- Figure 21: Asia Pacific Electric LCV Market Revenue Share (%), by Vehicle Type 2025 & 2033
- Figure 22: Asia Pacific Electric LCV Market Revenue (Million), by Power Output 2025 & 2033
- Figure 23: Asia Pacific Electric LCV Market Revenue Share (%), by Power Output 2025 & 2033
- Figure 24: Asia Pacific Electric LCV Market Revenue (Million), by Country 2025 & 2033
- Figure 25: Asia Pacific Electric LCV Market Revenue Share (%), by Country 2025 & 2033
- Figure 26: Rest of the World Electric LCV Market Revenue (Million), by Propulsion Type 2025 & 2033
- Figure 27: Rest of the World Electric LCV Market Revenue Share (%), by Propulsion Type 2025 & 2033
- Figure 28: Rest of the World Electric LCV Market Revenue (Million), by Vehicle Type 2025 & 2033
- Figure 29: Rest of the World Electric LCV Market Revenue Share (%), by Vehicle Type 2025 & 2033
- Figure 30: Rest of the World Electric LCV Market Revenue (Million), by Power Output 2025 & 2033
- Figure 31: Rest of the World Electric LCV Market Revenue Share (%), by Power Output 2025 & 2033
- Figure 32: Rest of the World Electric LCV Market Revenue (Million), by Country 2025 & 2033
- Figure 33: Rest of the World Electric LCV Market Revenue Share (%), by Country 2025 & 2033
List of Tables
- Table 1: Global Electric LCV Market Revenue Million Forecast, by Propulsion Type 2020 & 2033
- Table 2: Global Electric LCV Market Revenue Million Forecast, by Vehicle Type 2020 & 2033
- Table 3: Global Electric LCV Market Revenue Million Forecast, by Power Output 2020 & 2033
- Table 4: Global Electric LCV Market Revenue Million Forecast, by Region 2020 & 2033
- Table 5: Global Electric LCV Market Revenue Million Forecast, by Propulsion Type 2020 & 2033
- Table 6: Global Electric LCV Market Revenue Million Forecast, by Vehicle Type 2020 & 2033
- Table 7: Global Electric LCV Market Revenue Million Forecast, by Power Output 2020 & 2033
- Table 8: Global Electric LCV Market Revenue Million Forecast, by Country 2020 & 2033
- Table 9: United States Electric LCV Market Revenue (Million) Forecast, by Application 2020 & 2033
- Table 10: Canada Electric LCV Market Revenue (Million) Forecast, by Application 2020 & 2033
- Table 11: Rest of North America Electric LCV Market Revenue (Million) Forecast, by Application 2020 & 2033
- Table 12: Global Electric LCV Market Revenue Million Forecast, by Propulsion Type 2020 & 2033
- Table 13: Global Electric LCV Market Revenue Million Forecast, by Vehicle Type 2020 & 2033
- Table 14: Global Electric LCV Market Revenue Million Forecast, by Power Output 2020 & 2033
- Table 15: Global Electric LCV Market Revenue Million Forecast, by Country 2020 & 2033
- Table 16: Germany Electric LCV Market Revenue (Million) Forecast, by Application 2020 & 2033
- Table 17: United Kingdom Electric LCV Market Revenue (Million) Forecast, by Application 2020 & 2033
- Table 18: France Electric LCV Market Revenue (Million) Forecast, by Application 2020 & 2033
- Table 19: Rest of Europe Electric LCV Market Revenue (Million) Forecast, by Application 2020 & 2033
- Table 20: Global Electric LCV Market Revenue Million Forecast, by Propulsion Type 2020 & 2033
- Table 21: Global Electric LCV Market Revenue Million Forecast, by Vehicle Type 2020 & 2033
- Table 22: Global Electric LCV Market Revenue Million Forecast, by Power Output 2020 & 2033
- Table 23: Global Electric LCV Market Revenue Million Forecast, by Country 2020 & 2033
- Table 24: India Electric LCV Market Revenue (Million) Forecast, by Application 2020 & 2033
- Table 25: China Electric LCV Market Revenue (Million) Forecast, by Application 2020 & 2033
- Table 26: Japan Electric LCV Market Revenue (Million) Forecast, by Application 2020 & 2033
- Table 27: South Korea Electric LCV Market Revenue (Million) Forecast, by Application 2020 & 2033
- Table 28: Rest of Asia Pacific Electric LCV Market Revenue (Million) Forecast, by Application 2020 & 2033
- Table 29: Global Electric LCV Market Revenue Million Forecast, by Propulsion Type 2020 & 2033
- Table 30: Global Electric LCV Market Revenue Million Forecast, by Vehicle Type 2020 & 2033
- Table 31: Global Electric LCV Market Revenue Million Forecast, by Power Output 2020 & 2033
- Table 32: Global Electric LCV Market Revenue Million Forecast, by Country 2020 & 2033
- Table 33: Brazil Electric LCV Market Revenue (Million) Forecast, by Application 2020 & 2033
- Table 34: Mexico Electric LCV Market Revenue (Million) Forecast, by Application 2020 & 2033
- Table 35: United Arab Emirates Electric LCV Market Revenue (Million) Forecast, by Application 2020 & 2033
- Table 36: Other Countries Electric LCV Market Revenue (Million) Forecast, by Application 2020 & 2033
Frequently Asked Questions
1. What is the projected Compound Annual Growth Rate (CAGR) of the Electric LCV Market?
The projected CAGR is approximately 36.40%.
2. Which companies are prominent players in the Electric LCV Market?
Key companies in the market include Tata Motors Limite, Volkswagen AG, Nissan Motor Co, Renault Group, Groupe PSA, Mahindra and Mahindra Ltd, BYD Group, Tesla Inc, Arrival Ltd, Rivian Automotive, BAIC Group.
3. What are the main segments of the Electric LCV Market?
The market segments include Propulsion Type, Vehicle Type, Power Output.
4. Can you provide details about the market size?
The market size is estimated to be USD 32.15 Million as of 2022.
5. What are some drivers contributing to market growth?
Growing Travel and Tourism Industry is Driving the Car Rental Market.
6. What are the notable trends driving market growth?
Electric Van is Leading the Electric LCV Market.
7. Are there any restraints impacting market growth?
Increasing Popularity of Ride-Sharing Services Pose Challenges for the Conventional Car Rental Market.
8. Can you provide examples of recent developments in the market?
N/A
9. What pricing options are available for accessing the report?
Pricing options include single-user, multi-user, and enterprise licenses priced at USD 4750, USD 5250, and USD 8750 respectively.
10. Is the market size provided in terms of value or volume?
The market size is provided in terms of value, measured in Million.
11. Are there any specific market keywords associated with the report?
Yes, the market keyword associated with the report is "Electric LCV Market," which aids in identifying and referencing the specific market segment covered.
12. How do I determine which pricing option suits my needs best?
The pricing options vary based on user requirements and access needs. Individual users may opt for single-user licenses, while businesses requiring broader access may choose multi-user or enterprise licenses for cost-effective access to the report.
13. Are there any additional resources or data provided in the Electric LCV Market report?
While the report offers comprehensive insights, it's advisable to review the specific contents or supplementary materials provided to ascertain if additional resources or data are available.
14. How can I stay updated on further developments or reports in the Electric LCV Market?
To stay informed about further developments, trends, and reports in the Electric LCV Market, consider subscribing to industry newsletters, following relevant companies and organizations, or regularly checking reputable industry news sources and publications.
Methodology
Step 1 - Identification of Relevant Samples Size from Population Database


Step 2 - Approaches for Defining Global Market Size (Value, Volume* & Price*)

Note*: In applicable scenarios
Step 3 - Data Sources
Primary Research
- Web Analytics
- Survey Reports
- Research Institute
- Latest Research Reports
- Opinion Leaders
Secondary Research
- Annual Reports
- White Paper
- Latest Press Release
- Industry Association
- Paid Database
- Investor Presentations

Step 4 - Data Triangulation
Involves using different sources of information in order to increase the validity of a study
These sources are likely to be stakeholders in a program - participants, other researchers, program staff, other community members, and so on.
Then we put all data in single framework & apply various statistical tools to find out the dynamic on the market.
During the analysis stage, feedback from the stakeholder groups would be compared to determine areas of agreement as well as areas of divergence