

Key Insights
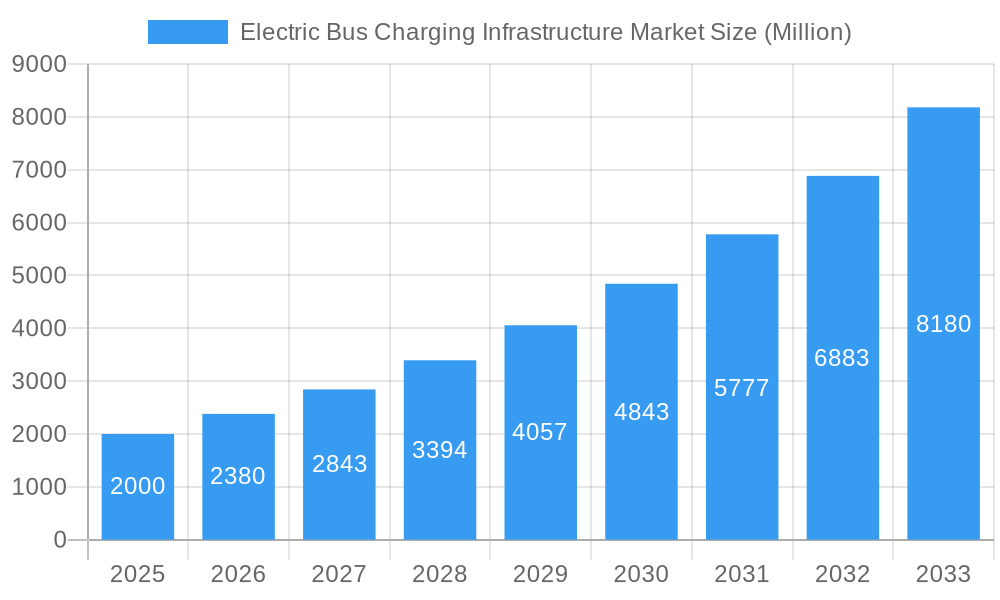
The electric bus charging infrastructure market is experiencing robust growth, driven by the increasing adoption of electric buses globally to mitigate environmental concerns and improve air quality in urban areas. A compound annual growth rate (CAGR) of 19% from 2019 to 2024 indicates significant market expansion. This growth is fueled by supportive government policies promoting sustainable transportation, rising fuel costs, and advancements in battery technology leading to longer operational ranges for electric buses. The market segmentation reveals a strong preference for plug-in charging solutions, although overhead charging systems are also gaining traction, particularly in depot settings allowing for faster and more efficient charging. Key players like ChargePoint, ABB, and BYD are leading the charge, actively investing in research and development to enhance charging infrastructure capabilities and reliability. Geographic analysis suggests North America and Europe currently dominate the market due to early adoption and established electric bus fleets. However, rapidly developing economies in Asia-Pacific, particularly China and India, are poised for significant growth in the coming years, driven by ambitious urbanization plans and expanding public transportation networks. The market is expected to continue its upward trajectory, with the forecast period (2025-2033) promising further expansion.
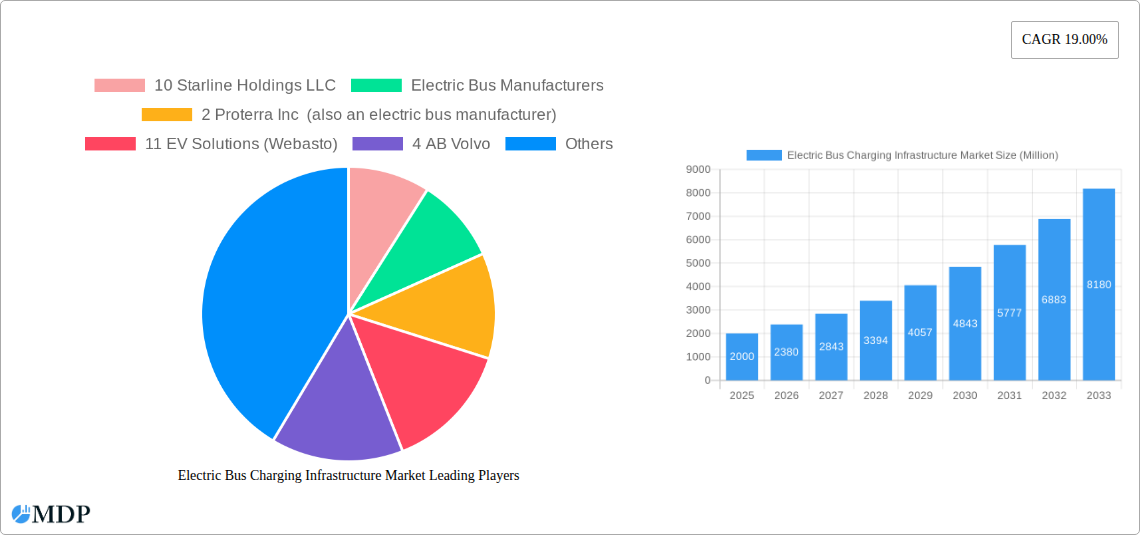
Electric Bus Charging Infrastructure Market Market Size (In Billion)
The restraints on market growth primarily relate to the high initial investment costs associated with installing charging infrastructure, the need for extensive grid upgrades to accommodate increased power demand, and the ongoing development of standardized charging protocols. Despite these challenges, the long-term benefits of reduced emissions and improved public transportation efficiency are expected to outweigh the initial hurdles. The market’s success will hinge on continued technological advancements, cost reductions in charging infrastructure, and the development of robust, reliable charging networks capable of supporting larger electric bus fleets. Further, collaborative efforts between governments, charging infrastructure providers, and electric bus manufacturers are crucial in creating a conducive ecosystem for widespread adoption. The ongoing expansion of electric bus fleets worldwide strongly suggests a sustained period of growth and innovation within this dynamic market sector.
Electric Bus Charging Infrastructure Market Company Market Share
Electric Bus Charging Infrastructure Market: A Comprehensive Report (2019-2033)
This in-depth report provides a comprehensive analysis of the Electric Bus Charging Infrastructure Market, offering actionable insights for stakeholders across the industry value chain. From market dynamics and leading players to emerging opportunities and future trends, this report equips you with the knowledge to navigate the rapidly evolving landscape of electric transportation. The report covers the period from 2019 to 2033, with a base year of 2025 and a forecast period from 2025 to 2033. Key segments analyzed include Plug-in Charging and Overhead Charging. The market is valued in Millions.
Electric Bus Charging Infrastructure Market Dynamics & Concentration
The Electric Bus Charging Infrastructure Market is experiencing significant growth, driven by the global shift towards sustainable transportation and stringent emission regulations. Market concentration is moderate, with a mix of established players and emerging companies vying for market share. Several key factors influence market dynamics:
Innovation Drivers: Continuous advancements in charging technologies, including faster charging speeds and wireless charging, are driving market expansion. The development of intelligent charging management systems further enhances efficiency and grid stability.
Regulatory Frameworks: Government incentives, subsidies, and mandates for electric bus adoption are crucial catalysts for market growth. These policies vary across regions, influencing market dynamics significantly.
Product Substitutes: While alternatives exist (e.g., hydrogen fuel cell buses), electric buses currently hold a leading position due to lower operational costs and readily available charging infrastructure.
End-User Trends: Fleets and public transportation authorities are major drivers of demand, as they seek environmentally friendly and cost-effective solutions. Consumer preferences for eco-friendly public transport also contribute to market growth.
M&A Activities: The sector has witnessed several mergers and acquisitions (M&A) in recent years, indicating increased consolidation and competition. xx M&A deals were recorded in the past five years, with an average market share of xx% for the top 5 players. These activities are driven by the desire to expand market reach, gain technological expertise, and secure supply chains.
Electric Bus Charging Infrastructure Market Industry Trends & Analysis
The Electric Bus Charging Infrastructure Market exhibits robust growth, with a projected Compound Annual Growth Rate (CAGR) of xx% during the forecast period (2025-2033). Market penetration is increasing steadily, driven by factors including:
Technological Disruptions: The emergence of fast-charging technologies, smart charging infrastructure, and wireless charging solutions is significantly shaping market trends.
Government Policies & Subsidies: Supportive government regulations and financial incentives are accelerating the adoption of electric buses and their corresponding charging infrastructure.
Growing Environmental Concerns: Rising awareness about air pollution and climate change is fueling the demand for cleaner transportation solutions, increasing the market demand.
Decreasing Battery Costs: Reductions in battery prices are making electric buses more economically viable, enhancing market attractiveness.
Competitive Dynamics: Intense competition among charging infrastructure providers is driving innovation and price optimization, leading to a greater variety of products and services.
Leading Markets & Segments in Electric Bus Charging Infrastructure Market
The Electric Bus Charging Infrastructure Market is geographically diverse, with significant growth witnessed in several regions. [Dominant Region/Country] currently holds the leading position, driven by:
Plug-in Charging: Remains the dominant charging type, due to its maturity, lower cost, and ease of implementation. Key drivers include extensive deployment of existing charging infrastructure, availability of compatible buses, and government incentives.
Overhead Charging: This segment is experiencing growth, albeit at a slower pace than Plug-in Charging. Key drivers include suitability for high-frequency bus routes and the possibility for opportunity charging.
Key Drivers (for Dominant Region/Country):
- Favorable government policies and substantial investments in public transport infrastructure.
- A large and expanding fleet of electric buses.
- Rapid urbanization and increasing commuting needs.
- Growing environmental awareness and commitment to sustainable development.
The detailed analysis within the full report provides a more in-depth breakdown of these regions and segments.
Electric Bus Charging Infrastructure Market Product Developments
Recent product innovations focus on improving charging speed, efficiency, and reliability. Manufacturers are introducing smart charging solutions, integrating renewable energy sources, and developing advanced power electronics. These advancements are tailored to meet the specific needs of various applications, from depot charging to opportunity charging along bus routes. The competitive advantage lies in offering technologically superior products, robust service and support, and cost-effective solutions.
Key Drivers of Electric Bus Charging Infrastructure Market Growth
Several factors contribute to the market's growth trajectory:
Technological advancements: Faster charging technologies, wireless charging, and smart grid integration are boosting market adoption.
Government regulations: Stringent emission standards and incentives for electric bus adoption are accelerating market growth.
Economic factors: Decreasing battery costs and the long-term cost savings associated with electric buses are making them attractive.
For example, the Buy America Act mandates the use of domestically produced components, driving local manufacturing of charging infrastructure.
Challenges in the Electric Bus Charging Infrastructure Market
Several challenges impede market growth:
High initial investment costs: The installation of charging infrastructure requires significant upfront capital.
Supply chain disruptions: Potential delays and price volatility in the supply of critical materials can impact deployment.
Interoperability issues: Lack of standardization in charging technologies can hinder seamless integration across different systems. This results in a xx% reduction in potential deployments each year.
Emerging Opportunities in Electric Bus Charging Infrastructure Market
The market offers substantial long-term growth potential due to technological advancements in battery technology, development of high-power charging solutions, and expansion of electric bus fleets. Strategic partnerships between charging infrastructure providers and electric bus manufacturers are also crucial for driving market growth. Furthermore, expansion into new and developing markets presents considerable opportunities.
Leading Players in the Electric Bus Charging Infrastructure Market Sector
- 10 Starline Holdings LLC
- 2 Proterra Inc
- 11 EV Solutions (Webasto)
- 4 AB Volvo
- 3 ChargePoint Inc (ChargePoint)
- 1 BYD Auto Co Ltd (BYD Auto)
- 1 ABB Ltd (ABB)
- 8 Heliox Energy
- 6 ALSTOM (Alstom)
- 5 Zhengzhou Yutong Bus Co Ltd
- 7 SemaConnect Inc
- 2 Mercedes-Benz AG (Mercedes-Benz)
- 3 Traton SE
- 4 Siemens AG (Siemens)
- 7 NFI Group Inc
- 5 Schneider Electric SE (Schneider Electric)
- 6 IVECO S p A
- 9 Vital EV Solutions
Key Milestones in Electric Bus Charging Infrastructure Market Industry
- November 2022: ABB E-Mobility secured USD 214 Million in pre-IPO funding, boosting its growth strategy.
- September 2022: ABB E-Mobility commenced operations in Columbia, South Carolina, creating over 100 jobs and increasing production capacity.
- August 2022: Siemens and MAHLE Group partnered to develop wireless charging systems for electric vehicles, advancing inductive charging technology.
Strategic Outlook for Electric Bus Charging Infrastructure Market Market
The Electric Bus Charging Infrastructure Market is poised for continued expansion, driven by supportive government policies, technological innovation, and increasing demand for sustainable transportation. Strategic partnerships, investments in research and development, and expansion into new markets will be crucial for success in this dynamic sector. The potential for growth in both developed and developing countries presents a significant opportunity for companies to establish a strong market position and capture a considerable share of the expanding market.
Electric Bus Charging Infrastructure Market Segmentation
-
1. Charging Type
- 1.1. Plug-in Charging
- 1.2. Overhead Charging
Electric Bus Charging Infrastructure Market Segmentation By Geography
-
1. North America
- 1.1. United States
- 1.2. Canada
- 1.3. Rest of North America
-
2. Europe
- 2.1. Germany
- 2.2. United Kingdom
- 2.3. France
- 2.4. Italy
- 2.5. Spain
- 2.6. Rest of Europe
-
3. Asia Pacific
- 3.1. China
- 3.2. India
- 3.3. Japan
- 3.4. South Korea
- 3.5. Rest of Asia Pacific
-
4. Rest of the World
- 4.1. South America
- 4.2. Middle East and Africa

Electric Bus Charging Infrastructure Market Regional Market Share
Geographic Coverage of Electric Bus Charging Infrastructure Market
Electric Bus Charging Infrastructure Market REPORT HIGHLIGHTS
| Aspects | Details |
|---|---|
| Study Period | 2020-2034 |
| Base Year | 2025 |
| Estimated Year | 2026 |
| Forecast Period | 2026-2034 |
| Historical Period | 2020-2025 |
| Growth Rate | CAGR of 19.00% from 2020-2034 |
| Segmentation |
|
Table of Contents
- 1. Introduction
- 1.1. Research Scope
- 1.2. Market Segmentation
- 1.3. Research Objective
- 1.4. Definitions and Assumptions
- 2. Executive Summary
- 2.1. Market Snapshot
- 3. Market Dynamics
- 3.1. Market Drivers
- 3.2. Market Restrains
- 3.3. Market Trends
- 3.4. Market Opportunities
- 4. Market Factor Analysis
- 4.1. Porters Five Forces
- 4.1.1. Bargaining Power of Suppliers
- 4.1.2. Bargaining Power of Buyers
- 4.1.3. Threat of New Entrants
- 4.1.4. Threat of Substitutes
- 4.1.5. Competitive Rivalry
- 4.2. PESTEL analysis
- 4.3. BCG Analysis
- 4.3.1. Stars (High Growth, High Market Share)
- 4.3.2. Cash Cows (Low Growth, High Market Share)
- 4.3.3. Question Mark (High Growth, Low Market Share)
- 4.3.4. Dogs (Low Growth, Low Market Share)
- 4.4. Ansoff Matrix Analysis
- 4.5. Supply Chain Analysis
- 4.6. Regulatory Landscape
- 4.7. Current Market Potential and Opportunity Assessment (TAM–SAM–SOM Framework)
- 4.8. MDP Analyst Note
- 4.1. Porters Five Forces
- 5. Market Analysis, Insights and Forecast 2021-2033
- 5.1. Market Analysis, Insights and Forecast - by Charging Type
- 5.1.1. Plug-in Charging
- 5.1.2. Overhead Charging
- 5.2. Market Analysis, Insights and Forecast - by Region
- 5.2.1. North America
- 5.2.2. Europe
- 5.2.3. Asia Pacific
- 5.2.4. Rest of the World
- 5.1. Market Analysis, Insights and Forecast - by Charging Type
- 6. Global Electric Bus Charging Infrastructure Market Analysis, Insights and Forecast, 2021-2033
- 6.1. Market Analysis, Insights and Forecast - by Charging Type
- 6.1.1. Plug-in Charging
- 6.1.2. Overhead Charging
- 6.1. Market Analysis, Insights and Forecast - by Charging Type
- 7. North America Electric Bus Charging Infrastructure Market Analysis, Insights and Forecast, 2020-2032
- 7.1. Market Analysis, Insights and Forecast - by Charging Type
- 7.1.1. Plug-in Charging
- 7.1.2. Overhead Charging
- 7.1. Market Analysis, Insights and Forecast - by Charging Type
- 8. Europe Electric Bus Charging Infrastructure Market Analysis, Insights and Forecast, 2020-2032
- 8.1. Market Analysis, Insights and Forecast - by Charging Type
- 8.1.1. Plug-in Charging
- 8.1.2. Overhead Charging
- 8.1. Market Analysis, Insights and Forecast - by Charging Type
- 9. Asia Pacific Electric Bus Charging Infrastructure Market Analysis, Insights and Forecast, 2020-2032
- 9.1. Market Analysis, Insights and Forecast - by Charging Type
- 9.1.1. Plug-in Charging
- 9.1.2. Overhead Charging
- 9.1. Market Analysis, Insights and Forecast - by Charging Type
- 10. Rest of the World Electric Bus Charging Infrastructure Market Analysis, Insights and Forecast, 2020-2032
- 10.1. Market Analysis, Insights and Forecast - by Charging Type
- 10.1.1. Plug-in Charging
- 10.1.2. Overhead Charging
- 10.1. Market Analysis, Insights and Forecast - by Charging Type
- 11. Competitive Analysis
- 11.1. Company Profiles
- 11.1.1 10 Starline Holdings LLC
- 11.1.1.1. Company Overview
- 11.1.1.2. Products
- 11.1.1.3. Company Financials
- 11.1.1.4. SWOT Analysis
- 11.1.2 Electric Bus Manufacturers
- 11.1.2.1. Company Overview
- 11.1.2.2. Products
- 11.1.2.3. Company Financials
- 11.1.2.4. SWOT Analysis
- 11.1.3 2 Proterra Inc (also an electric bus manufacturer)
- 11.1.3.1. Company Overview
- 11.1.3.2. Products
- 11.1.3.3. Company Financials
- 11.1.3.4. SWOT Analysis
- 11.1.4 11 EV Solutions (Webasto)
- 11.1.4.1. Company Overview
- 11.1.4.2. Products
- 11.1.4.3. Company Financials
- 11.1.4.4. SWOT Analysis
- 11.1.5 4 AB Volvo
- 11.1.5.1. Company Overview
- 11.1.5.2. Products
- 11.1.5.3. Company Financials
- 11.1.5.4. SWOT Analysis
- 11.1.6 3 ChargePoint Inc
- 11.1.6.1. Company Overview
- 11.1.6.2. Products
- 11.1.6.3. Company Financials
- 11.1.6.4. SWOT Analysis
- 11.1.7 1 BYD Auto Co Ltd
- 11.1.7.1. Company Overview
- 11.1.7.2. Products
- 11.1.7.3. Company Financials
- 11.1.7.4. SWOT Analysis
- 11.1.8 1 ABB Ltd
- 11.1.8.1. Company Overview
- 11.1.8.2. Products
- 11.1.8.3. Company Financials
- 11.1.8.4. SWOT Analysis
- 11.1.9 8 Heliox Energy
- 11.1.9.1. Company Overview
- 11.1.9.2. Products
- 11.1.9.3. Company Financials
- 11.1.9.4. SWOT Analysis
- 11.1.10 6 ALSTOM
- 11.1.10.1. Company Overview
- 11.1.10.2. Products
- 11.1.10.3. Company Financials
- 11.1.10.4. SWOT Analysis
- 11.1.11 5 Zhengzhou Yutong Bus Co Ltd
- 11.1.11.1. Company Overview
- 11.1.11.2. Products
- 11.1.11.3. Company Financials
- 11.1.11.4. SWOT Analysis
- 11.1.12 7 SemaConnect Inc
- 11.1.12.1. Company Overview
- 11.1.12.2. Products
- 11.1.12.3. Company Financials
- 11.1.12.4. SWOT Analysis
- 11.1.13 2 Mercedes-Benz AG
- 11.1.13.1. Company Overview
- 11.1.13.2. Products
- 11.1.13.3. Company Financials
- 11.1.13.4. SWOT Analysis
- 11.1.14 3 Traton SE
- 11.1.14.1. Company Overview
- 11.1.14.2. Products
- 11.1.14.3. Company Financials
- 11.1.14.4. SWOT Analysis
- 11.1.15 4 Siemens AG
- 11.1.15.1. Company Overview
- 11.1.15.2. Products
- 11.1.15.3. Company Financials
- 11.1.15.4. SWOT Analysis
- 11.1.16 7 NFI Group Inc
- 11.1.16.1. Company Overview
- 11.1.16.2. Products
- 11.1.16.3. Company Financials
- 11.1.16.4. SWOT Analysis
- 11.1.17 5 Schneider Electric SE
- 11.1.17.1. Company Overview
- 11.1.17.2. Products
- 11.1.17.3. Company Financials
- 11.1.17.4. SWOT Analysis
- 11.1.18 6 IVECO S p A
- 11.1.18.1. Company Overview
- 11.1.18.2. Products
- 11.1.18.3. Company Financials
- 11.1.18.4. SWOT Analysis
- 11.1.19 9 Vital EV Solutions
- 11.1.19.1. Company Overview
- 11.1.19.2. Products
- 11.1.19.3. Company Financials
- 11.1.19.4. SWOT Analysis
- 11.1.20 Electric Charging Infrastructure Suppliers
- 11.1.20.1. Company Overview
- 11.1.20.2. Products
- 11.1.20.3. Company Financials
- 11.1.20.4. SWOT Analysis
- 11.1.1 10 Starline Holdings LLC
- 11.2. Market Entropy
- 11.2.1 Company's Key Areas Served
- 11.2.2 Recent Developments
- 11.3. Company Market Share Analysis 2025
- 11.3.1 Top 5 Companies Market Share Analysis
- 11.3.2 Top 3 Companies Market Share Analysis
- 11.4. List of Potential Customers
- 12. Research Methodology
List of Figures
- Figure 1: Global Electric Bus Charging Infrastructure Market Revenue Breakdown (Million, %) by Region 2025 & 2033
- Figure 2: North America Electric Bus Charging Infrastructure Market Revenue (Million), by Charging Type 2025 & 2033
- Figure 3: North America Electric Bus Charging Infrastructure Market Revenue Share (%), by Charging Type 2025 & 2033
- Figure 4: North America Electric Bus Charging Infrastructure Market Revenue (Million), by Country 2025 & 2033
- Figure 5: North America Electric Bus Charging Infrastructure Market Revenue Share (%), by Country 2025 & 2033
- Figure 6: Europe Electric Bus Charging Infrastructure Market Revenue (Million), by Charging Type 2025 & 2033
- Figure 7: Europe Electric Bus Charging Infrastructure Market Revenue Share (%), by Charging Type 2025 & 2033
- Figure 8: Europe Electric Bus Charging Infrastructure Market Revenue (Million), by Country 2025 & 2033
- Figure 9: Europe Electric Bus Charging Infrastructure Market Revenue Share (%), by Country 2025 & 2033
- Figure 10: Asia Pacific Electric Bus Charging Infrastructure Market Revenue (Million), by Charging Type 2025 & 2033
- Figure 11: Asia Pacific Electric Bus Charging Infrastructure Market Revenue Share (%), by Charging Type 2025 & 2033
- Figure 12: Asia Pacific Electric Bus Charging Infrastructure Market Revenue (Million), by Country 2025 & 2033
- Figure 13: Asia Pacific Electric Bus Charging Infrastructure Market Revenue Share (%), by Country 2025 & 2033
- Figure 14: Rest of the World Electric Bus Charging Infrastructure Market Revenue (Million), by Charging Type 2025 & 2033
- Figure 15: Rest of the World Electric Bus Charging Infrastructure Market Revenue Share (%), by Charging Type 2025 & 2033
- Figure 16: Rest of the World Electric Bus Charging Infrastructure Market Revenue (Million), by Country 2025 & 2033
- Figure 17: Rest of the World Electric Bus Charging Infrastructure Market Revenue Share (%), by Country 2025 & 2033
List of Tables
- Table 1: Global Electric Bus Charging Infrastructure Market Revenue Million Forecast, by Charging Type 2020 & 2033
- Table 2: Global Electric Bus Charging Infrastructure Market Revenue Million Forecast, by Region 2020 & 2033
- Table 3: Global Electric Bus Charging Infrastructure Market Revenue Million Forecast, by Charging Type 2020 & 2033
- Table 4: Global Electric Bus Charging Infrastructure Market Revenue Million Forecast, by Country 2020 & 2033
- Table 5: United States Electric Bus Charging Infrastructure Market Revenue (Million) Forecast, by Application 2020 & 2033
- Table 6: Canada Electric Bus Charging Infrastructure Market Revenue (Million) Forecast, by Application 2020 & 2033
- Table 7: Rest of North America Electric Bus Charging Infrastructure Market Revenue (Million) Forecast, by Application 2020 & 2033
- Table 8: Global Electric Bus Charging Infrastructure Market Revenue Million Forecast, by Charging Type 2020 & 2033
- Table 9: Global Electric Bus Charging Infrastructure Market Revenue Million Forecast, by Country 2020 & 2033
- Table 10: Germany Electric Bus Charging Infrastructure Market Revenue (Million) Forecast, by Application 2020 & 2033
- Table 11: United Kingdom Electric Bus Charging Infrastructure Market Revenue (Million) Forecast, by Application 2020 & 2033
- Table 12: France Electric Bus Charging Infrastructure Market Revenue (Million) Forecast, by Application 2020 & 2033
- Table 13: Italy Electric Bus Charging Infrastructure Market Revenue (Million) Forecast, by Application 2020 & 2033
- Table 14: Spain Electric Bus Charging Infrastructure Market Revenue (Million) Forecast, by Application 2020 & 2033
- Table 15: Rest of Europe Electric Bus Charging Infrastructure Market Revenue (Million) Forecast, by Application 2020 & 2033
- Table 16: Global Electric Bus Charging Infrastructure Market Revenue Million Forecast, by Charging Type 2020 & 2033
- Table 17: Global Electric Bus Charging Infrastructure Market Revenue Million Forecast, by Country 2020 & 2033
- Table 18: China Electric Bus Charging Infrastructure Market Revenue (Million) Forecast, by Application 2020 & 2033
- Table 19: India Electric Bus Charging Infrastructure Market Revenue (Million) Forecast, by Application 2020 & 2033
- Table 20: Japan Electric Bus Charging Infrastructure Market Revenue (Million) Forecast, by Application 2020 & 2033
- Table 21: South Korea Electric Bus Charging Infrastructure Market Revenue (Million) Forecast, by Application 2020 & 2033
- Table 22: Rest of Asia Pacific Electric Bus Charging Infrastructure Market Revenue (Million) Forecast, by Application 2020 & 2033
- Table 23: Global Electric Bus Charging Infrastructure Market Revenue Million Forecast, by Charging Type 2020 & 2033
- Table 24: Global Electric Bus Charging Infrastructure Market Revenue Million Forecast, by Country 2020 & 2033
- Table 25: South America Electric Bus Charging Infrastructure Market Revenue (Million) Forecast, by Application 2020 & 2033
- Table 26: Middle East and Africa Electric Bus Charging Infrastructure Market Revenue (Million) Forecast, by Application 2020 & 2033
Frequently Asked Questions
1. What is the projected Compound Annual Growth Rate (CAGR) of the Electric Bus Charging Infrastructure Market?
The projected CAGR is approximately 19.00%.
2. Which companies are prominent players in the Electric Bus Charging Infrastructure Market?
Key companies in the market include 10 Starline Holdings LLC, Electric Bus Manufacturers, 2 Proterra Inc (also an electric bus manufacturer), 11 EV Solutions (Webasto), 4 AB Volvo, 3 ChargePoint Inc, 1 BYD Auto Co Ltd, 1 ABB Ltd, 8 Heliox Energy, 6 ALSTOM, 5 Zhengzhou Yutong Bus Co Ltd, 7 SemaConnect Inc, 2 Mercedes-Benz AG, 3 Traton SE, 4 Siemens AG, 7 NFI Group Inc, 5 Schneider Electric SE, 6 IVECO S p A, 9 Vital EV Solutions, Electric Charging Infrastructure Suppliers.
3. What are the main segments of the Electric Bus Charging Infrastructure Market?
The market segments include Charging Type.
4. Can you provide details about the market size?
The market size is estimated to be USD 2 Million as of 2022.
5. What are some drivers contributing to market growth?
Rising Adoption of Electric Buses.
6. What are the notable trends driving market growth?
Governmental Efforts to Increase in the Number of Electric Buses Will Boost Overhead Charging Type.
7. Are there any restraints impacting market growth?
High Upfront Investment.
8. Can you provide examples of recent developments in the market?
November 2022: ABB E-Mobility, the electric vehicle charging solutions subsidiary of ABB Ltd., successfully raised CHF 200 million (USD 214 million) in a pre-IPO private placement led by a group of minority investors. The capital infusion will play a crucial role in supporting the company's growth strategy, which includes pursuing both organic and inorganic opportunities, such as potential mergers and acquisitions. The transaction is expected to be finalized in the fourth quarter of 2022.
9. What pricing options are available for accessing the report?
Pricing options include single-user, multi-user, and enterprise licenses priced at USD 4750, USD 5250, and USD 8750 respectively.
10. Is the market size provided in terms of value or volume?
The market size is provided in terms of value, measured in Million.
11. Are there any specific market keywords associated with the report?
Yes, the market keyword associated with the report is "Electric Bus Charging Infrastructure Market," which aids in identifying and referencing the specific market segment covered.
12. How do I determine which pricing option suits my needs best?
The pricing options vary based on user requirements and access needs. Individual users may opt for single-user licenses, while businesses requiring broader access may choose multi-user or enterprise licenses for cost-effective access to the report.
13. Are there any additional resources or data provided in the Electric Bus Charging Infrastructure Market report?
While the report offers comprehensive insights, it's advisable to review the specific contents or supplementary materials provided to ascertain if additional resources or data are available.
14. How can I stay updated on further developments or reports in the Electric Bus Charging Infrastructure Market?
To stay informed about further developments, trends, and reports in the Electric Bus Charging Infrastructure Market, consider subscribing to industry newsletters, following relevant companies and organizations, or regularly checking reputable industry news sources and publications.
Methodology
Step 1 - Identification of Relevant Samples Size from Population Database


Step 2 - Approaches for Defining Global Market Size (Value, Volume* & Price*)

Note*: In applicable scenarios
Step 3 - Data Sources
Primary Research
- Web Analytics
- Survey Reports
- Research Institute
- Latest Research Reports
- Opinion Leaders
Secondary Research
- Annual Reports
- White Paper
- Latest Press Release
- Industry Association
- Paid Database
- Investor Presentations

Step 4 - Data Triangulation
Involves using different sources of information in order to increase the validity of a study
These sources are likely to be stakeholders in a program - participants, other researchers, program staff, other community members, and so on.
Then we put all data in single framework & apply various statistical tools to find out the dynamic on the market.
During the analysis stage, feedback from the stakeholder groups would be compared to determine areas of agreement as well as areas of divergence