

Key Insights
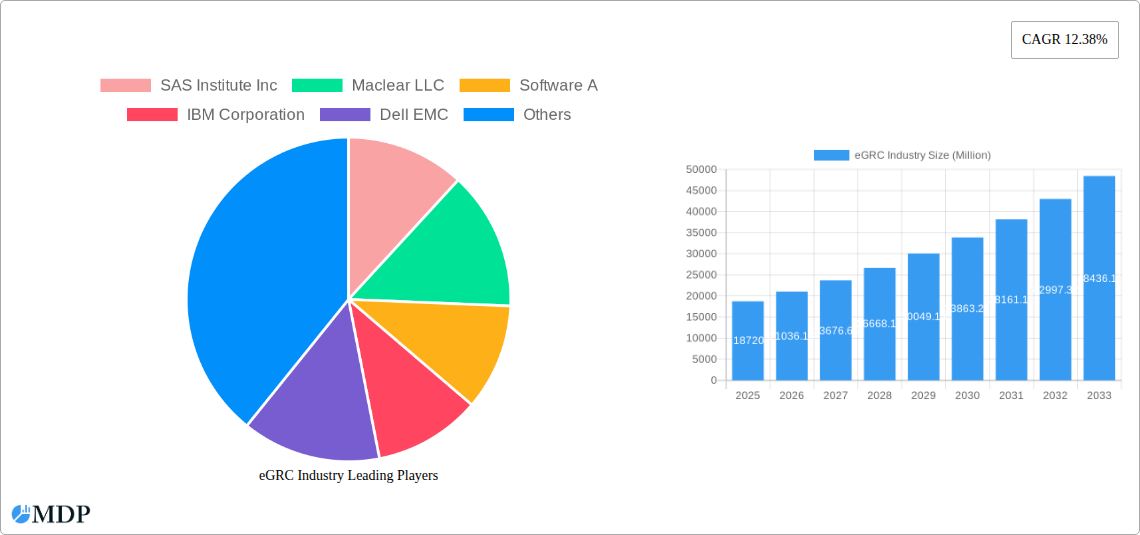
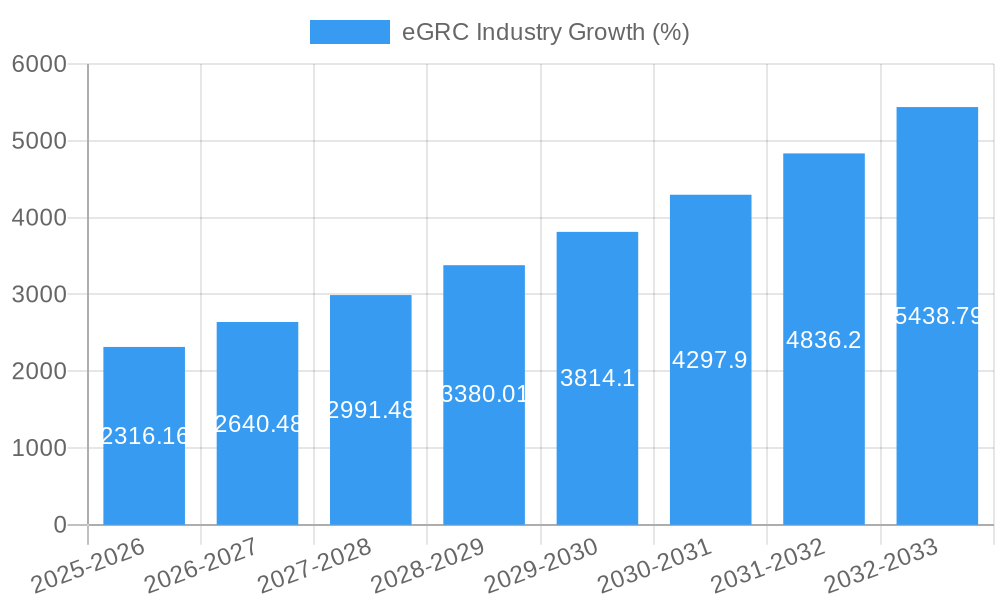
The global Enterprise Governance, Risk, and Compliance (eGRC) market is experiencing robust growth, projected to reach $18.72 billion in 2025, exhibiting a Compound Annual Growth Rate (CAGR) of 12.38% from 2019 to 2033. This expansion is fueled by increasing regulatory scrutiny across industries, the rising adoption of cloud-based solutions for enhanced security and compliance, and the growing need for efficient risk management frameworks among both small and medium-sized enterprises (SMEs) and large corporations. The BFSI (Banking, Financial Services, and Insurance), Healthcare, and Manufacturing sectors are significant drivers, with increasing digital transformation and data privacy regulations necessitating robust eGRC solutions. Software solutions dominate the market, followed by services encompassing implementation, consulting, and support. Large enterprises currently hold a larger market share due to their greater resources and complex compliance requirements; however, the SME segment is expected to witness significant growth driven by affordability and ease of use of newer eGRC solutions.
The market's trajectory is further shaped by several key trends. The increasing adoption of Artificial Intelligence (AI) and Machine Learning (ML) in eGRC platforms for automated risk identification and mitigation is gaining traction. Furthermore, the integration of eGRC with other enterprise solutions, such as cybersecurity and data management platforms, is enhancing overall operational efficiency and reducing the risk of data breaches and non-compliance. While the market faces constraints like the high initial investment costs of implementing comprehensive eGRC systems and the ongoing need for skilled professionals to manage these systems, the long-term benefits of reduced regulatory fines, improved operational efficiency, and enhanced risk mitigation outweigh these challenges. This continuous evolution and adaptation, along with rising awareness of data security and regulatory compliance, are poised to propel the eGRC market to sustained and significant growth in the coming years.
eGRC Industry Market Report: A Comprehensive Analysis (2019-2033)
This comprehensive report provides an in-depth analysis of the eGRC (electronic Governance, Risk, and Compliance) industry, projecting a market value of $XX Million by 2033. The study covers the period 2019-2033, with a focus on the 2025-2033 forecast period, and incorporates key market drivers, challenges, and opportunities. This report is essential for industry stakeholders, investors, and businesses seeking to understand the dynamics of this rapidly evolving sector.
eGRC Industry Market Dynamics & Concentration
The eGRC market is characterized by moderate concentration, with key players holding significant market share. The market share of the top 5 players is estimated at 40% in 2025, with SAS Institute Inc, IBM Corporation, Oracle Corporation, SAP SE, and Dell EMC leading the pack. Innovation is a key driver, fueled by the increasing need for robust security and compliance solutions. Stringent regulatory frameworks, particularly within BFSI and Healthcare, are also shaping market growth. Product substitutes, such as manual processes, are gradually being replaced by efficient eGRC solutions. End-user trends reveal a preference for cloud-based and integrated solutions. M&A activity in the sector is moderate, with an estimated XX M&A deals in 2024, indicating consolidation within the market.
- Market Share (2025): Top 5 players - 40%; Others - 60%
- M&A Deals (2024): XX
- Key Innovation Drivers: Cloud adoption, AI/ML integration, automation
- Regulatory Frameworks: GDPR, HIPAA, SOX
eGRC Industry Trends & Analysis
The eGRC market exhibits a robust Compound Annual Growth Rate (CAGR) of XX% during the forecast period (2025-2033). This growth is driven by several factors: the increasing complexity of regulatory requirements, rising cyber threats, and the growing need for efficient risk management across various industries. Technological disruptions, such as the adoption of AI and ML, are enhancing the capabilities of eGRC solutions, leading to higher market penetration. Consumer preferences are shifting towards cloud-based, user-friendly solutions, which offer scalability and cost-effectiveness. Competitive dynamics are characterized by continuous innovation and strategic partnerships to broaden market reach and product offerings. Market penetration in the BFSI sector is currently high at around XX%, with healthcare and manufacturing exhibiting significant growth potential.
Leading Markets & Segments in eGRC Industry
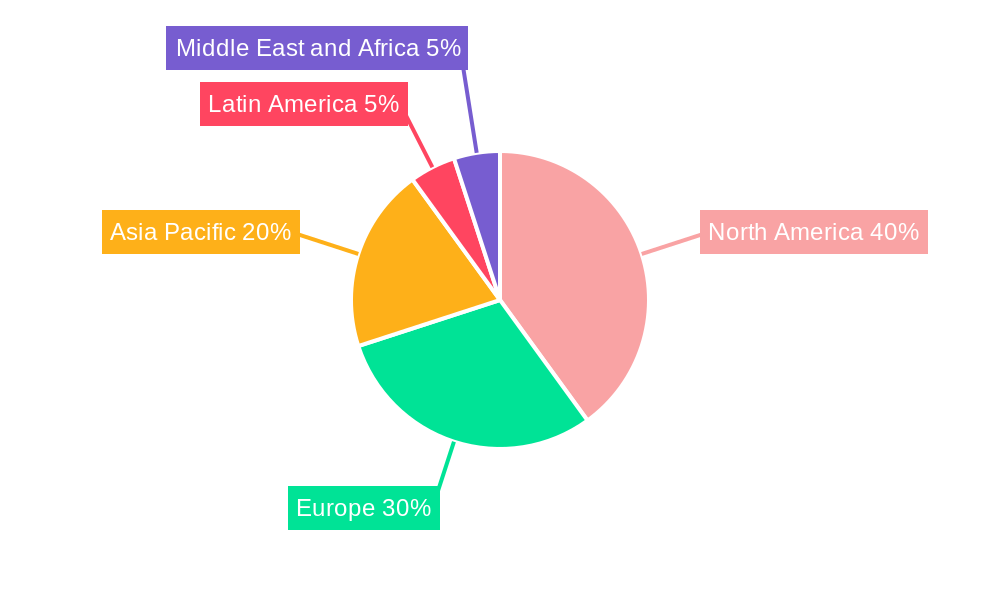
The North American region dominates the eGRC market, driven by strong regulatory compliance needs and high technological adoption rates. Within the segments, Large Enterprises account for the majority of market revenue (XX Million in 2025), due to their higher budgets and more complex regulatory needs. The BFSI sector holds the largest market share across end-user verticals.
- Dominant Region: North America
- Dominant Segment (Size of Enterprise): Large Enterprises (XX Million in 2025)
- Dominant Segment (End-User Industry): BFSI
- Key Drivers (North America): Stringent regulatory landscape, advanced IT infrastructure, high technological adoption rate.
- Key Drivers (BFSI): Strict regulatory compliance requirements (e.g., GDPR, CCPA), sensitive data protection needs, high risk of cyber threats.
eGRC Industry Product Developments
Recent product developments emphasize automation, integration, and enhanced user experience. Pathlock’s new Application Access Governance (AAG) product, launched in October 2023, exemplifies this trend by automating risk and compliance management processes. These developments are addressing the need for efficient and scalable solutions that streamline GRC operations and minimize compliance risks. The market is seeing a strong shift toward cloud-based, AI-powered solutions, and improved integrations with existing ERP systems.
Key Drivers of eGRC Industry Growth
The eGRC market’s growth is primarily driven by several factors. Firstly, increasing regulatory pressure across various sectors mandates strong GRC practices. Secondly, escalating cyber threats and data breaches necessitate robust security and compliance measures. Thirdly, technological advancements, such as AI and ML, are significantly improving the effectiveness and efficiency of eGRC solutions. Lastly, the increasing adoption of cloud-based technologies contributes to the growth of this market.
Challenges in the eGRC Industry Market
Despite significant growth potential, the eGRC market faces challenges. High implementation costs, particularly for smaller enterprises, are a major barrier. The complexity of integrating eGRC solutions with existing IT infrastructures can also hinder adoption. Furthermore, the evolving regulatory landscape presents ongoing challenges for vendors and users alike. Competition among established players and new entrants also creates pressure on pricing and innovation. These factors collectively limit market growth to a certain extent.
Emerging Opportunities in eGRC Industry
The eGRC market presents significant long-term growth opportunities. The increasing adoption of cloud-based and AI-powered solutions, coupled with the growing demand for integrated GRC platforms, offers significant potential for expansion. Strategic partnerships between eGRC vendors and other technology providers can unlock new market segments and enhance product offerings. Expanding into emerging economies with growing regulatory needs represents another avenue for growth.
Leading Players in the eGRC Industry Sector
- SAS Institute Inc
- Maclear LLC
- Software A
- IBM Corporation
- Dell EMC
- MetricStream Inc
- Wolters Kluwer
- Oracle Corporation
- Future Shield Inc
- SAP SE
Key Milestones in eGRC Industry Industry
- October 2023: Pathlock launches its new Application Access Governance (AAG) product, enhancing automation in risk and compliance management. This strengthens the market's focus on automation and efficiency.
- June 2023: Federal bank regulatory agencies issue final joint guidance on managing risks associated with third-party relationships, particularly in the Fintech space. This reinforces the importance of robust eGRC solutions within the BFSI sector.
Strategic Outlook for eGRC Industry Market
The eGRC market is poised for significant growth driven by increasing regulatory requirements, cybersecurity threats, and the continuous evolution of technology. The market is expected to witness an influx of innovative solutions leveraging AI and machine learning, further improving efficiency and reducing manual intervention. Companies focusing on strategic partnerships and expanding into new geographic markets are well-positioned to capture significant market share in the coming years. The shift towards cloud-based solutions will further drive market expansion.
eGRC Industry Segmentation
-
1. Type
- 1.1. Software
- 1.2. Services
-
2. Size of the Enterprise
- 2.1. Small and Medium Enterprise
- 2.2. Large Enterprise
-
3. End-User Industry
- 3.1. BFSI
- 3.2. Healthcare
- 3.3. Manufacturing
- 3.4. IT and Telecom
- 3.5. Other End-User Vertical
eGRC Industry Segmentation By Geography
- 1. North America
- 2. Europe
- 3. Asia Pacific
- 4. Latin America
- 5. Middle East and Africa
eGRC Industry REPORT HIGHLIGHTS
| Aspects | Details |
|---|---|
| Study Period | 2019-2033 |
| Base Year | 2024 |
| Estimated Year | 2025 |
| Forecast Period | 2025-2033 |
| Historical Period | 2019-2024 |
| Growth Rate | CAGR of 12.38% from 2019-2033 |
| Segmentation |
|
Table of Contents
- 1. Introduction
- 1.1. Research Scope
- 1.2. Market Segmentation
- 1.3. Research Methodology
- 1.4. Definitions and Assumptions
- 2. Executive Summary
- 2.1. Introduction
- 3. Market Dynamics
- 3.1. Introduction
- 3.2. Market Drivers
- 3.2.1. Stringent Government Regulations and Mandates; Cyber Security Threat Owing to Digitalization
- 3.3. Market Restrains
- 3.3.1. Lack of Awareness
- 3.4. Market Trends
- 3.4.1. Demand from BFSI segment is expected to Witness Significant Growth
- 4. Market Factor Analysis
- 4.1. Porters Five Forces
- 4.2. Supply/Value Chain
- 4.3. PESTEL analysis
- 4.4. Market Entropy
- 4.5. Patent/Trademark Analysis
- 5. Global eGRC Industry Analysis, Insights and Forecast, 2019-2031
- 5.1. Market Analysis, Insights and Forecast - by Type
- 5.1.1. Software
- 5.1.2. Services
- 5.2. Market Analysis, Insights and Forecast - by Size of the Enterprise
- 5.2.1. Small and Medium Enterprise
- 5.2.2. Large Enterprise
- 5.3. Market Analysis, Insights and Forecast - by End-User Industry
- 5.3.1. BFSI
- 5.3.2. Healthcare
- 5.3.3. Manufacturing
- 5.3.4. IT and Telecom
- 5.3.5. Other End-User Vertical
- 5.4. Market Analysis, Insights and Forecast - by Region
- 5.4.1. North America
- 5.4.2. Europe
- 5.4.3. Asia Pacific
- 5.4.4. Latin America
- 5.4.5. Middle East and Africa
- 5.1. Market Analysis, Insights and Forecast - by Type
- 6. North America eGRC Industry Analysis, Insights and Forecast, 2019-2031
- 6.1. Market Analysis, Insights and Forecast - by Type
- 6.1.1. Software
- 6.1.2. Services
- 6.2. Market Analysis, Insights and Forecast - by Size of the Enterprise
- 6.2.1. Small and Medium Enterprise
- 6.2.2. Large Enterprise
- 6.3. Market Analysis, Insights and Forecast - by End-User Industry
- 6.3.1. BFSI
- 6.3.2. Healthcare
- 6.3.3. Manufacturing
- 6.3.4. IT and Telecom
- 6.3.5. Other End-User Vertical
- 6.1. Market Analysis, Insights and Forecast - by Type
- 7. Europe eGRC Industry Analysis, Insights and Forecast, 2019-2031
- 7.1. Market Analysis, Insights and Forecast - by Type
- 7.1.1. Software
- 7.1.2. Services
- 7.2. Market Analysis, Insights and Forecast - by Size of the Enterprise
- 7.2.1. Small and Medium Enterprise
- 7.2.2. Large Enterprise
- 7.3. Market Analysis, Insights and Forecast - by End-User Industry
- 7.3.1. BFSI
- 7.3.2. Healthcare
- 7.3.3. Manufacturing
- 7.3.4. IT and Telecom
- 7.3.5. Other End-User Vertical
- 7.1. Market Analysis, Insights and Forecast - by Type
- 8. Asia Pacific eGRC Industry Analysis, Insights and Forecast, 2019-2031
- 8.1. Market Analysis, Insights and Forecast - by Type
- 8.1.1. Software
- 8.1.2. Services
- 8.2. Market Analysis, Insights and Forecast - by Size of the Enterprise
- 8.2.1. Small and Medium Enterprise
- 8.2.2. Large Enterprise
- 8.3. Market Analysis, Insights and Forecast - by End-User Industry
- 8.3.1. BFSI
- 8.3.2. Healthcare
- 8.3.3. Manufacturing
- 8.3.4. IT and Telecom
- 8.3.5. Other End-User Vertical
- 8.1. Market Analysis, Insights and Forecast - by Type
- 9. Latin America eGRC Industry Analysis, Insights and Forecast, 2019-2031
- 9.1. Market Analysis, Insights and Forecast - by Type
- 9.1.1. Software
- 9.1.2. Services
- 9.2. Market Analysis, Insights and Forecast - by Size of the Enterprise
- 9.2.1. Small and Medium Enterprise
- 9.2.2. Large Enterprise
- 9.3. Market Analysis, Insights and Forecast - by End-User Industry
- 9.3.1. BFSI
- 9.3.2. Healthcare
- 9.3.3. Manufacturing
- 9.3.4. IT and Telecom
- 9.3.5. Other End-User Vertical
- 9.1. Market Analysis, Insights and Forecast - by Type
- 10. Middle East and Africa eGRC Industry Analysis, Insights and Forecast, 2019-2031
- 10.1. Market Analysis, Insights and Forecast - by Type
- 10.1.1. Software
- 10.1.2. Services
- 10.2. Market Analysis, Insights and Forecast - by Size of the Enterprise
- 10.2.1. Small and Medium Enterprise
- 10.2.2. Large Enterprise
- 10.3. Market Analysis, Insights and Forecast - by End-User Industry
- 10.3.1. BFSI
- 10.3.2. Healthcare
- 10.3.3. Manufacturing
- 10.3.4. IT and Telecom
- 10.3.5. Other End-User Vertical
- 10.1. Market Analysis, Insights and Forecast - by Type
- 11. North America eGRC Industry Analysis, Insights and Forecast, 2019-2031
- 11.1. Market Analysis, Insights and Forecast - By Country/Sub-region
- 11.1.1.
- 12. Europe eGRC Industry Analysis, Insights and Forecast, 2019-2031
- 12.1. Market Analysis, Insights and Forecast - By Country/Sub-region
- 12.1.1.
- 13. Asia Pacific eGRC Industry Analysis, Insights and Forecast, 2019-2031
- 13.1. Market Analysis, Insights and Forecast - By Country/Sub-region
- 13.1.1.
- 14. Latin America eGRC Industry Analysis, Insights and Forecast, 2019-2031
- 14.1. Market Analysis, Insights and Forecast - By Country/Sub-region
- 14.1.1.
- 15. Middle East and Africa eGRC Industry Analysis, Insights and Forecast, 2019-2031
- 15.1. Market Analysis, Insights and Forecast - By Country/Sub-region
- 15.1.1.
- 16. Competitive Analysis
- 16.1. Global Market Share Analysis 2024
- 16.2. Company Profiles
- 16.2.1 SAS Institute Inc
- 16.2.1.1. Overview
- 16.2.1.2. Products
- 16.2.1.3. SWOT Analysis
- 16.2.1.4. Recent Developments
- 16.2.1.5. Financials (Based on Availability)
- 16.2.2 Maclear LLC
- 16.2.2.1. Overview
- 16.2.2.2. Products
- 16.2.2.3. SWOT Analysis
- 16.2.2.4. Recent Developments
- 16.2.2.5. Financials (Based on Availability)
- 16.2.3 Software A
- 16.2.3.1. Overview
- 16.2.3.2. Products
- 16.2.3.3. SWOT Analysis
- 16.2.3.4. Recent Developments
- 16.2.3.5. Financials (Based on Availability)
- 16.2.4 IBM Corporation
- 16.2.4.1. Overview
- 16.2.4.2. Products
- 16.2.4.3. SWOT Analysis
- 16.2.4.4. Recent Developments
- 16.2.4.5. Financials (Based on Availability)
- 16.2.5 Dell EMC
- 16.2.5.1. Overview
- 16.2.5.2. Products
- 16.2.5.3. SWOT Analysis
- 16.2.5.4. Recent Developments
- 16.2.5.5. Financials (Based on Availability)
- 16.2.6 MetricStream Inc
- 16.2.6.1. Overview
- 16.2.6.2. Products
- 16.2.6.3. SWOT Analysis
- 16.2.6.4. Recent Developments
- 16.2.6.5. Financials (Based on Availability)
- 16.2.7 Wolters Kluwer
- 16.2.7.1. Overview
- 16.2.7.2. Products
- 16.2.7.3. SWOT Analysis
- 16.2.7.4. Recent Developments
- 16.2.7.5. Financials (Based on Availability)
- 16.2.8 Oracle Corporation
- 16.2.8.1. Overview
- 16.2.8.2. Products
- 16.2.8.3. SWOT Analysis
- 16.2.8.4. Recent Developments
- 16.2.8.5. Financials (Based on Availability)
- 16.2.9 Future Shield Inc
- 16.2.9.1. Overview
- 16.2.9.2. Products
- 16.2.9.3. SWOT Analysis
- 16.2.9.4. Recent Developments
- 16.2.9.5. Financials (Based on Availability)
- 16.2.10 SAP SE
- 16.2.10.1. Overview
- 16.2.10.2. Products
- 16.2.10.3. SWOT Analysis
- 16.2.10.4. Recent Developments
- 16.2.10.5. Financials (Based on Availability)
- 16.2.1 SAS Institute Inc
List of Figures
- Figure 1: Global eGRC Industry Revenue Breakdown (Million, %) by Region 2024 & 2032
- Figure 2: North America eGRC Industry Revenue (Million), by Country 2024 & 2032
- Figure 3: North America eGRC Industry Revenue Share (%), by Country 2024 & 2032
- Figure 4: Europe eGRC Industry Revenue (Million), by Country 2024 & 2032
- Figure 5: Europe eGRC Industry Revenue Share (%), by Country 2024 & 2032
- Figure 6: Asia Pacific eGRC Industry Revenue (Million), by Country 2024 & 2032
- Figure 7: Asia Pacific eGRC Industry Revenue Share (%), by Country 2024 & 2032
- Figure 8: Latin America eGRC Industry Revenue (Million), by Country 2024 & 2032
- Figure 9: Latin America eGRC Industry Revenue Share (%), by Country 2024 & 2032
- Figure 10: Middle East and Africa eGRC Industry Revenue (Million), by Country 2024 & 2032
- Figure 11: Middle East and Africa eGRC Industry Revenue Share (%), by Country 2024 & 2032
- Figure 12: North America eGRC Industry Revenue (Million), by Type 2024 & 2032
- Figure 13: North America eGRC Industry Revenue Share (%), by Type 2024 & 2032
- Figure 14: North America eGRC Industry Revenue (Million), by Size of the Enterprise 2024 & 2032
- Figure 15: North America eGRC Industry Revenue Share (%), by Size of the Enterprise 2024 & 2032
- Figure 16: North America eGRC Industry Revenue (Million), by End-User Industry 2024 & 2032
- Figure 17: North America eGRC Industry Revenue Share (%), by End-User Industry 2024 & 2032
- Figure 18: North America eGRC Industry Revenue (Million), by Country 2024 & 2032
- Figure 19: North America eGRC Industry Revenue Share (%), by Country 2024 & 2032
- Figure 20: Europe eGRC Industry Revenue (Million), by Type 2024 & 2032
- Figure 21: Europe eGRC Industry Revenue Share (%), by Type 2024 & 2032
- Figure 22: Europe eGRC Industry Revenue (Million), by Size of the Enterprise 2024 & 2032
- Figure 23: Europe eGRC Industry Revenue Share (%), by Size of the Enterprise 2024 & 2032
- Figure 24: Europe eGRC Industry Revenue (Million), by End-User Industry 2024 & 2032
- Figure 25: Europe eGRC Industry Revenue Share (%), by End-User Industry 2024 & 2032
- Figure 26: Europe eGRC Industry Revenue (Million), by Country 2024 & 2032
- Figure 27: Europe eGRC Industry Revenue Share (%), by Country 2024 & 2032
- Figure 28: Asia Pacific eGRC Industry Revenue (Million), by Type 2024 & 2032
- Figure 29: Asia Pacific eGRC Industry Revenue Share (%), by Type 2024 & 2032
- Figure 30: Asia Pacific eGRC Industry Revenue (Million), by Size of the Enterprise 2024 & 2032
- Figure 31: Asia Pacific eGRC Industry Revenue Share (%), by Size of the Enterprise 2024 & 2032
- Figure 32: Asia Pacific eGRC Industry Revenue (Million), by End-User Industry 2024 & 2032
- Figure 33: Asia Pacific eGRC Industry Revenue Share (%), by End-User Industry 2024 & 2032
- Figure 34: Asia Pacific eGRC Industry Revenue (Million), by Country 2024 & 2032
- Figure 35: Asia Pacific eGRC Industry Revenue Share (%), by Country 2024 & 2032
- Figure 36: Latin America eGRC Industry Revenue (Million), by Type 2024 & 2032
- Figure 37: Latin America eGRC Industry Revenue Share (%), by Type 2024 & 2032
- Figure 38: Latin America eGRC Industry Revenue (Million), by Size of the Enterprise 2024 & 2032
- Figure 39: Latin America eGRC Industry Revenue Share (%), by Size of the Enterprise 2024 & 2032
- Figure 40: Latin America eGRC Industry Revenue (Million), by End-User Industry 2024 & 2032
- Figure 41: Latin America eGRC Industry Revenue Share (%), by End-User Industry 2024 & 2032
- Figure 42: Latin America eGRC Industry Revenue (Million), by Country 2024 & 2032
- Figure 43: Latin America eGRC Industry Revenue Share (%), by Country 2024 & 2032
- Figure 44: Middle East and Africa eGRC Industry Revenue (Million), by Type 2024 & 2032
- Figure 45: Middle East and Africa eGRC Industry Revenue Share (%), by Type 2024 & 2032
- Figure 46: Middle East and Africa eGRC Industry Revenue (Million), by Size of the Enterprise 2024 & 2032
- Figure 47: Middle East and Africa eGRC Industry Revenue Share (%), by Size of the Enterprise 2024 & 2032
- Figure 48: Middle East and Africa eGRC Industry Revenue (Million), by End-User Industry 2024 & 2032
- Figure 49: Middle East and Africa eGRC Industry Revenue Share (%), by End-User Industry 2024 & 2032
- Figure 50: Middle East and Africa eGRC Industry Revenue (Million), by Country 2024 & 2032
- Figure 51: Middle East and Africa eGRC Industry Revenue Share (%), by Country 2024 & 2032
List of Tables
- Table 1: Global eGRC Industry Revenue Million Forecast, by Region 2019 & 2032
- Table 2: Global eGRC Industry Revenue Million Forecast, by Type 2019 & 2032
- Table 3: Global eGRC Industry Revenue Million Forecast, by Size of the Enterprise 2019 & 2032
- Table 4: Global eGRC Industry Revenue Million Forecast, by End-User Industry 2019 & 2032
- Table 5: Global eGRC Industry Revenue Million Forecast, by Region 2019 & 2032
- Table 6: Global eGRC Industry Revenue Million Forecast, by Country 2019 & 2032
- Table 7: eGRC Industry Revenue (Million) Forecast, by Application 2019 & 2032
- Table 8: Global eGRC Industry Revenue Million Forecast, by Country 2019 & 2032
- Table 9: eGRC Industry Revenue (Million) Forecast, by Application 2019 & 2032
- Table 10: Global eGRC Industry Revenue Million Forecast, by Country 2019 & 2032
- Table 11: eGRC Industry Revenue (Million) Forecast, by Application 2019 & 2032
- Table 12: Global eGRC Industry Revenue Million Forecast, by Country 2019 & 2032
- Table 13: eGRC Industry Revenue (Million) Forecast, by Application 2019 & 2032
- Table 14: Global eGRC Industry Revenue Million Forecast, by Country 2019 & 2032
- Table 15: eGRC Industry Revenue (Million) Forecast, by Application 2019 & 2032
- Table 16: Global eGRC Industry Revenue Million Forecast, by Type 2019 & 2032
- Table 17: Global eGRC Industry Revenue Million Forecast, by Size of the Enterprise 2019 & 2032
- Table 18: Global eGRC Industry Revenue Million Forecast, by End-User Industry 2019 & 2032
- Table 19: Global eGRC Industry Revenue Million Forecast, by Country 2019 & 2032
- Table 20: Global eGRC Industry Revenue Million Forecast, by Type 2019 & 2032
- Table 21: Global eGRC Industry Revenue Million Forecast, by Size of the Enterprise 2019 & 2032
- Table 22: Global eGRC Industry Revenue Million Forecast, by End-User Industry 2019 & 2032
- Table 23: Global eGRC Industry Revenue Million Forecast, by Country 2019 & 2032
- Table 24: Global eGRC Industry Revenue Million Forecast, by Type 2019 & 2032
- Table 25: Global eGRC Industry Revenue Million Forecast, by Size of the Enterprise 2019 & 2032
- Table 26: Global eGRC Industry Revenue Million Forecast, by End-User Industry 2019 & 2032
- Table 27: Global eGRC Industry Revenue Million Forecast, by Country 2019 & 2032
- Table 28: Global eGRC Industry Revenue Million Forecast, by Type 2019 & 2032
- Table 29: Global eGRC Industry Revenue Million Forecast, by Size of the Enterprise 2019 & 2032
- Table 30: Global eGRC Industry Revenue Million Forecast, by End-User Industry 2019 & 2032
- Table 31: Global eGRC Industry Revenue Million Forecast, by Country 2019 & 2032
- Table 32: Global eGRC Industry Revenue Million Forecast, by Type 2019 & 2032
- Table 33: Global eGRC Industry Revenue Million Forecast, by Size of the Enterprise 2019 & 2032
- Table 34: Global eGRC Industry Revenue Million Forecast, by End-User Industry 2019 & 2032
- Table 35: Global eGRC Industry Revenue Million Forecast, by Country 2019 & 2032
Frequently Asked Questions
1. What is the projected Compound Annual Growth Rate (CAGR) of the eGRC Industry?
The projected CAGR is approximately 12.38%.
2. Which companies are prominent players in the eGRC Industry?
Key companies in the market include SAS Institute Inc, Maclear LLC, Software A, IBM Corporation, Dell EMC, MetricStream Inc, Wolters Kluwer, Oracle Corporation, Future Shield Inc, SAP SE.
3. What are the main segments of the eGRC Industry?
The market segments include Type, Size of the Enterprise, End-User Industry.
4. Can you provide details about the market size?
The market size is estimated to be USD 18.72 Million as of 2022.
5. What are some drivers contributing to market growth?
Stringent Government Regulations and Mandates; Cyber Security Threat Owing to Digitalization.
6. What are the notable trends driving market growth?
Demand from BFSI segment is expected to Witness Significant Growth.
7. Are there any restraints impacting market growth?
Lack of Awareness.
8. Can you provide examples of recent developments in the market?
October 2023 - Pathlock, the provider of application governance, risk, and compliance (GRC), launched a new release of its Application Access Governance (AAG) product within the company's risk and compliance platform, Pathlock Cloud. It is mainly a risk and compliance management platform that automates the controls testing and enforcement for various business applications and enterprise resource planning (ERP). ThePathlock AAG also automates the broad majority of manual processes needed to minimize the risks associated with application access throughout critical business systems.
9. What pricing options are available for accessing the report?
Pricing options include single-user, multi-user, and enterprise licenses priced at USD 4750, USD 5250, and USD 8750 respectively.
10. Is the market size provided in terms of value or volume?
The market size is provided in terms of value, measured in Million.
11. Are there any specific market keywords associated with the report?
Yes, the market keyword associated with the report is "eGRC Industry," which aids in identifying and referencing the specific market segment covered.
12. How do I determine which pricing option suits my needs best?
The pricing options vary based on user requirements and access needs. Individual users may opt for single-user licenses, while businesses requiring broader access may choose multi-user or enterprise licenses for cost-effective access to the report.
13. Are there any additional resources or data provided in the eGRC Industry report?
While the report offers comprehensive insights, it's advisable to review the specific contents or supplementary materials provided to ascertain if additional resources or data are available.
14. How can I stay updated on further developments or reports in the eGRC Industry?
To stay informed about further developments, trends, and reports in the eGRC Industry, consider subscribing to industry newsletters, following relevant companies and organizations, or regularly checking reputable industry news sources and publications.
Methodology
Step 1 - Identification of Relevant Samples Size from Population Database


Step 2 - Approaches for Defining Global Market Size (Value, Volume* & Price*)

Note*: In applicable scenarios
Step 3 - Data Sources
Primary Research
- Web Analytics
- Survey Reports
- Research Institute
- Latest Research Reports
- Opinion Leaders
Secondary Research
- Annual Reports
- White Paper
- Latest Press Release
- Industry Association
- Paid Database
- Investor Presentations

Step 4 - Data Triangulation
Involves using different sources of information in order to increase the validity of a study
These sources are likely to be stakeholders in a program - participants, other researchers, program staff, other community members, and so on.
Then we put all data in single framework & apply various statistical tools to find out the dynamic on the market.
During the analysis stage, feedback from the stakeholder groups would be compared to determine areas of agreement as well as areas of divergence
