

Key Insights
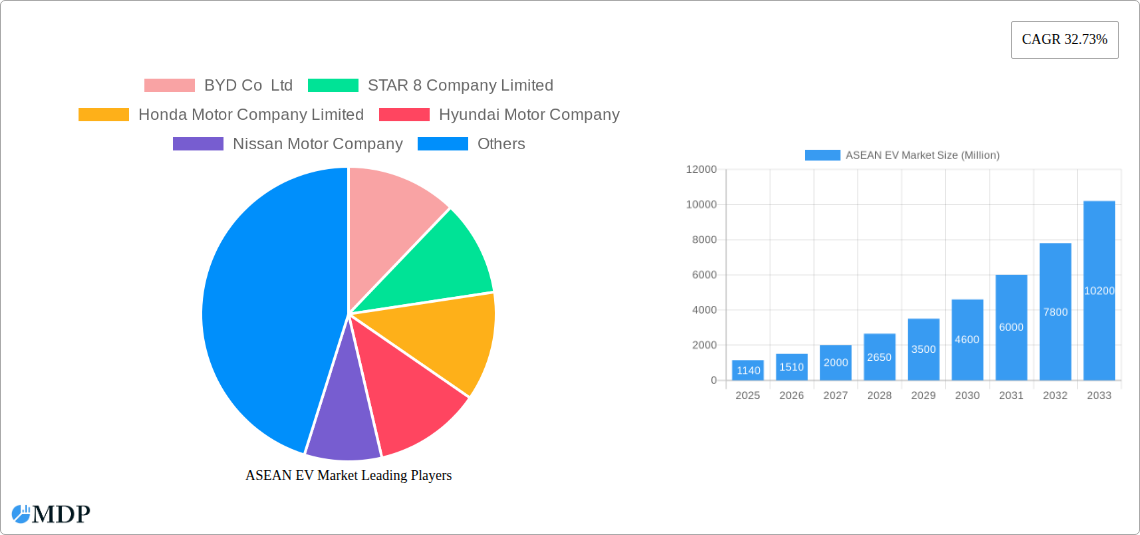
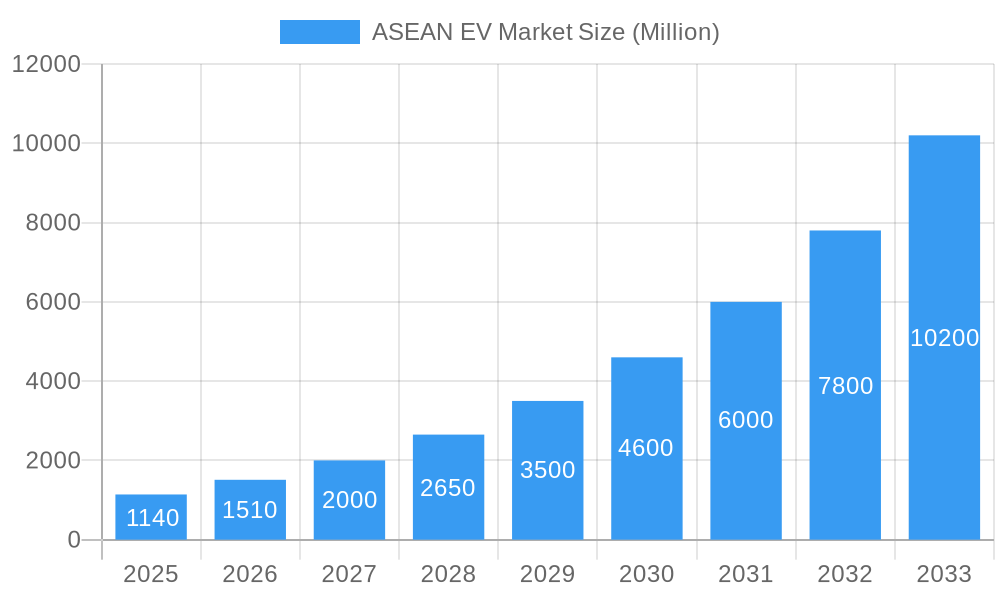
The ASEAN electric vehicle (EV) market is experiencing explosive growth, projected to reach a market size of $1.14 billion in 2025 and exhibiting a remarkable Compound Annual Growth Rate (CAGR) of 32.73% from 2025 to 2033. Several factors fuel this expansion. Government incentives promoting EV adoption across countries like Thailand, Indonesia, and Singapore are creating a favorable environment for both consumers and manufacturers. Furthermore, rising fuel prices and increasing environmental awareness are driving consumer preference towards cleaner transportation alternatives. The market is segmented by vehicle type (passenger and commercial), drive train technology (Battery Electric Vehicle (BEV), Plug-in Hybrid Electric Vehicle (PHEV), and Fuel Cell Electric Vehicle (FCEV)), and geographically across ASEAN nations. Thailand and Singapore, with their established automotive industries and supportive government policies, are expected to lead the market, followed closely by Indonesia and Malaysia, which possess significant potential for growth given their large populations and expanding middle classes. Competition is fierce, with major global players like BYD, Tesla, Honda, and Toyota alongside emerging local manufacturers vying for market share. Challenges remain, including the development of robust charging infrastructure and addressing concerns around battery technology and range anxiety. However, ongoing technological advancements and continued government support are paving the way for sustained, substantial growth in the ASEAN EV market.
ASEAN EV Market Market Size (In Billion)
The forecast period of 2025-2033 anticipates continued strong growth, driven by technological innovation in battery technology leading to increased vehicle range and affordability. Increased investment in charging infrastructure will address range anxiety and improve consumer confidence. The commercial vehicle segment is also poised for significant expansion, particularly in logistics and last-mile delivery sectors. As ASEAN nations continue to integrate economically and environmentally conscious policies are implemented, the market is expected to see a diversification in vehicle types and technologies, with BEVs likely maintaining a dominant position due to their cost-effectiveness and environmental benefits compared to PHEVs and FCEVs. Therefore, the ASEAN EV market represents a lucrative opportunity for both established and emerging players, promising substantial returns in the coming decade.
ASEAN EV Market Company Market Share
ASEAN EV Market: 2019-2033 Comprehensive Report
Dive deep into the burgeoning ASEAN Electric Vehicle (EV) market with this comprehensive report, providing in-depth analysis and future forecasts for 2019-2033. This crucial resource examines market dynamics, key players, technological advancements, and emerging opportunities, equipping stakeholders with actionable insights for strategic decision-making. The report covers a comprehensive landscape, including detailed analysis of various segments, such as passenger and commercial vehicles, Battery Electric Vehicles (BEVs), Plug-in Hybrid Electric Vehicles (PHEVs), and Fuel Cell Electric Vehicles (FCEVs) across key ASEAN nations: Thailand, Malaysia, Indonesia, Singapore, and the Rest of ASEAN.
ASEAN EV Market Market Dynamics & Concentration
The ASEAN EV market, while nascent, is experiencing rapid growth fueled by supportive government policies, rising environmental concerns, and technological advancements. Market concentration is currently moderate, with established automotive giants like Toyota and Honda competing alongside new entrants such as BYD. Innovation is driven by improvements in battery technology, charging infrastructure development, and the emergence of new business models. Regulatory frameworks, while still evolving across the region, are increasingly focused on emission reduction targets and incentives for EV adoption. Product substitutes remain limited, with internal combustion engine (ICE) vehicles being the primary alternative. End-user trends show a growing preference for EVs among environmentally conscious consumers, particularly in urban areas. M&A activities are on the rise, with strategic partnerships and acquisitions expected to reshape the competitive landscape. The estimated market share for BEVs in 2025 is xx%, with PHEVs holding xx%. The number of M&A deals in the sector from 2019-2024 totalled approximately xx.
ASEAN EV Market Industry Trends & Analysis
The ASEAN EV market is projected to experience significant growth, with a Compound Annual Growth Rate (CAGR) of xx% from 2025 to 2033. This robust growth is primarily driven by government initiatives promoting EV adoption, including tax incentives, subsidies, and infrastructure development. Technological disruptions, such as advancements in battery technology leading to increased range and reduced charging times, are accelerating market penetration. Consumer preferences are shifting towards EVs due to factors such as lower running costs, environmental benefits, and technological sophistication. However, competitive dynamics remain intense, with both established and new players vying for market share. Market penetration in 2025 is estimated at xx%, indicating significant growth potential in the coming years. Challenges remain, particularly in terms of affordability and charging infrastructure availability, but the overall outlook for the ASEAN EV market remains exceptionally positive.
Leading Markets & Segments in ASEAN EV Market
Thailand and Singapore currently lead the ASEAN EV market, driven by favorable government policies and relatively advanced charging infrastructure.
- Key Drivers in Thailand: Government subsidies, tax incentives, and a focus on developing domestic EV manufacturing capabilities.
- Key Drivers in Singapore: Strong government commitment to sustainability, well-developed charging infrastructure, and high consumer adoption of new technologies.
Dominant Segments:
- By Vehicle Type: Passenger vehicles currently dominate the market, but the commercial vehicle segment is expected to witness significant growth, particularly in logistics and last-mile delivery.
- By Drive Train Technology Type: BEVs are projected to become the dominant drive train technology in the long term, surpassing PHEVs and FCEVs due to cost advantages and technological advancements.
Indonesia and Malaysia are poised for significant growth, driven by increasing government support and growing consumer demand. The Rest of ASEAN region presents substantial untapped potential for future expansion.
ASEAN EV Market Product Developments
Recent product innovations highlight a strong focus on enhancing battery technology, improving range, and incorporating advanced safety features. Competition is driving the development of more affordable EVs while maintaining competitive performance characteristics. The market is witnessing a shift towards SUVs and crossover vehicles, reflecting consumer preference for versatile and stylish EVs. Several manufacturers are integrating smart technologies, connected car features, and autonomous driving capabilities to enhance the overall user experience.
Key Drivers of ASEAN EV Market Growth
Several factors are propelling the growth of the ASEAN EV market. Government policies providing incentives, such as tax breaks and subsidies, are crucial. Falling battery prices make EVs increasingly affordable. Improved charging infrastructure addresses range anxiety, a major barrier to adoption. The growing environmental awareness among consumers also boosts demand.
Challenges in the ASEAN EV Market Market
The ASEAN EV market faces challenges, including the relatively high initial cost of EVs compared to ICE vehicles. Limited charging infrastructure in certain regions remains a barrier, while supply chain disruptions, particularly concerning battery materials, can impact production and availability. Competition from established automakers with a large ICE vehicle presence also presents significant hurdles.
Emerging Opportunities in ASEAN EV Market
Significant opportunities lie ahead. Advancements in battery technology will lead to improved range and reduced charging times, increasing consumer appeal. Strategic partnerships between automotive manufacturers and energy companies will enhance the EV ecosystem. Expansion into underserved markets within ASEAN holds immense potential for growth.
Leading Players in the ASEAN EV Market Sector
- BYD Co Ltd
- STAR 8 Company Limited
- Honda Motor Company Limited
- Hyundai Motor Company
- Nissan Motor Company
- Tesla Inc
- BMW Group
- MG Motor
- Audi AG
- Toyota Motor Corporation
- BYD Company Limite
- Mitsubishi Motors Corporation
- AB Volvo
Key Milestones in ASEAN EV Market Industry
- December 2021: BMW Group Asia launched the first-ever BMW iX and new BMW iX3 electric cars in Singapore, signaling a push by premium brands into the ASEAN EV market.
- January 2022: Toyota planned to introduce the BZX4 electric SUV in Thailand and Singapore by the end of 2022, indicating a major commitment from a leading global automaker.
- March 2022: Volvo launched its electric car C40 in Thailand, highlighting the growing interest in importing EVs into the region.
- July 2022: BYD launched the ATTO 3 SUV in Singapore. Its performance specifications (0-100 km/h in 7.3 seconds, 480 km range) demonstrate the technological advancements in the EV sector.
Strategic Outlook for ASEAN EV Market Market
The ASEAN EV market is poised for exponential growth, driven by technological advancements, supportive government policies, and growing consumer demand. Strategic partnerships between automotive manufacturers, energy providers, and technology companies will be crucial in accelerating market development. The focus will shift towards enhancing charging infrastructure, developing robust supply chains, and addressing affordability concerns to maximize market penetration and unlock the region's immense EV potential.
ASEAN EV Market Segmentation
-
1. Vehicle Type
- 1.1. Passenger Vehicle
- 1.2. Commercial Vehicle
-
2. Drive Train Technology Type
- 2.1. Battery Electric Vehicle
- 2.2. Plug-in Hybrid Electric Vehicle
- 2.3. Fuel Cell Electric Vehicle
ASEAN EV Market Segmentation By Geography
-
1. North America
- 1.1. United States
- 1.2. Canada
- 1.3. Mexico
-
2. South America
- 2.1. Brazil
- 2.2. Argentina
- 2.3. Rest of South America
-
3. Europe
- 3.1. United Kingdom
- 3.2. Germany
- 3.3. France
- 3.4. Italy
- 3.5. Spain
- 3.6. Russia
- 3.7. Benelux
- 3.8. Nordics
- 3.9. Rest of Europe
-
4. Middle East & Africa
- 4.1. Turkey
- 4.2. Israel
- 4.3. GCC
- 4.4. North Africa
- 4.5. South Africa
- 4.6. Rest of Middle East & Africa
-
5. Asia Pacific
- 5.1. China
- 5.2. India
- 5.3. Japan
- 5.4. South Korea
- 5.5. ASEAN
- 5.6. Oceania
- 5.7. Rest of Asia Pacific
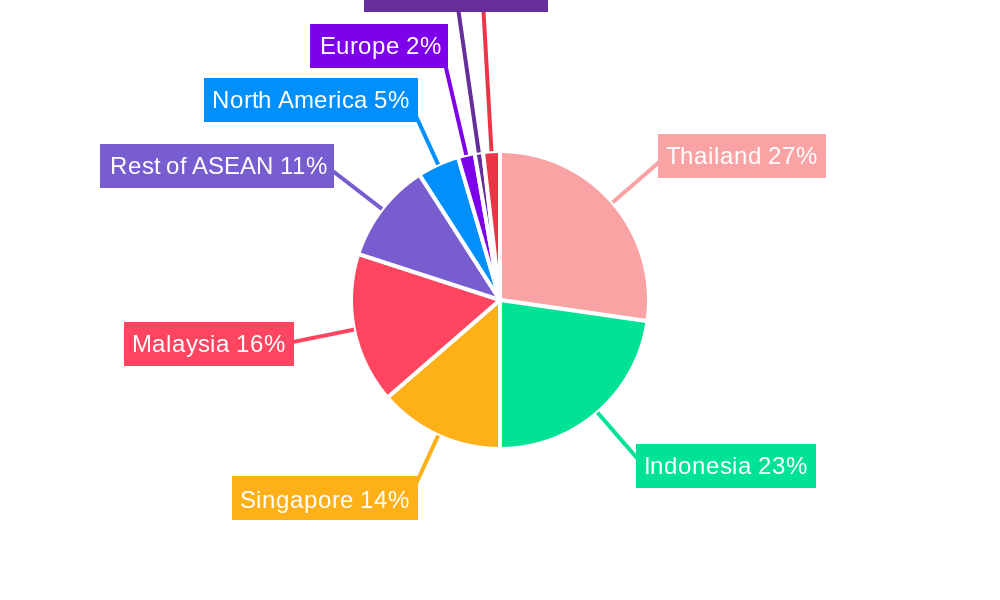
ASEAN EV Market Regional Market Share
Geographic Coverage of ASEAN EV Market
ASEAN EV Market REPORT HIGHLIGHTS
| Aspects | Details |
|---|---|
| Study Period | 2020-2034 |
| Base Year | 2025 |
| Estimated Year | 2026 |
| Forecast Period | 2026-2034 |
| Historical Period | 2020-2025 |
| Growth Rate | CAGR of 32.73% from 2020-2034 |
| Segmentation |
|
Table of Contents
- 1. Introduction
- 1.1. Research Scope
- 1.2. Market Segmentation
- 1.3. Research Methodology
- 1.4. Definitions and Assumptions
- 2. Executive Summary
- 2.1. Introduction
- 3. Market Dynamics
- 3.1. Introduction
- 3.2. Market Drivers
- 3.2.1. Integration With Telematics And Fleet Management Systems; Others
- 3.3. Market Restrains
- 3.3.1. The Initial Costs Associated With Purchasing And Installing ELD Systems is High; Others
- 3.4. Market Trends
- 3.4.1. Battery Electric Vehicle is Dominating the Market
- 4. Market Factor Analysis
- 4.1. Porters Five Forces
- 4.2. Supply/Value Chain
- 4.3. PESTEL analysis
- 4.4. Market Entropy
- 4.5. Patent/Trademark Analysis
- 5. Global ASEAN EV Market Analysis, Insights and Forecast, 2020-2032
- 5.1. Market Analysis, Insights and Forecast - by Vehicle Type
- 5.1.1. Passenger Vehicle
- 5.1.2. Commercial Vehicle
- 5.2. Market Analysis, Insights and Forecast - by Drive Train Technology Type
- 5.2.1. Battery Electric Vehicle
- 5.2.2. Plug-in Hybrid Electric Vehicle
- 5.2.3. Fuel Cell Electric Vehicle
- 5.3. Market Analysis, Insights and Forecast - by Region
- 5.3.1. North America
- 5.3.2. South America
- 5.3.3. Europe
- 5.3.4. Middle East & Africa
- 5.3.5. Asia Pacific
- 5.1. Market Analysis, Insights and Forecast - by Vehicle Type
- 6. North America ASEAN EV Market Analysis, Insights and Forecast, 2020-2032
- 6.1. Market Analysis, Insights and Forecast - by Vehicle Type
- 6.1.1. Passenger Vehicle
- 6.1.2. Commercial Vehicle
- 6.2. Market Analysis, Insights and Forecast - by Drive Train Technology Type
- 6.2.1. Battery Electric Vehicle
- 6.2.2. Plug-in Hybrid Electric Vehicle
- 6.2.3. Fuel Cell Electric Vehicle
- 6.1. Market Analysis, Insights and Forecast - by Vehicle Type
- 7. South America ASEAN EV Market Analysis, Insights and Forecast, 2020-2032
- 7.1. Market Analysis, Insights and Forecast - by Vehicle Type
- 7.1.1. Passenger Vehicle
- 7.1.2. Commercial Vehicle
- 7.2. Market Analysis, Insights and Forecast - by Drive Train Technology Type
- 7.2.1. Battery Electric Vehicle
- 7.2.2. Plug-in Hybrid Electric Vehicle
- 7.2.3. Fuel Cell Electric Vehicle
- 7.1. Market Analysis, Insights and Forecast - by Vehicle Type
- 8. Europe ASEAN EV Market Analysis, Insights and Forecast, 2020-2032
- 8.1. Market Analysis, Insights and Forecast - by Vehicle Type
- 8.1.1. Passenger Vehicle
- 8.1.2. Commercial Vehicle
- 8.2. Market Analysis, Insights and Forecast - by Drive Train Technology Type
- 8.2.1. Battery Electric Vehicle
- 8.2.2. Plug-in Hybrid Electric Vehicle
- 8.2.3. Fuel Cell Electric Vehicle
- 8.1. Market Analysis, Insights and Forecast - by Vehicle Type
- 9. Middle East & Africa ASEAN EV Market Analysis, Insights and Forecast, 2020-2032
- 9.1. Market Analysis, Insights and Forecast - by Vehicle Type
- 9.1.1. Passenger Vehicle
- 9.1.2. Commercial Vehicle
- 9.2. Market Analysis, Insights and Forecast - by Drive Train Technology Type
- 9.2.1. Battery Electric Vehicle
- 9.2.2. Plug-in Hybrid Electric Vehicle
- 9.2.3. Fuel Cell Electric Vehicle
- 9.1. Market Analysis, Insights and Forecast - by Vehicle Type
- 10. Asia Pacific ASEAN EV Market Analysis, Insights and Forecast, 2020-2032
- 10.1. Market Analysis, Insights and Forecast - by Vehicle Type
- 10.1.1. Passenger Vehicle
- 10.1.2. Commercial Vehicle
- 10.2. Market Analysis, Insights and Forecast - by Drive Train Technology Type
- 10.2.1. Battery Electric Vehicle
- 10.2.2. Plug-in Hybrid Electric Vehicle
- 10.2.3. Fuel Cell Electric Vehicle
- 10.1. Market Analysis, Insights and Forecast - by Vehicle Type
- 11. Competitive Analysis
- 11.1. Global Market Share Analysis 2025
- 11.2. Company Profiles
- 11.2.1 BYD Co Ltd
- 11.2.1.1. Overview
- 11.2.1.2. Products
- 11.2.1.3. SWOT Analysis
- 11.2.1.4. Recent Developments
- 11.2.1.5. Financials (Based on Availability)
- 11.2.2 STAR 8 Company Limited
- 11.2.2.1. Overview
- 11.2.2.2. Products
- 11.2.2.3. SWOT Analysis
- 11.2.2.4. Recent Developments
- 11.2.2.5. Financials (Based on Availability)
- 11.2.3 Honda Motor Company Limited
- 11.2.3.1. Overview
- 11.2.3.2. Products
- 11.2.3.3. SWOT Analysis
- 11.2.3.4. Recent Developments
- 11.2.3.5. Financials (Based on Availability)
- 11.2.4 Hyundai Motor Company
- 11.2.4.1. Overview
- 11.2.4.2. Products
- 11.2.4.3. SWOT Analysis
- 11.2.4.4. Recent Developments
- 11.2.4.5. Financials (Based on Availability)
- 11.2.5 Nissan Motor Company
- 11.2.5.1. Overview
- 11.2.5.2. Products
- 11.2.5.3. SWOT Analysis
- 11.2.5.4. Recent Developments
- 11.2.5.5. Financials (Based on Availability)
- 11.2.6 Tesla Inc
- 11.2.6.1. Overview
- 11.2.6.2. Products
- 11.2.6.3. SWOT Analysis
- 11.2.6.4. Recent Developments
- 11.2.6.5. Financials (Based on Availability)
- 11.2.7 BMW Group
- 11.2.7.1. Overview
- 11.2.7.2. Products
- 11.2.7.3. SWOT Analysis
- 11.2.7.4. Recent Developments
- 11.2.7.5. Financials (Based on Availability)
- 11.2.8 MG Motor
- 11.2.8.1. Overview
- 11.2.8.2. Products
- 11.2.8.3. SWOT Analysis
- 11.2.8.4. Recent Developments
- 11.2.8.5. Financials (Based on Availability)
- 11.2.9 Audi AG
- 11.2.9.1. Overview
- 11.2.9.2. Products
- 11.2.9.3. SWOT Analysis
- 11.2.9.4. Recent Developments
- 11.2.9.5. Financials (Based on Availability)
- 11.2.10 Toyota Motor Corporation
- 11.2.10.1. Overview
- 11.2.10.2. Products
- 11.2.10.3. SWOT Analysis
- 11.2.10.4. Recent Developments
- 11.2.10.5. Financials (Based on Availability)
- 11.2.11 BYD Company Limite
- 11.2.11.1. Overview
- 11.2.11.2. Products
- 11.2.11.3. SWOT Analysis
- 11.2.11.4. Recent Developments
- 11.2.11.5. Financials (Based on Availability)
- 11.2.12 Mitsubishi Motors Corporation
- 11.2.12.1. Overview
- 11.2.12.2. Products
- 11.2.12.3. SWOT Analysis
- 11.2.12.4. Recent Developments
- 11.2.12.5. Financials (Based on Availability)
- 11.2.13 AB Volvo
- 11.2.13.1. Overview
- 11.2.13.2. Products
- 11.2.13.3. SWOT Analysis
- 11.2.13.4. Recent Developments
- 11.2.13.5. Financials (Based on Availability)
- 11.2.1 BYD Co Ltd
List of Figures
- Figure 1: Global ASEAN EV Market Revenue Breakdown (Million, %) by Region 2025 & 2033
- Figure 2: North America ASEAN EV Market Revenue (Million), by Vehicle Type 2025 & 2033
- Figure 3: North America ASEAN EV Market Revenue Share (%), by Vehicle Type 2025 & 2033
- Figure 4: North America ASEAN EV Market Revenue (Million), by Drive Train Technology Type 2025 & 2033
- Figure 5: North America ASEAN EV Market Revenue Share (%), by Drive Train Technology Type 2025 & 2033
- Figure 6: North America ASEAN EV Market Revenue (Million), by Country 2025 & 2033
- Figure 7: North America ASEAN EV Market Revenue Share (%), by Country 2025 & 2033
- Figure 8: South America ASEAN EV Market Revenue (Million), by Vehicle Type 2025 & 2033
- Figure 9: South America ASEAN EV Market Revenue Share (%), by Vehicle Type 2025 & 2033
- Figure 10: South America ASEAN EV Market Revenue (Million), by Drive Train Technology Type 2025 & 2033
- Figure 11: South America ASEAN EV Market Revenue Share (%), by Drive Train Technology Type 2025 & 2033
- Figure 12: South America ASEAN EV Market Revenue (Million), by Country 2025 & 2033
- Figure 13: South America ASEAN EV Market Revenue Share (%), by Country 2025 & 2033
- Figure 14: Europe ASEAN EV Market Revenue (Million), by Vehicle Type 2025 & 2033
- Figure 15: Europe ASEAN EV Market Revenue Share (%), by Vehicle Type 2025 & 2033
- Figure 16: Europe ASEAN EV Market Revenue (Million), by Drive Train Technology Type 2025 & 2033
- Figure 17: Europe ASEAN EV Market Revenue Share (%), by Drive Train Technology Type 2025 & 2033
- Figure 18: Europe ASEAN EV Market Revenue (Million), by Country 2025 & 2033
- Figure 19: Europe ASEAN EV Market Revenue Share (%), by Country 2025 & 2033
- Figure 20: Middle East & Africa ASEAN EV Market Revenue (Million), by Vehicle Type 2025 & 2033
- Figure 21: Middle East & Africa ASEAN EV Market Revenue Share (%), by Vehicle Type 2025 & 2033
- Figure 22: Middle East & Africa ASEAN EV Market Revenue (Million), by Drive Train Technology Type 2025 & 2033
- Figure 23: Middle East & Africa ASEAN EV Market Revenue Share (%), by Drive Train Technology Type 2025 & 2033
- Figure 24: Middle East & Africa ASEAN EV Market Revenue (Million), by Country 2025 & 2033
- Figure 25: Middle East & Africa ASEAN EV Market Revenue Share (%), by Country 2025 & 2033
- Figure 26: Asia Pacific ASEAN EV Market Revenue (Million), by Vehicle Type 2025 & 2033
- Figure 27: Asia Pacific ASEAN EV Market Revenue Share (%), by Vehicle Type 2025 & 2033
- Figure 28: Asia Pacific ASEAN EV Market Revenue (Million), by Drive Train Technology Type 2025 & 2033
- Figure 29: Asia Pacific ASEAN EV Market Revenue Share (%), by Drive Train Technology Type 2025 & 2033
- Figure 30: Asia Pacific ASEAN EV Market Revenue (Million), by Country 2025 & 2033
- Figure 31: Asia Pacific ASEAN EV Market Revenue Share (%), by Country 2025 & 2033
List of Tables
- Table 1: Global ASEAN EV Market Revenue Million Forecast, by Vehicle Type 2020 & 2033
- Table 2: Global ASEAN EV Market Revenue Million Forecast, by Drive Train Technology Type 2020 & 2033
- Table 3: Global ASEAN EV Market Revenue Million Forecast, by Region 2020 & 2033
- Table 4: Global ASEAN EV Market Revenue Million Forecast, by Vehicle Type 2020 & 2033
- Table 5: Global ASEAN EV Market Revenue Million Forecast, by Drive Train Technology Type 2020 & 2033
- Table 6: Global ASEAN EV Market Revenue Million Forecast, by Country 2020 & 2033
- Table 7: United States ASEAN EV Market Revenue (Million) Forecast, by Application 2020 & 2033
- Table 8: Canada ASEAN EV Market Revenue (Million) Forecast, by Application 2020 & 2033
- Table 9: Mexico ASEAN EV Market Revenue (Million) Forecast, by Application 2020 & 2033
- Table 10: Global ASEAN EV Market Revenue Million Forecast, by Vehicle Type 2020 & 2033
- Table 11: Global ASEAN EV Market Revenue Million Forecast, by Drive Train Technology Type 2020 & 2033
- Table 12: Global ASEAN EV Market Revenue Million Forecast, by Country 2020 & 2033
- Table 13: Brazil ASEAN EV Market Revenue (Million) Forecast, by Application 2020 & 2033
- Table 14: Argentina ASEAN EV Market Revenue (Million) Forecast, by Application 2020 & 2033
- Table 15: Rest of South America ASEAN EV Market Revenue (Million) Forecast, by Application 2020 & 2033
- Table 16: Global ASEAN EV Market Revenue Million Forecast, by Vehicle Type 2020 & 2033
- Table 17: Global ASEAN EV Market Revenue Million Forecast, by Drive Train Technology Type 2020 & 2033
- Table 18: Global ASEAN EV Market Revenue Million Forecast, by Country 2020 & 2033
- Table 19: United Kingdom ASEAN EV Market Revenue (Million) Forecast, by Application 2020 & 2033
- Table 20: Germany ASEAN EV Market Revenue (Million) Forecast, by Application 2020 & 2033
- Table 21: France ASEAN EV Market Revenue (Million) Forecast, by Application 2020 & 2033
- Table 22: Italy ASEAN EV Market Revenue (Million) Forecast, by Application 2020 & 2033
- Table 23: Spain ASEAN EV Market Revenue (Million) Forecast, by Application 2020 & 2033
- Table 24: Russia ASEAN EV Market Revenue (Million) Forecast, by Application 2020 & 2033
- Table 25: Benelux ASEAN EV Market Revenue (Million) Forecast, by Application 2020 & 2033
- Table 26: Nordics ASEAN EV Market Revenue (Million) Forecast, by Application 2020 & 2033
- Table 27: Rest of Europe ASEAN EV Market Revenue (Million) Forecast, by Application 2020 & 2033
- Table 28: Global ASEAN EV Market Revenue Million Forecast, by Vehicle Type 2020 & 2033
- Table 29: Global ASEAN EV Market Revenue Million Forecast, by Drive Train Technology Type 2020 & 2033
- Table 30: Global ASEAN EV Market Revenue Million Forecast, by Country 2020 & 2033
- Table 31: Turkey ASEAN EV Market Revenue (Million) Forecast, by Application 2020 & 2033
- Table 32: Israel ASEAN EV Market Revenue (Million) Forecast, by Application 2020 & 2033
- Table 33: GCC ASEAN EV Market Revenue (Million) Forecast, by Application 2020 & 2033
- Table 34: North Africa ASEAN EV Market Revenue (Million) Forecast, by Application 2020 & 2033
- Table 35: South Africa ASEAN EV Market Revenue (Million) Forecast, by Application 2020 & 2033
- Table 36: Rest of Middle East & Africa ASEAN EV Market Revenue (Million) Forecast, by Application 2020 & 2033
- Table 37: Global ASEAN EV Market Revenue Million Forecast, by Vehicle Type 2020 & 2033
- Table 38: Global ASEAN EV Market Revenue Million Forecast, by Drive Train Technology Type 2020 & 2033
- Table 39: Global ASEAN EV Market Revenue Million Forecast, by Country 2020 & 2033
- Table 40: China ASEAN EV Market Revenue (Million) Forecast, by Application 2020 & 2033
- Table 41: India ASEAN EV Market Revenue (Million) Forecast, by Application 2020 & 2033
- Table 42: Japan ASEAN EV Market Revenue (Million) Forecast, by Application 2020 & 2033
- Table 43: South Korea ASEAN EV Market Revenue (Million) Forecast, by Application 2020 & 2033
- Table 44: ASEAN ASEAN EV Market Revenue (Million) Forecast, by Application 2020 & 2033
- Table 45: Oceania ASEAN EV Market Revenue (Million) Forecast, by Application 2020 & 2033
- Table 46: Rest of Asia Pacific ASEAN EV Market Revenue (Million) Forecast, by Application 2020 & 2033
Frequently Asked Questions
1. What is the projected Compound Annual Growth Rate (CAGR) of the ASEAN EV Market?
The projected CAGR is approximately 32.73%.
2. Which companies are prominent players in the ASEAN EV Market?
Key companies in the market include BYD Co Ltd, STAR 8 Company Limited, Honda Motor Company Limited, Hyundai Motor Company, Nissan Motor Company, Tesla Inc, BMW Group, MG Motor, Audi AG, Toyota Motor Corporation, BYD Company Limite, Mitsubishi Motors Corporation, AB Volvo.
3. What are the main segments of the ASEAN EV Market?
The market segments include Vehicle Type, Drive Train Technology Type.
4. Can you provide details about the market size?
The market size is estimated to be USD 1.14 Million as of 2022.
5. What are some drivers contributing to market growth?
Integration With Telematics And Fleet Management Systems; Others.
6. What are the notable trends driving market growth?
Battery Electric Vehicle is Dominating the Market.
7. Are there any restraints impacting market growth?
The Initial Costs Associated With Purchasing And Installing ELD Systems is High; Others.
8. Can you provide examples of recent developments in the market?
July 2022: BYD launched the ATTO 3 SUV in Singapore. The ATTO 3 has a basic 150kW motor that allows it to sprint from 0 to 100 km/h in 7.3 seconds. The EV has a range of 480 km on a single charge.
9. What pricing options are available for accessing the report?
Pricing options include single-user, multi-user, and enterprise licenses priced at USD 3800, USD 4500, and USD 5800 respectively.
10. Is the market size provided in terms of value or volume?
The market size is provided in terms of value, measured in Million.
11. Are there any specific market keywords associated with the report?
Yes, the market keyword associated with the report is "ASEAN EV Market," which aids in identifying and referencing the specific market segment covered.
12. How do I determine which pricing option suits my needs best?
The pricing options vary based on user requirements and access needs. Individual users may opt for single-user licenses, while businesses requiring broader access may choose multi-user or enterprise licenses for cost-effective access to the report.
13. Are there any additional resources or data provided in the ASEAN EV Market report?
While the report offers comprehensive insights, it's advisable to review the specific contents or supplementary materials provided to ascertain if additional resources or data are available.
14. How can I stay updated on further developments or reports in the ASEAN EV Market?
To stay informed about further developments, trends, and reports in the ASEAN EV Market, consider subscribing to industry newsletters, following relevant companies and organizations, or regularly checking reputable industry news sources and publications.
Methodology
Step 1 - Identification of Relevant Samples Size from Population Database


Step 2 - Approaches for Defining Global Market Size (Value, Volume* & Price*)

Note*: In applicable scenarios
Step 3 - Data Sources
Primary Research
- Web Analytics
- Survey Reports
- Research Institute
- Latest Research Reports
- Opinion Leaders
Secondary Research
- Annual Reports
- White Paper
- Latest Press Release
- Industry Association
- Paid Database
- Investor Presentations

Step 4 - Data Triangulation
Involves using different sources of information in order to increase the validity of a study
These sources are likely to be stakeholders in a program - participants, other researchers, program staff, other community members, and so on.
Then we put all data in single framework & apply various statistical tools to find out the dynamic on the market.
During the analysis stage, feedback from the stakeholder groups would be compared to determine areas of agreement as well as areas of divergence