

Key Insights
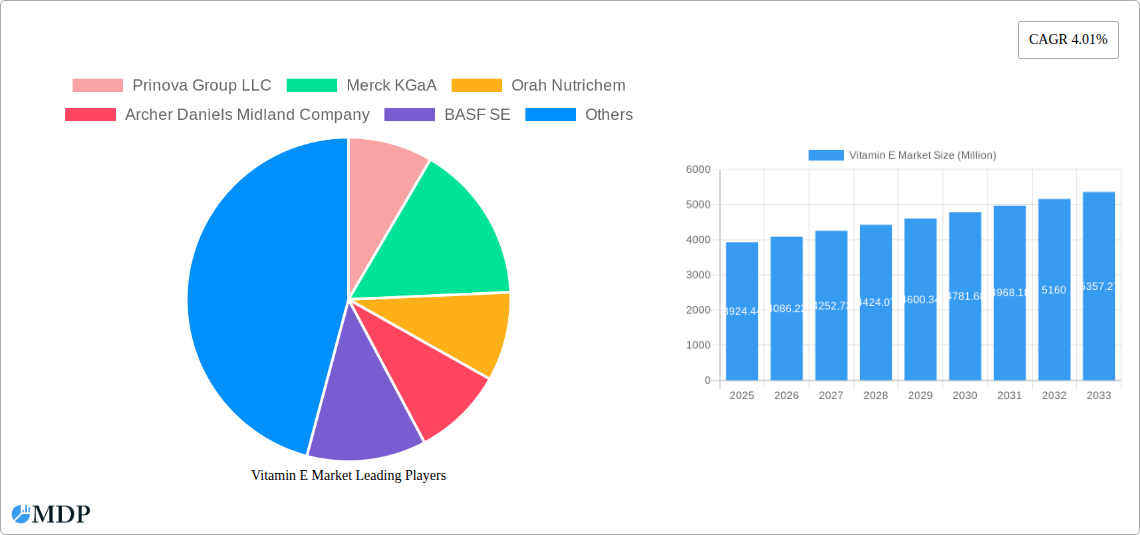
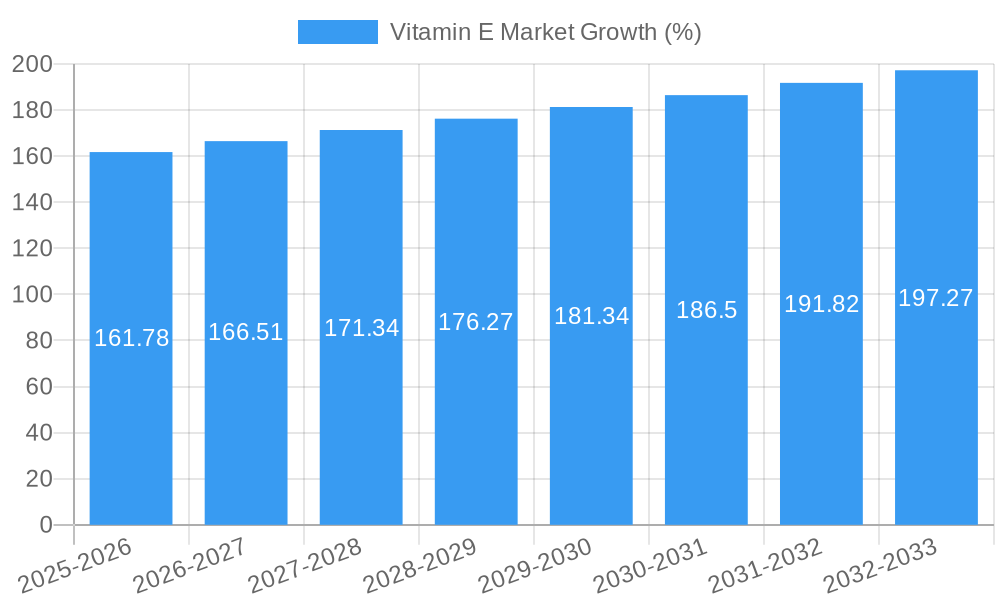
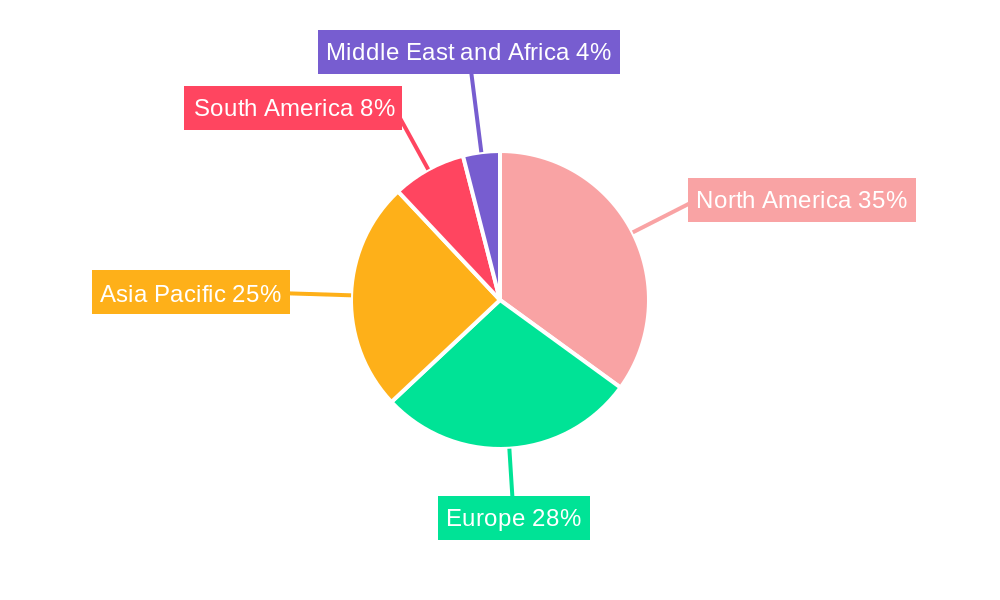
The global Vitamin E market, valued at $3,924.44 million in 2025, is projected to experience steady growth, driven by increasing health consciousness and the rising demand for nutritional supplements across various applications. The market's Compound Annual Growth Rate (CAGR) of 4.01% from 2025 to 2033 indicates a robust expansion, fueled by several key factors. The burgeoning functional food and beverage sector, coupled with the growing popularity of dietary supplements and fortified foods, significantly contributes to market growth. Furthermore, the increasing awareness of Vitamin E's role in preventing chronic diseases like cardiovascular diseases and cancer, coupled with its use in skincare and pet food, further propels market expansion. The market segmentation reveals a significant contribution from both natural and synthetic Vitamin E sources, catering to diverse consumer preferences and manufacturing requirements. Geographic segmentation highlights strong growth in North America and Asia Pacific regions, driven by increasing disposable incomes, health-conscious populations, and expanding healthcare infrastructure. However, price fluctuations in raw materials and potential regulatory hurdles could pose challenges to market growth. Competitive dynamics involve established players like Prinova Group LLC, Merck KGaA, and BASF SE, alongside regional players, leading to innovations and varied product offerings.
The forecast period (2025-2033) anticipates continued market expansion, with natural Vitamin E potentially witnessing faster growth due to the rising preference for natural ingredients in various applications. Pharmaceuticals and dietary supplements are projected to maintain their dominance as key application segments, driven by the therapeutic benefits of Vitamin E. Growth will likely be influenced by factors such as technological advancements in Vitamin E production, new product developments, and strategic collaborations between manufacturers and ingredient suppliers. While the market faces challenges such as stringent regulations and fluctuating raw material prices, its inherent growth drivers should ensure sustained expansion throughout the forecast period. Regional variations in growth rates are anticipated, with developing economies potentially showing faster expansion compared to developed markets.
Vitamin E Market: A Comprehensive Report (2019-2033)
This comprehensive report provides an in-depth analysis of the global Vitamin E market, offering invaluable insights for stakeholders across the value chain. From market dynamics and concentration to leading players and future opportunities, this report covers all key aspects, using data from the historical period (2019-2024), base year (2025), and forecast period (2025-2033). The market size is projected to reach xx Million by 2033, presenting significant growth opportunities.
Vitamin E Market Market Dynamics & Concentration
The global Vitamin E market exhibits a moderately concentrated landscape, with key players such as Prinova Group LLC, Merck KGaA, and BASF SE holding significant market share. Market concentration is influenced by factors like economies of scale in production, strong distribution networks, and the development of innovative product formulations. The market is driven by increasing consumer awareness of health and wellness, growing demand for dietary supplements, and the expanding use of Vitamin E in functional foods and cosmetics.
Innovation Drivers: Significant investments in R&D are leading to the development of novel Vitamin E delivery systems (e.g., liposomal Vitamin E) and enhanced product formulations. Regulatory frameworks, particularly concerning food safety and labeling, play a crucial role in shaping market dynamics. Substitutes such as other antioxidants may pose competitive pressures, although Vitamin E's unique properties and efficacy maintain its dominant position.
- Market Share: Prinova Group LLC holds an estimated xx% market share in 2025, followed by Merck KGaA with xx% and BASF SE with xx%.
- M&A Activity: The market has witnessed xx M&A deals between 2019 and 2024, primarily focused on consolidating production capabilities and expanding distribution channels.
Vitamin E Market Industry Trends & Analysis
The Vitamin E market is experiencing robust growth, with a projected CAGR of xx% during the forecast period (2025-2033). This growth is primarily fueled by several factors. The increasing prevalence of chronic diseases and growing consumer awareness of the health benefits of Vitamin E are driving demand for dietary supplements and fortified foods. Technological advancements have led to improved extraction and purification methods for natural Vitamin E, making it more cost-effective and widely accessible. Moreover, shifting consumer preferences toward natural and organic ingredients are further bolstering demand for natural Vitamin E.
The competitive landscape is dynamic, with existing players focused on product innovation and strategic partnerships to maintain market share. Market penetration of Vitamin E in various applications continues to increase, particularly in functional food & beverages and personal care.
Leading Markets & Segments in Vitamin E Market
The North American market currently dominates the Vitamin E market, driven by high consumer awareness of health and wellness, strong regulatory support for dietary supplements, and the presence of major industry players.
By Product Type:
- Natural Vitamin E: This segment is experiencing the highest growth rate driven by increasing consumer preference for natural ingredients.
- Synthetic Vitamin E: This segment maintains a significant market share due to its cost-effectiveness.
By Application:
Pharmaceuticals and Dietary Supplements: This segment holds the largest market share due to the established use of Vitamin E in various health supplements.
Functional Food and Beverages: Growing demand for fortified foods and beverages is driving the growth of this segment.
Cosmetics: The use of Vitamin E as an antioxidant and skin-conditioning agent is fueling growth in this application.
Key Drivers: High disposable incomes, strong regulatory frameworks, and advanced healthcare infrastructure contribute to the dominance of North America. Europe follows with significant growth potential due to increased health consciousness. Asia-Pacific shows promising growth, particularly in emerging economies like India and China due to rising middle class and increasing consumer spending on health products.
Vitamin E Market Product Developments
Recent product innovations include the development of liposomal Vitamin E formulations, which enhance bioavailability and improve efficacy. This reflects a broader trend toward improved delivery systems and higher-potency products. Companies are also focusing on developing sustainable and eco-friendly Vitamin E production methods, aligning with increasing consumer demand for environmentally responsible products. New applications are constantly emerging, expanding beyond traditional sectors into areas such as pet food and animal feed due to Vitamin E’s recognized benefits for animal health.
Key Drivers of Vitamin E Market Growth
The Vitamin E market is propelled by several key factors. Growing consumer awareness of the benefits of antioxidants for overall health and preventing chronic diseases is a primary driver. The increasing popularity of dietary supplements, especially in developed countries, fuels demand for Vitamin E as a key ingredient. Technological advancements in production and extraction processes lead to higher-quality and more cost-effective Vitamin E, enhancing market accessibility. Favorable regulatory environments in several regions also support market expansion.
Challenges in the Vitamin E Market Market
The Vitamin E market faces challenges such as fluctuating raw material prices, particularly for natural Vitamin E sources. The competitive landscape necessitates continuous innovation and strategic partnerships to maintain a strong market position. Regulatory changes and evolving consumer preferences pose ongoing challenges for manufacturers to adapt to. The global supply chain disruptions cause occasional shortages in raw materials, impacting overall production and costs.
Emerging Opportunities in Vitamin E Market
Emerging opportunities exist in the development of novel Vitamin E delivery systems, such as nanoparticles and microencapsulation, to improve its bioavailability and efficacy. Strategic partnerships between Vitamin E manufacturers and functional food & beverage companies offer significant growth potential. Expansion into emerging markets, particularly in Asia-Pacific and Latin America, provides promising avenues for market growth. The increasing integration of Vitamin E into personalized nutrition products represents a significant opportunity in the years to come.
Leading Players in the Vitamin E Market Sector
- Prinova Group LLC
- Merck KGaA
- Orah Nutrichem
- Archer Daniels Midland Company
- BASF SE
- Aryan International
- Koninklijke DSM NV
- The Bountiful Company
- Jilin Beisha Pharmaceutical Co Ltd
- BTSA Biotecnologías Aplicadas SL
Key Milestones in Vitamin E Market Industry
- June 2021: Prinova launched an e-commerce website, enhancing ingredient purchases and B2B vitamin distribution.
- June 2021: One Rock Capital acquired BASF's specialty chemical facility, boosting natural Vitamin E production.
- December 2021: Kensing partnered with Azelis for enhanced distribution of vegetable oils and vitamins in EMEA.
Strategic Outlook for Vitamin E Market Market
The Vitamin E market is poised for continued growth, driven by increasing consumer health awareness, technological advancements, and expanding applications. Strategic opportunities include focusing on product innovation, particularly in delivery systems and personalized nutrition, strengthening distribution channels, and expanding into new geographic markets. Companies investing in sustainable and eco-friendly production methods will gain a competitive advantage. The long-term outlook for the Vitamin E market remains positive, with significant growth potential in the coming years.
Vitamin E Market Segmentation
-
1. Product Type
- 1.1. Natural
- 1.2. Synthetic
-
2. Application
- 2.1. Functional Food and Beverages
- 2.2. Pharmaceuticals and Dietary Supplements
- 2.3. Infant Nutrition
- 2.4. Pet Food and Animal Feed
- 2.5. Cosmetics
Vitamin E Market Segmentation By Geography
-
1. North America
- 1.1. United States
- 1.2. Canada
- 1.3. Mexico
- 1.4. Rest of North America
-
2. Europe
- 2.1. Germany
- 2.2. United Kingdom
- 2.3. France
- 2.4. Russia
- 2.5. Spain
- 2.6. Italy
- 2.7. Rest of Europe
-
3. Asia Pacific
- 3.1. India
- 3.2. China
- 3.3. Japan
- 3.4. Australia
- 3.5. Rest of Asia Pacific
-
4. South America
- 4.1. Brazil
- 4.2. Argentina
- 4.3. Rest of South America
-
5. Middle East and Africa
- 5.1. South Africa
- 5.2. Saudi Arabia
- 5.3. Rest of Middle East and Africa
Vitamin E Market REPORT HIGHLIGHTS
| Aspects | Details |
|---|---|
| Study Period | 2019-2033 |
| Base Year | 2024 |
| Estimated Year | 2025 |
| Forecast Period | 2025-2033 |
| Historical Period | 2019-2024 |
| Growth Rate | CAGR of 4.01% from 2019-2033 |
| Segmentation |
|
Table of Contents
- 1. Introduction
- 1.1. Research Scope
- 1.2. Market Segmentation
- 1.3. Research Methodology
- 1.4. Definitions and Assumptions
- 2. Executive Summary
- 2.1. Introduction
- 3. Market Dynamics
- 3.1. Introduction
- 3.2. Market Drivers
- 3.2.1. Awareness of Health Benefits Associated with Tocotrienol; Escalating Demand for Anti-Aging Products Containing Tocotrienol
- 3.3. Market Restrains
- 3.3.1. Availability of Substitutes
- 3.4. Market Trends
- 3.4.1. Increasing Demand for Vitamin E in Various Applications
- 4. Market Factor Analysis
- 4.1. Porters Five Forces
- 4.2. Supply/Value Chain
- 4.3. PESTEL analysis
- 4.4. Market Entropy
- 4.5. Patent/Trademark Analysis
- 5. Global Vitamin E Market Analysis, Insights and Forecast, 2019-2031
- 5.1. Market Analysis, Insights and Forecast - by Product Type
- 5.1.1. Natural
- 5.1.2. Synthetic
- 5.2. Market Analysis, Insights and Forecast - by Application
- 5.2.1. Functional Food and Beverages
- 5.2.2. Pharmaceuticals and Dietary Supplements
- 5.2.3. Infant Nutrition
- 5.2.4. Pet Food and Animal Feed
- 5.2.5. Cosmetics
- 5.3. Market Analysis, Insights and Forecast - by Region
- 5.3.1. North America
- 5.3.2. Europe
- 5.3.3. Asia Pacific
- 5.3.4. South America
- 5.3.5. Middle East and Africa
- 5.1. Market Analysis, Insights and Forecast - by Product Type
- 6. North America Vitamin E Market Analysis, Insights and Forecast, 2019-2031
- 6.1. Market Analysis, Insights and Forecast - by Product Type
- 6.1.1. Natural
- 6.1.2. Synthetic
- 6.2. Market Analysis, Insights and Forecast - by Application
- 6.2.1. Functional Food and Beverages
- 6.2.2. Pharmaceuticals and Dietary Supplements
- 6.2.3. Infant Nutrition
- 6.2.4. Pet Food and Animal Feed
- 6.2.5. Cosmetics
- 6.1. Market Analysis, Insights and Forecast - by Product Type
- 7. Europe Vitamin E Market Analysis, Insights and Forecast, 2019-2031
- 7.1. Market Analysis, Insights and Forecast - by Product Type
- 7.1.1. Natural
- 7.1.2. Synthetic
- 7.2. Market Analysis, Insights and Forecast - by Application
- 7.2.1. Functional Food and Beverages
- 7.2.2. Pharmaceuticals and Dietary Supplements
- 7.2.3. Infant Nutrition
- 7.2.4. Pet Food and Animal Feed
- 7.2.5. Cosmetics
- 7.1. Market Analysis, Insights and Forecast - by Product Type
- 8. Asia Pacific Vitamin E Market Analysis, Insights and Forecast, 2019-2031
- 8.1. Market Analysis, Insights and Forecast - by Product Type
- 8.1.1. Natural
- 8.1.2. Synthetic
- 8.2. Market Analysis, Insights and Forecast - by Application
- 8.2.1. Functional Food and Beverages
- 8.2.2. Pharmaceuticals and Dietary Supplements
- 8.2.3. Infant Nutrition
- 8.2.4. Pet Food and Animal Feed
- 8.2.5. Cosmetics
- 8.1. Market Analysis, Insights and Forecast - by Product Type
- 9. South America Vitamin E Market Analysis, Insights and Forecast, 2019-2031
- 9.1. Market Analysis, Insights and Forecast - by Product Type
- 9.1.1. Natural
- 9.1.2. Synthetic
- 9.2. Market Analysis, Insights and Forecast - by Application
- 9.2.1. Functional Food and Beverages
- 9.2.2. Pharmaceuticals and Dietary Supplements
- 9.2.3. Infant Nutrition
- 9.2.4. Pet Food and Animal Feed
- 9.2.5. Cosmetics
- 9.1. Market Analysis, Insights and Forecast - by Product Type
- 10. Middle East and Africa Vitamin E Market Analysis, Insights and Forecast, 2019-2031
- 10.1. Market Analysis, Insights and Forecast - by Product Type
- 10.1.1. Natural
- 10.1.2. Synthetic
- 10.2. Market Analysis, Insights and Forecast - by Application
- 10.2.1. Functional Food and Beverages
- 10.2.2. Pharmaceuticals and Dietary Supplements
- 10.2.3. Infant Nutrition
- 10.2.4. Pet Food and Animal Feed
- 10.2.5. Cosmetics
- 10.1. Market Analysis, Insights and Forecast - by Product Type
- 11. North America Vitamin E Market Analysis, Insights and Forecast, 2019-2031
- 11.1. Market Analysis, Insights and Forecast - By Country/Sub-region
- 11.1.1 United States
- 11.1.2 Canada
- 11.1.3 Mexico
- 11.1.4 Rest of North America
- 12. Europe Vitamin E Market Analysis, Insights and Forecast, 2019-2031
- 12.1. Market Analysis, Insights and Forecast - By Country/Sub-region
- 12.1.1 Germany
- 12.1.2 United Kingdom
- 12.1.3 France
- 12.1.4 Russia
- 12.1.5 Spain
- 12.1.6 Italy
- 12.1.7 Rest of Europe
- 13. Asia Pacific Vitamin E Market Analysis, Insights and Forecast, 2019-2031
- 13.1. Market Analysis, Insights and Forecast - By Country/Sub-region
- 13.1.1 India
- 13.1.2 China
- 13.1.3 Japan
- 13.1.4 Australia
- 13.1.5 Rest of Asia Pacific
- 14. South America Vitamin E Market Analysis, Insights and Forecast, 2019-2031
- 14.1. Market Analysis, Insights and Forecast - By Country/Sub-region
- 14.1.1 Brazil
- 14.1.2 Argentina
- 14.1.3 Rest of South America
- 15. Middle East and Africa Vitamin E Market Analysis, Insights and Forecast, 2019-2031
- 15.1. Market Analysis, Insights and Forecast - By Country/Sub-region
- 15.1.1 South Africa
- 15.1.2 Saudi Arabia
- 15.1.3 Rest of Middle East and Africa
- 16. Competitive Analysis
- 16.1. Global Market Share Analysis 2024
- 16.2. Company Profiles
- 16.2.1 Prinova Group LLC
- 16.2.1.1. Overview
- 16.2.1.2. Products
- 16.2.1.3. SWOT Analysis
- 16.2.1.4. Recent Developments
- 16.2.1.5. Financials (Based on Availability)
- 16.2.2 Merck KGaA
- 16.2.2.1. Overview
- 16.2.2.2. Products
- 16.2.2.3. SWOT Analysis
- 16.2.2.4. Recent Developments
- 16.2.2.5. Financials (Based on Availability)
- 16.2.3 Orah Nutrichem
- 16.2.3.1. Overview
- 16.2.3.2. Products
- 16.2.3.3. SWOT Analysis
- 16.2.3.4. Recent Developments
- 16.2.3.5. Financials (Based on Availability)
- 16.2.4 Archer Daniels Midland Company
- 16.2.4.1. Overview
- 16.2.4.2. Products
- 16.2.4.3. SWOT Analysis
- 16.2.4.4. Recent Developments
- 16.2.4.5. Financials (Based on Availability)
- 16.2.5 BASF SE
- 16.2.5.1. Overview
- 16.2.5.2. Products
- 16.2.5.3. SWOT Analysis
- 16.2.5.4. Recent Developments
- 16.2.5.5. Financials (Based on Availability)
- 16.2.6 Aryan International
- 16.2.6.1. Overview
- 16.2.6.2. Products
- 16.2.6.3. SWOT Analysis
- 16.2.6.4. Recent Developments
- 16.2.6.5. Financials (Based on Availability)
- 16.2.7 Koninklijke DSM NV
- 16.2.7.1. Overview
- 16.2.7.2. Products
- 16.2.7.3. SWOT Analysis
- 16.2.7.4. Recent Developments
- 16.2.7.5. Financials (Based on Availability)
- 16.2.8 The Bountiful Company*List Not Exhaustive
- 16.2.8.1. Overview
- 16.2.8.2. Products
- 16.2.8.3. SWOT Analysis
- 16.2.8.4. Recent Developments
- 16.2.8.5. Financials (Based on Availability)
- 16.2.9 Jilin Beisha Pharmaceutical Co Ltd
- 16.2.9.1. Overview
- 16.2.9.2. Products
- 16.2.9.3. SWOT Analysis
- 16.2.9.4. Recent Developments
- 16.2.9.5. Financials (Based on Availability)
- 16.2.10 BTSA Biotecnologías Aplicadas SL
- 16.2.10.1. Overview
- 16.2.10.2. Products
- 16.2.10.3. SWOT Analysis
- 16.2.10.4. Recent Developments
- 16.2.10.5. Financials (Based on Availability)
- 16.2.1 Prinova Group LLC
List of Figures
- Figure 1: Global Vitamin E Market Revenue Breakdown (Million, %) by Region 2024 & 2032
- Figure 2: Global Vitamin E Market Volume Breakdown (K Tons, %) by Region 2024 & 2032
- Figure 3: North America Vitamin E Market Revenue (Million), by Country 2024 & 2032
- Figure 4: North America Vitamin E Market Volume (K Tons), by Country 2024 & 2032
- Figure 5: North America Vitamin E Market Revenue Share (%), by Country 2024 & 2032
- Figure 6: North America Vitamin E Market Volume Share (%), by Country 2024 & 2032
- Figure 7: Europe Vitamin E Market Revenue (Million), by Country 2024 & 2032
- Figure 8: Europe Vitamin E Market Volume (K Tons), by Country 2024 & 2032
- Figure 9: Europe Vitamin E Market Revenue Share (%), by Country 2024 & 2032
- Figure 10: Europe Vitamin E Market Volume Share (%), by Country 2024 & 2032
- Figure 11: Asia Pacific Vitamin E Market Revenue (Million), by Country 2024 & 2032
- Figure 12: Asia Pacific Vitamin E Market Volume (K Tons), by Country 2024 & 2032
- Figure 13: Asia Pacific Vitamin E Market Revenue Share (%), by Country 2024 & 2032
- Figure 14: Asia Pacific Vitamin E Market Volume Share (%), by Country 2024 & 2032
- Figure 15: South America Vitamin E Market Revenue (Million), by Country 2024 & 2032
- Figure 16: South America Vitamin E Market Volume (K Tons), by Country 2024 & 2032
- Figure 17: South America Vitamin E Market Revenue Share (%), by Country 2024 & 2032
- Figure 18: South America Vitamin E Market Volume Share (%), by Country 2024 & 2032
- Figure 19: Middle East and Africa Vitamin E Market Revenue (Million), by Country 2024 & 2032
- Figure 20: Middle East and Africa Vitamin E Market Volume (K Tons), by Country 2024 & 2032
- Figure 21: Middle East and Africa Vitamin E Market Revenue Share (%), by Country 2024 & 2032
- Figure 22: Middle East and Africa Vitamin E Market Volume Share (%), by Country 2024 & 2032
- Figure 23: North America Vitamin E Market Revenue (Million), by Product Type 2024 & 2032
- Figure 24: North America Vitamin E Market Volume (K Tons), by Product Type 2024 & 2032
- Figure 25: North America Vitamin E Market Revenue Share (%), by Product Type 2024 & 2032
- Figure 26: North America Vitamin E Market Volume Share (%), by Product Type 2024 & 2032
- Figure 27: North America Vitamin E Market Revenue (Million), by Application 2024 & 2032
- Figure 28: North America Vitamin E Market Volume (K Tons), by Application 2024 & 2032
- Figure 29: North America Vitamin E Market Revenue Share (%), by Application 2024 & 2032
- Figure 30: North America Vitamin E Market Volume Share (%), by Application 2024 & 2032
- Figure 31: North America Vitamin E Market Revenue (Million), by Country 2024 & 2032
- Figure 32: North America Vitamin E Market Volume (K Tons), by Country 2024 & 2032
- Figure 33: North America Vitamin E Market Revenue Share (%), by Country 2024 & 2032
- Figure 34: North America Vitamin E Market Volume Share (%), by Country 2024 & 2032
- Figure 35: Europe Vitamin E Market Revenue (Million), by Product Type 2024 & 2032
- Figure 36: Europe Vitamin E Market Volume (K Tons), by Product Type 2024 & 2032
- Figure 37: Europe Vitamin E Market Revenue Share (%), by Product Type 2024 & 2032
- Figure 38: Europe Vitamin E Market Volume Share (%), by Product Type 2024 & 2032
- Figure 39: Europe Vitamin E Market Revenue (Million), by Application 2024 & 2032
- Figure 40: Europe Vitamin E Market Volume (K Tons), by Application 2024 & 2032
- Figure 41: Europe Vitamin E Market Revenue Share (%), by Application 2024 & 2032
- Figure 42: Europe Vitamin E Market Volume Share (%), by Application 2024 & 2032
- Figure 43: Europe Vitamin E Market Revenue (Million), by Country 2024 & 2032
- Figure 44: Europe Vitamin E Market Volume (K Tons), by Country 2024 & 2032
- Figure 45: Europe Vitamin E Market Revenue Share (%), by Country 2024 & 2032
- Figure 46: Europe Vitamin E Market Volume Share (%), by Country 2024 & 2032
- Figure 47: Asia Pacific Vitamin E Market Revenue (Million), by Product Type 2024 & 2032
- Figure 48: Asia Pacific Vitamin E Market Volume (K Tons), by Product Type 2024 & 2032
- Figure 49: Asia Pacific Vitamin E Market Revenue Share (%), by Product Type 2024 & 2032
- Figure 50: Asia Pacific Vitamin E Market Volume Share (%), by Product Type 2024 & 2032
- Figure 51: Asia Pacific Vitamin E Market Revenue (Million), by Application 2024 & 2032
- Figure 52: Asia Pacific Vitamin E Market Volume (K Tons), by Application 2024 & 2032
- Figure 53: Asia Pacific Vitamin E Market Revenue Share (%), by Application 2024 & 2032
- Figure 54: Asia Pacific Vitamin E Market Volume Share (%), by Application 2024 & 2032
- Figure 55: Asia Pacific Vitamin E Market Revenue (Million), by Country 2024 & 2032
- Figure 56: Asia Pacific Vitamin E Market Volume (K Tons), by Country 2024 & 2032
- Figure 57: Asia Pacific Vitamin E Market Revenue Share (%), by Country 2024 & 2032
- Figure 58: Asia Pacific Vitamin E Market Volume Share (%), by Country 2024 & 2032
- Figure 59: South America Vitamin E Market Revenue (Million), by Product Type 2024 & 2032
- Figure 60: South America Vitamin E Market Volume (K Tons), by Product Type 2024 & 2032
- Figure 61: South America Vitamin E Market Revenue Share (%), by Product Type 2024 & 2032
- Figure 62: South America Vitamin E Market Volume Share (%), by Product Type 2024 & 2032
- Figure 63: South America Vitamin E Market Revenue (Million), by Application 2024 & 2032
- Figure 64: South America Vitamin E Market Volume (K Tons), by Application 2024 & 2032
- Figure 65: South America Vitamin E Market Revenue Share (%), by Application 2024 & 2032
- Figure 66: South America Vitamin E Market Volume Share (%), by Application 2024 & 2032
- Figure 67: South America Vitamin E Market Revenue (Million), by Country 2024 & 2032
- Figure 68: South America Vitamin E Market Volume (K Tons), by Country 2024 & 2032
- Figure 69: South America Vitamin E Market Revenue Share (%), by Country 2024 & 2032
- Figure 70: South America Vitamin E Market Volume Share (%), by Country 2024 & 2032
- Figure 71: Middle East and Africa Vitamin E Market Revenue (Million), by Product Type 2024 & 2032
- Figure 72: Middle East and Africa Vitamin E Market Volume (K Tons), by Product Type 2024 & 2032
- Figure 73: Middle East and Africa Vitamin E Market Revenue Share (%), by Product Type 2024 & 2032
- Figure 74: Middle East and Africa Vitamin E Market Volume Share (%), by Product Type 2024 & 2032
- Figure 75: Middle East and Africa Vitamin E Market Revenue (Million), by Application 2024 & 2032
- Figure 76: Middle East and Africa Vitamin E Market Volume (K Tons), by Application 2024 & 2032
- Figure 77: Middle East and Africa Vitamin E Market Revenue Share (%), by Application 2024 & 2032
- Figure 78: Middle East and Africa Vitamin E Market Volume Share (%), by Application 2024 & 2032
- Figure 79: Middle East and Africa Vitamin E Market Revenue (Million), by Country 2024 & 2032
- Figure 80: Middle East and Africa Vitamin E Market Volume (K Tons), by Country 2024 & 2032
- Figure 81: Middle East and Africa Vitamin E Market Revenue Share (%), by Country 2024 & 2032
- Figure 82: Middle East and Africa Vitamin E Market Volume Share (%), by Country 2024 & 2032
List of Tables
- Table 1: Global Vitamin E Market Revenue Million Forecast, by Region 2019 & 2032
- Table 2: Global Vitamin E Market Volume K Tons Forecast, by Region 2019 & 2032
- Table 3: Global Vitamin E Market Revenue Million Forecast, by Product Type 2019 & 2032
- Table 4: Global Vitamin E Market Volume K Tons Forecast, by Product Type 2019 & 2032
- Table 5: Global Vitamin E Market Revenue Million Forecast, by Application 2019 & 2032
- Table 6: Global Vitamin E Market Volume K Tons Forecast, by Application 2019 & 2032
- Table 7: Global Vitamin E Market Revenue Million Forecast, by Region 2019 & 2032
- Table 8: Global Vitamin E Market Volume K Tons Forecast, by Region 2019 & 2032
- Table 9: Global Vitamin E Market Revenue Million Forecast, by Country 2019 & 2032
- Table 10: Global Vitamin E Market Volume K Tons Forecast, by Country 2019 & 2032
- Table 11: United States Vitamin E Market Revenue (Million) Forecast, by Application 2019 & 2032
- Table 12: United States Vitamin E Market Volume (K Tons) Forecast, by Application 2019 & 2032
- Table 13: Canada Vitamin E Market Revenue (Million) Forecast, by Application 2019 & 2032
- Table 14: Canada Vitamin E Market Volume (K Tons) Forecast, by Application 2019 & 2032
- Table 15: Mexico Vitamin E Market Revenue (Million) Forecast, by Application 2019 & 2032
- Table 16: Mexico Vitamin E Market Volume (K Tons) Forecast, by Application 2019 & 2032
- Table 17: Rest of North America Vitamin E Market Revenue (Million) Forecast, by Application 2019 & 2032
- Table 18: Rest of North America Vitamin E Market Volume (K Tons) Forecast, by Application 2019 & 2032
- Table 19: Global Vitamin E Market Revenue Million Forecast, by Country 2019 & 2032
- Table 20: Global Vitamin E Market Volume K Tons Forecast, by Country 2019 & 2032
- Table 21: Germany Vitamin E Market Revenue (Million) Forecast, by Application 2019 & 2032
- Table 22: Germany Vitamin E Market Volume (K Tons) Forecast, by Application 2019 & 2032
- Table 23: United Kingdom Vitamin E Market Revenue (Million) Forecast, by Application 2019 & 2032
- Table 24: United Kingdom Vitamin E Market Volume (K Tons) Forecast, by Application 2019 & 2032
- Table 25: France Vitamin E Market Revenue (Million) Forecast, by Application 2019 & 2032
- Table 26: France Vitamin E Market Volume (K Tons) Forecast, by Application 2019 & 2032
- Table 27: Russia Vitamin E Market Revenue (Million) Forecast, by Application 2019 & 2032
- Table 28: Russia Vitamin E Market Volume (K Tons) Forecast, by Application 2019 & 2032
- Table 29: Spain Vitamin E Market Revenue (Million) Forecast, by Application 2019 & 2032
- Table 30: Spain Vitamin E Market Volume (K Tons) Forecast, by Application 2019 & 2032
- Table 31: Italy Vitamin E Market Revenue (Million) Forecast, by Application 2019 & 2032
- Table 32: Italy Vitamin E Market Volume (K Tons) Forecast, by Application 2019 & 2032
- Table 33: Rest of Europe Vitamin E Market Revenue (Million) Forecast, by Application 2019 & 2032
- Table 34: Rest of Europe Vitamin E Market Volume (K Tons) Forecast, by Application 2019 & 2032
- Table 35: Global Vitamin E Market Revenue Million Forecast, by Country 2019 & 2032
- Table 36: Global Vitamin E Market Volume K Tons Forecast, by Country 2019 & 2032
- Table 37: India Vitamin E Market Revenue (Million) Forecast, by Application 2019 & 2032
- Table 38: India Vitamin E Market Volume (K Tons) Forecast, by Application 2019 & 2032
- Table 39: China Vitamin E Market Revenue (Million) Forecast, by Application 2019 & 2032
- Table 40: China Vitamin E Market Volume (K Tons) Forecast, by Application 2019 & 2032
- Table 41: Japan Vitamin E Market Revenue (Million) Forecast, by Application 2019 & 2032
- Table 42: Japan Vitamin E Market Volume (K Tons) Forecast, by Application 2019 & 2032
- Table 43: Australia Vitamin E Market Revenue (Million) Forecast, by Application 2019 & 2032
- Table 44: Australia Vitamin E Market Volume (K Tons) Forecast, by Application 2019 & 2032
- Table 45: Rest of Asia Pacific Vitamin E Market Revenue (Million) Forecast, by Application 2019 & 2032
- Table 46: Rest of Asia Pacific Vitamin E Market Volume (K Tons) Forecast, by Application 2019 & 2032
- Table 47: Global Vitamin E Market Revenue Million Forecast, by Country 2019 & 2032
- Table 48: Global Vitamin E Market Volume K Tons Forecast, by Country 2019 & 2032
- Table 49: Brazil Vitamin E Market Revenue (Million) Forecast, by Application 2019 & 2032
- Table 50: Brazil Vitamin E Market Volume (K Tons) Forecast, by Application 2019 & 2032
- Table 51: Argentina Vitamin E Market Revenue (Million) Forecast, by Application 2019 & 2032
- Table 52: Argentina Vitamin E Market Volume (K Tons) Forecast, by Application 2019 & 2032
- Table 53: Rest of South America Vitamin E Market Revenue (Million) Forecast, by Application 2019 & 2032
- Table 54: Rest of South America Vitamin E Market Volume (K Tons) Forecast, by Application 2019 & 2032
- Table 55: Global Vitamin E Market Revenue Million Forecast, by Country 2019 & 2032
- Table 56: Global Vitamin E Market Volume K Tons Forecast, by Country 2019 & 2032
- Table 57: South Africa Vitamin E Market Revenue (Million) Forecast, by Application 2019 & 2032
- Table 58: South Africa Vitamin E Market Volume (K Tons) Forecast, by Application 2019 & 2032
- Table 59: Saudi Arabia Vitamin E Market Revenue (Million) Forecast, by Application 2019 & 2032
- Table 60: Saudi Arabia Vitamin E Market Volume (K Tons) Forecast, by Application 2019 & 2032
- Table 61: Rest of Middle East and Africa Vitamin E Market Revenue (Million) Forecast, by Application 2019 & 2032
- Table 62: Rest of Middle East and Africa Vitamin E Market Volume (K Tons) Forecast, by Application 2019 & 2032
- Table 63: Global Vitamin E Market Revenue Million Forecast, by Product Type 2019 & 2032
- Table 64: Global Vitamin E Market Volume K Tons Forecast, by Product Type 2019 & 2032
- Table 65: Global Vitamin E Market Revenue Million Forecast, by Application 2019 & 2032
- Table 66: Global Vitamin E Market Volume K Tons Forecast, by Application 2019 & 2032
- Table 67: Global Vitamin E Market Revenue Million Forecast, by Country 2019 & 2032
- Table 68: Global Vitamin E Market Volume K Tons Forecast, by Country 2019 & 2032
- Table 69: United States Vitamin E Market Revenue (Million) Forecast, by Application 2019 & 2032
- Table 70: United States Vitamin E Market Volume (K Tons) Forecast, by Application 2019 & 2032
- Table 71: Canada Vitamin E Market Revenue (Million) Forecast, by Application 2019 & 2032
- Table 72: Canada Vitamin E Market Volume (K Tons) Forecast, by Application 2019 & 2032
- Table 73: Mexico Vitamin E Market Revenue (Million) Forecast, by Application 2019 & 2032
- Table 74: Mexico Vitamin E Market Volume (K Tons) Forecast, by Application 2019 & 2032
- Table 75: Rest of North America Vitamin E Market Revenue (Million) Forecast, by Application 2019 & 2032
- Table 76: Rest of North America Vitamin E Market Volume (K Tons) Forecast, by Application 2019 & 2032
- Table 77: Global Vitamin E Market Revenue Million Forecast, by Product Type 2019 & 2032
- Table 78: Global Vitamin E Market Volume K Tons Forecast, by Product Type 2019 & 2032
- Table 79: Global Vitamin E Market Revenue Million Forecast, by Application 2019 & 2032
- Table 80: Global Vitamin E Market Volume K Tons Forecast, by Application 2019 & 2032
- Table 81: Global Vitamin E Market Revenue Million Forecast, by Country 2019 & 2032
- Table 82: Global Vitamin E Market Volume K Tons Forecast, by Country 2019 & 2032
- Table 83: Germany Vitamin E Market Revenue (Million) Forecast, by Application 2019 & 2032
- Table 84: Germany Vitamin E Market Volume (K Tons) Forecast, by Application 2019 & 2032
- Table 85: United Kingdom Vitamin E Market Revenue (Million) Forecast, by Application 2019 & 2032
- Table 86: United Kingdom Vitamin E Market Volume (K Tons) Forecast, by Application 2019 & 2032
- Table 87: France Vitamin E Market Revenue (Million) Forecast, by Application 2019 & 2032
- Table 88: France Vitamin E Market Volume (K Tons) Forecast, by Application 2019 & 2032
- Table 89: Russia Vitamin E Market Revenue (Million) Forecast, by Application 2019 & 2032
- Table 90: Russia Vitamin E Market Volume (K Tons) Forecast, by Application 2019 & 2032
- Table 91: Spain Vitamin E Market Revenue (Million) Forecast, by Application 2019 & 2032
- Table 92: Spain Vitamin E Market Volume (K Tons) Forecast, by Application 2019 & 2032
- Table 93: Italy Vitamin E Market Revenue (Million) Forecast, by Application 2019 & 2032
- Table 94: Italy Vitamin E Market Volume (K Tons) Forecast, by Application 2019 & 2032
- Table 95: Rest of Europe Vitamin E Market Revenue (Million) Forecast, by Application 2019 & 2032
- Table 96: Rest of Europe Vitamin E Market Volume (K Tons) Forecast, by Application 2019 & 2032
- Table 97: Global Vitamin E Market Revenue Million Forecast, by Product Type 2019 & 2032
- Table 98: Global Vitamin E Market Volume K Tons Forecast, by Product Type 2019 & 2032
- Table 99: Global Vitamin E Market Revenue Million Forecast, by Application 2019 & 2032
- Table 100: Global Vitamin E Market Volume K Tons Forecast, by Application 2019 & 2032
- Table 101: Global Vitamin E Market Revenue Million Forecast, by Country 2019 & 2032
- Table 102: Global Vitamin E Market Volume K Tons Forecast, by Country 2019 & 2032
- Table 103: India Vitamin E Market Revenue (Million) Forecast, by Application 2019 & 2032
- Table 104: India Vitamin E Market Volume (K Tons) Forecast, by Application 2019 & 2032
- Table 105: China Vitamin E Market Revenue (Million) Forecast, by Application 2019 & 2032
- Table 106: China Vitamin E Market Volume (K Tons) Forecast, by Application 2019 & 2032
- Table 107: Japan Vitamin E Market Revenue (Million) Forecast, by Application 2019 & 2032
- Table 108: Japan Vitamin E Market Volume (K Tons) Forecast, by Application 2019 & 2032
- Table 109: Australia Vitamin E Market Revenue (Million) Forecast, by Application 2019 & 2032
- Table 110: Australia Vitamin E Market Volume (K Tons) Forecast, by Application 2019 & 2032
- Table 111: Rest of Asia Pacific Vitamin E Market Revenue (Million) Forecast, by Application 2019 & 2032
- Table 112: Rest of Asia Pacific Vitamin E Market Volume (K Tons) Forecast, by Application 2019 & 2032
- Table 113: Global Vitamin E Market Revenue Million Forecast, by Product Type 2019 & 2032
- Table 114: Global Vitamin E Market Volume K Tons Forecast, by Product Type 2019 & 2032
- Table 115: Global Vitamin E Market Revenue Million Forecast, by Application 2019 & 2032
- Table 116: Global Vitamin E Market Volume K Tons Forecast, by Application 2019 & 2032
- Table 117: Global Vitamin E Market Revenue Million Forecast, by Country 2019 & 2032
- Table 118: Global Vitamin E Market Volume K Tons Forecast, by Country 2019 & 2032
- Table 119: Brazil Vitamin E Market Revenue (Million) Forecast, by Application 2019 & 2032
- Table 120: Brazil Vitamin E Market Volume (K Tons) Forecast, by Application 2019 & 2032
- Table 121: Argentina Vitamin E Market Revenue (Million) Forecast, by Application 2019 & 2032
- Table 122: Argentina Vitamin E Market Volume (K Tons) Forecast, by Application 2019 & 2032
- Table 123: Rest of South America Vitamin E Market Revenue (Million) Forecast, by Application 2019 & 2032
- Table 124: Rest of South America Vitamin E Market Volume (K Tons) Forecast, by Application 2019 & 2032
- Table 125: Global Vitamin E Market Revenue Million Forecast, by Product Type 2019 & 2032
- Table 126: Global Vitamin E Market Volume K Tons Forecast, by Product Type 2019 & 2032
- Table 127: Global Vitamin E Market Revenue Million Forecast, by Application 2019 & 2032
- Table 128: Global Vitamin E Market Volume K Tons Forecast, by Application 2019 & 2032
- Table 129: Global Vitamin E Market Revenue Million Forecast, by Country 2019 & 2032
- Table 130: Global Vitamin E Market Volume K Tons Forecast, by Country 2019 & 2032
- Table 131: South Africa Vitamin E Market Revenue (Million) Forecast, by Application 2019 & 2032
- Table 132: South Africa Vitamin E Market Volume (K Tons) Forecast, by Application 2019 & 2032
- Table 133: Saudi Arabia Vitamin E Market Revenue (Million) Forecast, by Application 2019 & 2032
- Table 134: Saudi Arabia Vitamin E Market Volume (K Tons) Forecast, by Application 2019 & 2032
- Table 135: Rest of Middle East and Africa Vitamin E Market Revenue (Million) Forecast, by Application 2019 & 2032
- Table 136: Rest of Middle East and Africa Vitamin E Market Volume (K Tons) Forecast, by Application 2019 & 2032
Frequently Asked Questions
1. What is the projected Compound Annual Growth Rate (CAGR) of the Vitamin E Market?
The projected CAGR is approximately 4.01%.
2. Which companies are prominent players in the Vitamin E Market?
Key companies in the market include Prinova Group LLC, Merck KGaA, Orah Nutrichem, Archer Daniels Midland Company, BASF SE, Aryan International, Koninklijke DSM NV, The Bountiful Company*List Not Exhaustive, Jilin Beisha Pharmaceutical Co Ltd, BTSA Biotecnologías Aplicadas SL.
3. What are the main segments of the Vitamin E Market?
The market segments include Product Type, Application.
4. Can you provide details about the market size?
The market size is estimated to be USD 3924.44 Million as of 2022.
5. What are some drivers contributing to market growth?
Awareness of Health Benefits Associated with Tocotrienol; Escalating Demand for Anti-Aging Products Containing Tocotrienol.
6. What are the notable trends driving market growth?
Increasing Demand for Vitamin E in Various Applications.
7. Are there any restraints impacting market growth?
Availability of Substitutes.
8. Can you provide examples of recent developments in the market?
December 2021: The Kensing company announced its partnership with Azelis for a better and more feasible distribution of vegetable oils, vitamins, and personal care products in Europe and the Middle East and Africa. Azelis has a strong distribution network across these regions in the B2B segment. The company mainly aims to distribute its mainstream products Covi-ox, Covitol, Copherol, and Generol.
9. What pricing options are available for accessing the report?
Pricing options include single-user, multi-user, and enterprise licenses priced at USD 4750, USD 5250, and USD 8750 respectively.
10. Is the market size provided in terms of value or volume?
The market size is provided in terms of value, measured in Million and volume, measured in K Tons.
11. Are there any specific market keywords associated with the report?
Yes, the market keyword associated with the report is "Vitamin E Market," which aids in identifying and referencing the specific market segment covered.
12. How do I determine which pricing option suits my needs best?
The pricing options vary based on user requirements and access needs. Individual users may opt for single-user licenses, while businesses requiring broader access may choose multi-user or enterprise licenses for cost-effective access to the report.
13. Are there any additional resources or data provided in the Vitamin E Market report?
While the report offers comprehensive insights, it's advisable to review the specific contents or supplementary materials provided to ascertain if additional resources or data are available.
14. How can I stay updated on further developments or reports in the Vitamin E Market?
To stay informed about further developments, trends, and reports in the Vitamin E Market, consider subscribing to industry newsletters, following relevant companies and organizations, or regularly checking reputable industry news sources and publications.
Methodology
Step 1 - Identification of Relevant Samples Size from Population Database


Step 2 - Approaches for Defining Global Market Size (Value, Volume* & Price*)

Note*: In applicable scenarios
Step 3 - Data Sources
Primary Research
- Web Analytics
- Survey Reports
- Research Institute
- Latest Research Reports
- Opinion Leaders
Secondary Research
- Annual Reports
- White Paper
- Latest Press Release
- Industry Association
- Paid Database
- Investor Presentations

Step 4 - Data Triangulation
Involves using different sources of information in order to increase the validity of a study
These sources are likely to be stakeholders in a program - participants, other researchers, program staff, other community members, and so on.
Then we put all data in single framework & apply various statistical tools to find out the dynamic on the market.
During the analysis stage, feedback from the stakeholder groups would be compared to determine areas of agreement as well as areas of divergence
