

Key Insights
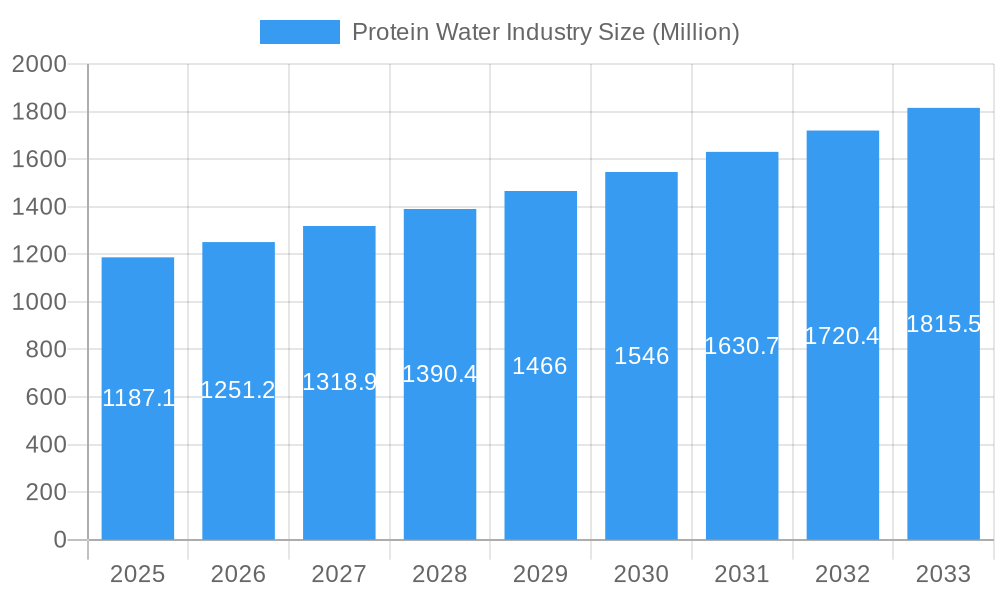
The global Protein Water market is poised for robust expansion, projected to reach an estimated market size of USD 1187.1 million by 2025, with a significant Compound Annual Growth Rate (CAGR) of 5.50% anticipated from 2025 to 2033. This growth is primarily propelled by the increasing consumer focus on health and wellness, leading to a surge in demand for convenient and functional beverages. The rising popularity of fitness and sports nutrition, coupled with a growing awareness of the benefits of protein for muscle recovery, satiety, and overall well-being, are key drivers. Furthermore, product innovation, including the introduction of diverse flavors and functional additives, is catering to a wider consumer base and stimulating market penetration. The shift towards healthier lifestyle choices, especially among millennials and Gen Z, is creating a fertile ground for protein-infused beverages as a desirable alternative to traditional sugary drinks.
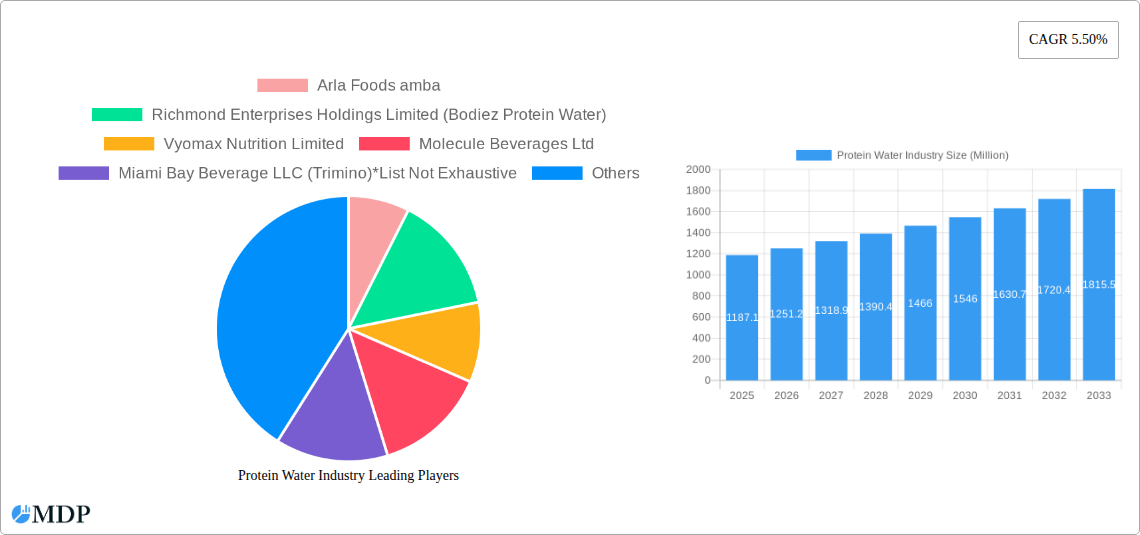
Protein Water Industry Market Size (In Billion)
The market's trajectory is also influenced by evolving distribution strategies, with online channels witnessing remarkable growth, offering unparalleled convenience and accessibility. Supermarkets and hypermarkets continue to be significant contributors, while convenience stores are adapting to include healthier options. Key players in the market are actively engaged in product development and strategic partnerships to enhance their market presence. While the market exhibits strong growth potential, certain restraints such as the higher price point compared to conventional beverages and potential consumer skepticism regarding the taste and necessity of protein in water need to be addressed. However, the continuous efforts by manufacturers to improve taste profiles, offer a wider range of formulations, and educate consumers about the benefits of protein water are expected to mitigate these challenges, paving the way for sustained market dominance.
Protein Water Industry Company Market Share
Unveiling the Future of Hydration: The Comprehensive Protein Water Industry Report (2019-2033)
**Unlock the booming potential of the global protein water market with this in-depth report. Spanning from 2019 to 2033, with a focused analysis on the 2025 base and estimated year, this comprehensive study offers critical insights into market dynamics, industry trends, leading segments, product innovations, growth drivers, challenges, and emerging opportunities. Gain a competitive edge by understanding the strategic moves of key players and leveraging actionable intelligence for informed decision-making. This report is an essential resource for beverage manufacturers, ingredient suppliers, distributors, investors, and market strategists seeking to capitalize on the rapidly evolving health and wellness beverage sector. The global protein water market is projected to reach *$xx Million* by 2033, exhibiting a robust Compound Annual Growth Rate (CAGR) of xx% during the forecast period.**
Protein Water Industry Market Dynamics & Concentration
The global protein water market is characterized by dynamic growth and increasing concentration among a few key innovators. This sector is fueled by a confluence of factors including rising health consciousness, a demand for convenient and functional beverages, and the growing popularity of plant-based and low-sugar alternatives. Innovation remains a primary driver, with companies constantly exploring new protein sources, flavor profiles, and functional benefits to cater to diverse consumer needs. Regulatory frameworks, particularly concerning health claims and ingredient transparency, are evolving and will continue to shape market entry and product development strategies. Product substitutes, such as traditional protein shakes, RTD protein drinks, and fortified waters, pose a competitive landscape, yet protein water carves out its niche through its lighter texture and refreshing appeal. End-user trends are heavily influenced by fitness enthusiasts, health-conscious individuals, and those seeking convenient post-workout recovery or on-the-go nutritional boosts. Merger and acquisition (M&A) activities are expected to intensify as larger beverage corporations seek to integrate this high-growth segment into their portfolios, potentially leading to increased market concentration. The market share of major players is anticipated to grow substantially, with M&A deal counts projected to increase by xx% by 2033, signaling a consolidating yet rapidly expanding market.
Protein Water Industry Industry Trends & Analysis
The protein water industry is experiencing a period of significant expansion, driven by a multifaceted approach to consumer wellness and convenience. The burgeoning health and fitness culture is a primary catalyst, with consumers actively seeking beverages that support their active lifestyles and dietary goals. This translates into a growing demand for protein-rich options that are both functional and palatable. Technological disruptions are playing a crucial role, with advancements in protein extraction and formulation enabling the creation of cleaner labels, improved taste profiles, and enhanced bioavailability. For instance, the development of advanced filtration techniques for whey and plant-based proteins has been instrumental in producing a clearer, less viscous product that aligns with consumer expectations of a 'water' format. Consumer preferences are increasingly leaning towards products that offer tangible health benefits beyond basic hydration. This includes a strong preference for zero-sugar, low-calorie, and natural ingredient formulations. The convenience factor is paramount, with the on-the-go nature of bottled protein water appealing to busy lifestyles. Competitive dynamics are intensifying, with established beverage giants and agile startups alike vying for market share. This competition fosters innovation in product offerings, marketing strategies, and distribution channels. The market penetration of protein water, while still nascent in some regions, is rapidly increasing, indicating a substantial runway for future growth. The projected CAGR of xx% underscores the sector's robust momentum. This trend is further amplified by the growing awareness of the benefits of protein for satiety, muscle repair, and overall metabolic health.
Leading Markets & Segments in Protein Water Industry
The global protein water market showcases distinct regional strengths and segment dominance. North America, particularly the United States, currently leads the market due to a highly developed health and wellness culture, high disposable incomes, and a proactive consumer base actively seeking functional beverages. Europe follows closely, with a growing awareness of plant-based diets and fitness trends contributing to its market prominence.
- Dominant Region: North America, with its established fitness culture and strong consumer demand for functional beverages, stands as the leading market for protein water.
- Key Market Drivers in North America:
- High consumer spending on health and wellness products.
- Widespread adoption of fitness trends and active lifestyles.
- Availability of advanced distribution networks.
- Strong regulatory support for novel food and beverage products.
- Dominant Segment - Type: Flavored protein water holds a significant market share. Consumers are drawn to the enhanced taste experience, with a wide array of fruit-inspired and indulgent flavor options catering to diverse palates. Unflavored variants are gaining traction among those who prefer to customize their beverage experience or avoid artificial sweeteners and flavorings.
- Key Drivers for Flavored Dominance:
- Improved palatability and consumer appeal.
- Variety of innovative flavor profiles.
- Effective marketing strategies highlighting taste.
- Key Drivers for Flavored Dominance:
- Dominant Segment - Distribution Channel: Online Channels are experiencing rapid growth and are increasingly becoming a dominant force in protein water distribution. The convenience of e-commerce, coupled with the ability to access a wider variety of brands and specialized products, appeals to a broad consumer base. Supermarkets/Hypermarkets remain crucial for mainstream accessibility and impulse purchases, while Convenience Stores are vital for immediate consumption needs.
- Key Drivers for Online Channel Dominance:
- Convenience and accessibility.
- Wider product selection and competitive pricing.
- Direct-to-consumer (DTC) models and subscription services.
- Targeted digital marketing reach.
- Key Drivers for Online Channel Dominance:
Protein Water Industry Product Developments
Product innovation in the protein water industry is rapidly evolving to meet consumer demand for healthier, more convenient, and better-tasting beverages. Key developments include the introduction of novel protein sources such as pea, rice, and soy proteins, catering to the growing vegan and plant-based market. Companies are also focusing on clean label formulations, minimizing artificial ingredients, and offering sugar-free and low-calorie options. Enhanced functional benefits, such as added electrolytes for hydration or BCAAs for muscle recovery, are becoming standard features. These advancements provide a competitive edge by offering tailored solutions for specific consumer needs and lifestyle preferences, distinguishing brands in a crowded market.
Key Drivers of Protein Water Industry Growth
The protein water industry is propelled by a combination of powerful growth drivers. The escalating global focus on health and wellness, coupled with increased participation in fitness activities, fuels the demand for convenient protein sources. Technological advancements in ingredient processing and beverage formulation are enabling the creation of more palatable and functional protein waters. Furthermore, changing consumer preferences towards natural, low-sugar, and plant-based alternatives align perfectly with the attributes of many protein water products. The expanding online retail landscape also provides increased accessibility and reach for these specialized beverages, making them readily available to a wider consumer base.
Challenges in the Protein Water Industry Market
Despite its promising growth trajectory, the protein water industry faces several challenges. Regulatory hurdles concerning health claims and labeling can impact market entry and marketing strategies. The supply chain for specialized protein ingredients can sometimes be complex and costly, affecting production efficiency and pricing. Intense competitive pressures from established beverage brands and emerging players necessitate continuous innovation and strategic differentiation. Furthermore, educating consumers about the distinct benefits of protein water compared to traditional protein supplements remains an ongoing marketing challenge.
Emerging Opportunities in Protein Water Industry
The protein water market is ripe with emerging opportunities for growth and innovation. The expanding global middle class and increasing disposable incomes in developing economies present significant untapped markets. The growing trend of personalized nutrition and the demand for customized beverage solutions offer avenues for niche product development. Strategic partnerships with fitness centers, athletic organizations, and wellness influencers can enhance brand visibility and consumer trust. Furthermore, advancements in sustainable packaging and ingredient sourcing can appeal to environmentally conscious consumers, creating a competitive advantage.
Leading Players in the Protein Water Industry Sector
- Arla Foods amba
- Richmond Enterprises Holdings Limited (Bodiez Protein Water)
- Vyomax Nutrition Limited
- Molecule Beverages Ltd
- Miami Bay Beverage LLC (Trimino)
- Aquatein
- Fizzique LLC
- Protein2o Inc
- Agropur Inc (BiPro USA)
- Glanbia PLC (Optimum Nutrition Inc )
Key Milestones in Protein Water Industry Industry
- July 2022: Mumbai-based Aquatein (Athlex Beverages Private Limited), India's first protein water brand, launched three new products. Through its strategic offline partnerships, the brand is all set to roll out 1200 direct points of sales and also launch the brand internationally through strategic local partnerships in the Middle East and North Africa (MENA) region.
- April 2022: The United Kingdom's flavored protein water brand, Vieve, expanded its portfolio with the launch of a new range of vegan protein waters. The range is available in two flavors: Wild Cherry and Peach & Orange. The vegan beverages contain 10g of protein, zero sugar, and 50 calories per bottle.
- August 2021: Vita Coco's parent company All Market Inc. launched a new line of protein-infused waters called PWR LIFT. It is a line of zero-sugar flavored waters with 10 grams of whey protein per 16.9 oz PET bottle. All four flavors that are namely lemon-lime, orange mango, berry strawberry, and blueberry pomegranate contain 50 calories each and no added juice.
Strategic Outlook for Protein Water Industry Market
The strategic outlook for the protein water market is overwhelmingly positive, driven by sustained consumer demand for functional and convenient health beverages. Future growth will be accelerated by continuous product innovation, particularly in plant-based formulations and unique flavor profiles. Expanding into emerging markets through strategic alliances and localized marketing efforts will be crucial for capturing new consumer bases. Furthermore, a focus on sustainable practices, from ingredient sourcing to packaging, will enhance brand appeal and long-term market viability. The integration of smart technologies for personalized nutrition and direct-to-consumer engagement will also shape the competitive landscape.
Protein Water Industry Segmentation
-
1. Type
- 1.1. Flavored
- 1.2. Unflavored
-
2. Distribution Channel
- 2.1. Supermarkets/Hypermarkets
- 2.2. Convenience Stores
- 2.3. Online Channels
- 2.4. Others
Protein Water Industry Segmentation By Geography
-
1. North America
- 1.1. United States
- 1.2. Canada
- 1.3. Mexico
- 1.4. Rest of North America
-
2. Europe
- 2.1. Spain
- 2.2. United Kingdom
- 2.3. Germany
- 2.4. France
- 2.5. Italy
- 2.6. Russia
- 2.7. Rest of Europe
-
3. Asia Pacific
- 3.1. China
- 3.2. Japan
- 3.3. India
- 3.4. Australia
- 3.5. Rest of Asia Pacific
-
4. South America
- 4.1. Brazil
- 4.2. Argentina
- 4.3. Rest of South America
-
5. Middle East and Africa
- 5.1. South Africa
- 5.2. Saudi Arabia
- 5.3. Rest of Middle East and Africa
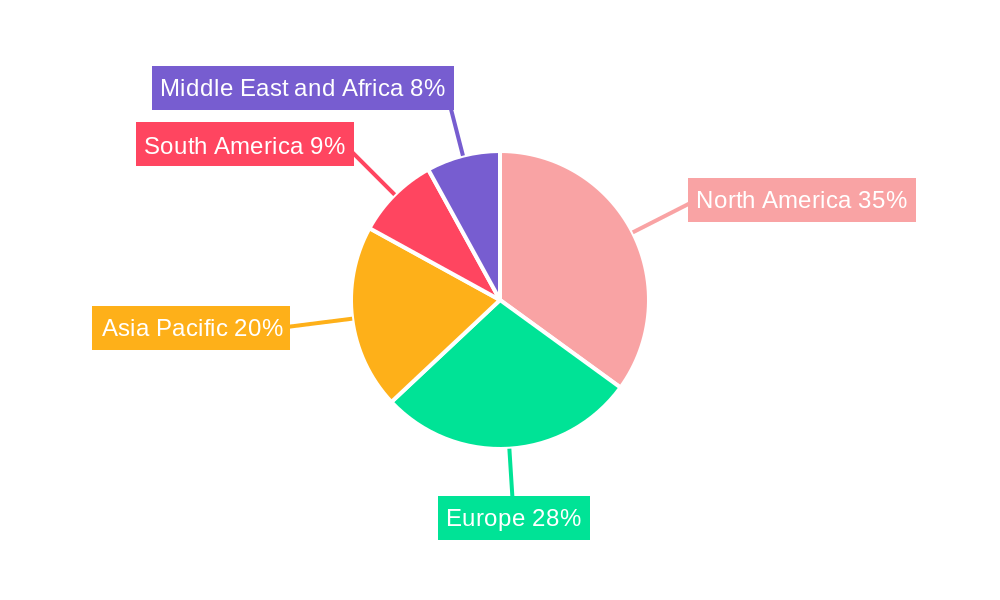
Protein Water Industry Regional Market Share
Geographic Coverage of Protein Water Industry
Protein Water Industry REPORT HIGHLIGHTS
| Aspects | Details |
|---|---|
| Study Period | 2020-2034 |
| Base Year | 2025 |
| Estimated Year | 2026 |
| Forecast Period | 2026-2034 |
| Historical Period | 2020-2025 |
| Growth Rate | CAGR of 5.50% from 2020-2034 |
| Segmentation |
|
Table of Contents
- 1. Introduction
- 1.1. Research Scope
- 1.2. Market Segmentation
- 1.3. Research Objective
- 1.4. Definitions and Assumptions
- 2. Executive Summary
- 2.1. Market Snapshot
- 3. Market Dynamics
- 3.1. Market Drivers
- 3.2. Market Restrains
- 3.3. Market Trends
- 3.4. Market Opportunities
- 4. Market Factor Analysis
- 4.1. Porters Five Forces
- 4.1.1. Bargaining Power of Suppliers
- 4.1.2. Bargaining Power of Buyers
- 4.1.3. Threat of New Entrants
- 4.1.4. Threat of Substitutes
- 4.1.5. Competitive Rivalry
- 4.2. PESTEL analysis
- 4.3. BCG Analysis
- 4.3.1. Stars (High Growth, High Market Share)
- 4.3.2. Cash Cows (Low Growth, High Market Share)
- 4.3.3. Question Mark (High Growth, Low Market Share)
- 4.3.4. Dogs (Low Growth, Low Market Share)
- 4.4. Ansoff Matrix Analysis
- 4.5. Supply Chain Analysis
- 4.6. Regulatory Landscape
- 4.7. Current Market Potential and Opportunity Assessment (TAM–SAM–SOM Framework)
- 4.8. MDP Analyst Note
- 4.1. Porters Five Forces
- 5. Market Analysis, Insights and Forecast 2021-2033
- 5.1. Market Analysis, Insights and Forecast - by Type
- 5.1.1. Flavored
- 5.1.2. Unflavored
- 5.2. Market Analysis, Insights and Forecast - by Distribution Channel
- 5.2.1. Supermarkets/Hypermarkets
- 5.2.2. Convenience Stores
- 5.2.3. Online Channels
- 5.2.4. Others
- 5.3. Market Analysis, Insights and Forecast - by Region
- 5.3.1. North America
- 5.3.2. Europe
- 5.3.3. Asia Pacific
- 5.3.4. South America
- 5.3.5. Middle East and Africa
- 5.1. Market Analysis, Insights and Forecast - by Type
- 6. Global Protein Water Industry Analysis, Insights and Forecast, 2021-2033
- 6.1. Market Analysis, Insights and Forecast - by Type
- 6.1.1. Flavored
- 6.1.2. Unflavored
- 6.2. Market Analysis, Insights and Forecast - by Distribution Channel
- 6.2.1. Supermarkets/Hypermarkets
- 6.2.2. Convenience Stores
- 6.2.3. Online Channels
- 6.2.4. Others
- 6.1. Market Analysis, Insights and Forecast - by Type
- 7. North America Protein Water Industry Analysis, Insights and Forecast, 2020-2032
- 7.1. Market Analysis, Insights and Forecast - by Type
- 7.1.1. Flavored
- 7.1.2. Unflavored
- 7.2. Market Analysis, Insights and Forecast - by Distribution Channel
- 7.2.1. Supermarkets/Hypermarkets
- 7.2.2. Convenience Stores
- 7.2.3. Online Channels
- 7.2.4. Others
- 7.1. Market Analysis, Insights and Forecast - by Type
- 8. Europe Protein Water Industry Analysis, Insights and Forecast, 2020-2032
- 8.1. Market Analysis, Insights and Forecast - by Type
- 8.1.1. Flavored
- 8.1.2. Unflavored
- 8.2. Market Analysis, Insights and Forecast - by Distribution Channel
- 8.2.1. Supermarkets/Hypermarkets
- 8.2.2. Convenience Stores
- 8.2.3. Online Channels
- 8.2.4. Others
- 8.1. Market Analysis, Insights and Forecast - by Type
- 9. Asia Pacific Protein Water Industry Analysis, Insights and Forecast, 2020-2032
- 9.1. Market Analysis, Insights and Forecast - by Type
- 9.1.1. Flavored
- 9.1.2. Unflavored
- 9.2. Market Analysis, Insights and Forecast - by Distribution Channel
- 9.2.1. Supermarkets/Hypermarkets
- 9.2.2. Convenience Stores
- 9.2.3. Online Channels
- 9.2.4. Others
- 9.1. Market Analysis, Insights and Forecast - by Type
- 10. South America Protein Water Industry Analysis, Insights and Forecast, 2020-2032
- 10.1. Market Analysis, Insights and Forecast - by Type
- 10.1.1. Flavored
- 10.1.2. Unflavored
- 10.2. Market Analysis, Insights and Forecast - by Distribution Channel
- 10.2.1. Supermarkets/Hypermarkets
- 10.2.2. Convenience Stores
- 10.2.3. Online Channels
- 10.2.4. Others
- 10.1. Market Analysis, Insights and Forecast - by Type
- 11. Middle East and Africa Protein Water Industry Analysis, Insights and Forecast, 2020-2032
- 11.1. Market Analysis, Insights and Forecast - by Type
- 11.1.1. Flavored
- 11.1.2. Unflavored
- 11.2. Market Analysis, Insights and Forecast - by Distribution Channel
- 11.2.1. Supermarkets/Hypermarkets
- 11.2.2. Convenience Stores
- 11.2.3. Online Channels
- 11.2.4. Others
- 11.1. Market Analysis, Insights and Forecast - by Type
- 12. Competitive Analysis
- 12.1. Company Profiles
- 12.1.1 Arla Foods amba
- 12.1.1.1. Company Overview
- 12.1.1.2. Products
- 12.1.1.3. Company Financials
- 12.1.1.4. SWOT Analysis
- 12.1.2 Richmond Enterprises Holdings Limited (Bodiez Protein Water)
- 12.1.2.1. Company Overview
- 12.1.2.2. Products
- 12.1.2.3. Company Financials
- 12.1.2.4. SWOT Analysis
- 12.1.3 Vyomax Nutrition Limited
- 12.1.3.1. Company Overview
- 12.1.3.2. Products
- 12.1.3.3. Company Financials
- 12.1.3.4. SWOT Analysis
- 12.1.4 Molecule Beverages Ltd
- 12.1.4.1. Company Overview
- 12.1.4.2. Products
- 12.1.4.3. Company Financials
- 12.1.4.4. SWOT Analysis
- 12.1.5 Miami Bay Beverage LLC (Trimino)*List Not Exhaustive
- 12.1.5.1. Company Overview
- 12.1.5.2. Products
- 12.1.5.3. Company Financials
- 12.1.5.4. SWOT Analysis
- 12.1.6 Aquatein
- 12.1.6.1. Company Overview
- 12.1.6.2. Products
- 12.1.6.3. Company Financials
- 12.1.6.4. SWOT Analysis
- 12.1.7 Fizzique LLC
- 12.1.7.1. Company Overview
- 12.1.7.2. Products
- 12.1.7.3. Company Financials
- 12.1.7.4. SWOT Analysis
- 12.1.8 Protein2o Inc
- 12.1.8.1. Company Overview
- 12.1.8.2. Products
- 12.1.8.3. Company Financials
- 12.1.8.4. SWOT Analysis
- 12.1.9 Agropur Inc (BiPro USA)
- 12.1.9.1. Company Overview
- 12.1.9.2. Products
- 12.1.9.3. Company Financials
- 12.1.9.4. SWOT Analysis
- 12.1.10 Glanbia PLC (Optimum Nutrition Inc )
- 12.1.10.1. Company Overview
- 12.1.10.2. Products
- 12.1.10.3. Company Financials
- 12.1.10.4. SWOT Analysis
- 12.1.1 Arla Foods amba
- 12.2. Market Entropy
- 12.2.1 Company's Key Areas Served
- 12.2.2 Recent Developments
- 12.3. Company Market Share Analysis 2025
- 12.3.1 Top 5 Companies Market Share Analysis
- 12.3.2 Top 3 Companies Market Share Analysis
- 12.4. List of Potential Customers
- 13. Research Methodology
List of Figures
- Figure 1: Global Protein Water Industry Revenue Breakdown (Million, %) by Region 2025 & 2033
- Figure 2: Global Protein Water Industry Volume Breakdown (liter , %) by Region 2025 & 2033
- Figure 3: North America Protein Water Industry Revenue (Million), by Type 2025 & 2033
- Figure 4: North America Protein Water Industry Volume (liter ), by Type 2025 & 2033
- Figure 5: North America Protein Water Industry Revenue Share (%), by Type 2025 & 2033
- Figure 6: North America Protein Water Industry Volume Share (%), by Type 2025 & 2033
- Figure 7: North America Protein Water Industry Revenue (Million), by Distribution Channel 2025 & 2033
- Figure 8: North America Protein Water Industry Volume (liter ), by Distribution Channel 2025 & 2033
- Figure 9: North America Protein Water Industry Revenue Share (%), by Distribution Channel 2025 & 2033
- Figure 10: North America Protein Water Industry Volume Share (%), by Distribution Channel 2025 & 2033
- Figure 11: North America Protein Water Industry Revenue (Million), by Country 2025 & 2033
- Figure 12: North America Protein Water Industry Volume (liter ), by Country 2025 & 2033
- Figure 13: North America Protein Water Industry Revenue Share (%), by Country 2025 & 2033
- Figure 14: North America Protein Water Industry Volume Share (%), by Country 2025 & 2033
- Figure 15: Europe Protein Water Industry Revenue (Million), by Type 2025 & 2033
- Figure 16: Europe Protein Water Industry Volume (liter ), by Type 2025 & 2033
- Figure 17: Europe Protein Water Industry Revenue Share (%), by Type 2025 & 2033
- Figure 18: Europe Protein Water Industry Volume Share (%), by Type 2025 & 2033
- Figure 19: Europe Protein Water Industry Revenue (Million), by Distribution Channel 2025 & 2033
- Figure 20: Europe Protein Water Industry Volume (liter ), by Distribution Channel 2025 & 2033
- Figure 21: Europe Protein Water Industry Revenue Share (%), by Distribution Channel 2025 & 2033
- Figure 22: Europe Protein Water Industry Volume Share (%), by Distribution Channel 2025 & 2033
- Figure 23: Europe Protein Water Industry Revenue (Million), by Country 2025 & 2033
- Figure 24: Europe Protein Water Industry Volume (liter ), by Country 2025 & 2033
- Figure 25: Europe Protein Water Industry Revenue Share (%), by Country 2025 & 2033
- Figure 26: Europe Protein Water Industry Volume Share (%), by Country 2025 & 2033
- Figure 27: Asia Pacific Protein Water Industry Revenue (Million), by Type 2025 & 2033
- Figure 28: Asia Pacific Protein Water Industry Volume (liter ), by Type 2025 & 2033
- Figure 29: Asia Pacific Protein Water Industry Revenue Share (%), by Type 2025 & 2033
- Figure 30: Asia Pacific Protein Water Industry Volume Share (%), by Type 2025 & 2033
- Figure 31: Asia Pacific Protein Water Industry Revenue (Million), by Distribution Channel 2025 & 2033
- Figure 32: Asia Pacific Protein Water Industry Volume (liter ), by Distribution Channel 2025 & 2033
- Figure 33: Asia Pacific Protein Water Industry Revenue Share (%), by Distribution Channel 2025 & 2033
- Figure 34: Asia Pacific Protein Water Industry Volume Share (%), by Distribution Channel 2025 & 2033
- Figure 35: Asia Pacific Protein Water Industry Revenue (Million), by Country 2025 & 2033
- Figure 36: Asia Pacific Protein Water Industry Volume (liter ), by Country 2025 & 2033
- Figure 37: Asia Pacific Protein Water Industry Revenue Share (%), by Country 2025 & 2033
- Figure 38: Asia Pacific Protein Water Industry Volume Share (%), by Country 2025 & 2033
- Figure 39: South America Protein Water Industry Revenue (Million), by Type 2025 & 2033
- Figure 40: South America Protein Water Industry Volume (liter ), by Type 2025 & 2033
- Figure 41: South America Protein Water Industry Revenue Share (%), by Type 2025 & 2033
- Figure 42: South America Protein Water Industry Volume Share (%), by Type 2025 & 2033
- Figure 43: South America Protein Water Industry Revenue (Million), by Distribution Channel 2025 & 2033
- Figure 44: South America Protein Water Industry Volume (liter ), by Distribution Channel 2025 & 2033
- Figure 45: South America Protein Water Industry Revenue Share (%), by Distribution Channel 2025 & 2033
- Figure 46: South America Protein Water Industry Volume Share (%), by Distribution Channel 2025 & 2033
- Figure 47: South America Protein Water Industry Revenue (Million), by Country 2025 & 2033
- Figure 48: South America Protein Water Industry Volume (liter ), by Country 2025 & 2033
- Figure 49: South America Protein Water Industry Revenue Share (%), by Country 2025 & 2033
- Figure 50: South America Protein Water Industry Volume Share (%), by Country 2025 & 2033
- Figure 51: Middle East and Africa Protein Water Industry Revenue (Million), by Type 2025 & 2033
- Figure 52: Middle East and Africa Protein Water Industry Volume (liter ), by Type 2025 & 2033
- Figure 53: Middle East and Africa Protein Water Industry Revenue Share (%), by Type 2025 & 2033
- Figure 54: Middle East and Africa Protein Water Industry Volume Share (%), by Type 2025 & 2033
- Figure 55: Middle East and Africa Protein Water Industry Revenue (Million), by Distribution Channel 2025 & 2033
- Figure 56: Middle East and Africa Protein Water Industry Volume (liter ), by Distribution Channel 2025 & 2033
- Figure 57: Middle East and Africa Protein Water Industry Revenue Share (%), by Distribution Channel 2025 & 2033
- Figure 58: Middle East and Africa Protein Water Industry Volume Share (%), by Distribution Channel 2025 & 2033
- Figure 59: Middle East and Africa Protein Water Industry Revenue (Million), by Country 2025 & 2033
- Figure 60: Middle East and Africa Protein Water Industry Volume (liter ), by Country 2025 & 2033
- Figure 61: Middle East and Africa Protein Water Industry Revenue Share (%), by Country 2025 & 2033
- Figure 62: Middle East and Africa Protein Water Industry Volume Share (%), by Country 2025 & 2033
List of Tables
- Table 1: Global Protein Water Industry Revenue Million Forecast, by Type 2020 & 2033
- Table 2: Global Protein Water Industry Volume liter Forecast, by Type 2020 & 2033
- Table 3: Global Protein Water Industry Revenue Million Forecast, by Distribution Channel 2020 & 2033
- Table 4: Global Protein Water Industry Volume liter Forecast, by Distribution Channel 2020 & 2033
- Table 5: Global Protein Water Industry Revenue Million Forecast, by Region 2020 & 2033
- Table 6: Global Protein Water Industry Volume liter Forecast, by Region 2020 & 2033
- Table 7: Global Protein Water Industry Revenue Million Forecast, by Type 2020 & 2033
- Table 8: Global Protein Water Industry Volume liter Forecast, by Type 2020 & 2033
- Table 9: Global Protein Water Industry Revenue Million Forecast, by Distribution Channel 2020 & 2033
- Table 10: Global Protein Water Industry Volume liter Forecast, by Distribution Channel 2020 & 2033
- Table 11: Global Protein Water Industry Revenue Million Forecast, by Country 2020 & 2033
- Table 12: Global Protein Water Industry Volume liter Forecast, by Country 2020 & 2033
- Table 13: United States Protein Water Industry Revenue (Million) Forecast, by Application 2020 & 2033
- Table 14: United States Protein Water Industry Volume (liter ) Forecast, by Application 2020 & 2033
- Table 15: Canada Protein Water Industry Revenue (Million) Forecast, by Application 2020 & 2033
- Table 16: Canada Protein Water Industry Volume (liter ) Forecast, by Application 2020 & 2033
- Table 17: Mexico Protein Water Industry Revenue (Million) Forecast, by Application 2020 & 2033
- Table 18: Mexico Protein Water Industry Volume (liter ) Forecast, by Application 2020 & 2033
- Table 19: Rest of North America Protein Water Industry Revenue (Million) Forecast, by Application 2020 & 2033
- Table 20: Rest of North America Protein Water Industry Volume (liter ) Forecast, by Application 2020 & 2033
- Table 21: Global Protein Water Industry Revenue Million Forecast, by Type 2020 & 2033
- Table 22: Global Protein Water Industry Volume liter Forecast, by Type 2020 & 2033
- Table 23: Global Protein Water Industry Revenue Million Forecast, by Distribution Channel 2020 & 2033
- Table 24: Global Protein Water Industry Volume liter Forecast, by Distribution Channel 2020 & 2033
- Table 25: Global Protein Water Industry Revenue Million Forecast, by Country 2020 & 2033
- Table 26: Global Protein Water Industry Volume liter Forecast, by Country 2020 & 2033
- Table 27: Spain Protein Water Industry Revenue (Million) Forecast, by Application 2020 & 2033
- Table 28: Spain Protein Water Industry Volume (liter ) Forecast, by Application 2020 & 2033
- Table 29: United Kingdom Protein Water Industry Revenue (Million) Forecast, by Application 2020 & 2033
- Table 30: United Kingdom Protein Water Industry Volume (liter ) Forecast, by Application 2020 & 2033
- Table 31: Germany Protein Water Industry Revenue (Million) Forecast, by Application 2020 & 2033
- Table 32: Germany Protein Water Industry Volume (liter ) Forecast, by Application 2020 & 2033
- Table 33: France Protein Water Industry Revenue (Million) Forecast, by Application 2020 & 2033
- Table 34: France Protein Water Industry Volume (liter ) Forecast, by Application 2020 & 2033
- Table 35: Italy Protein Water Industry Revenue (Million) Forecast, by Application 2020 & 2033
- Table 36: Italy Protein Water Industry Volume (liter ) Forecast, by Application 2020 & 2033
- Table 37: Russia Protein Water Industry Revenue (Million) Forecast, by Application 2020 & 2033
- Table 38: Russia Protein Water Industry Volume (liter ) Forecast, by Application 2020 & 2033
- Table 39: Rest of Europe Protein Water Industry Revenue (Million) Forecast, by Application 2020 & 2033
- Table 40: Rest of Europe Protein Water Industry Volume (liter ) Forecast, by Application 2020 & 2033
- Table 41: Global Protein Water Industry Revenue Million Forecast, by Type 2020 & 2033
- Table 42: Global Protein Water Industry Volume liter Forecast, by Type 2020 & 2033
- Table 43: Global Protein Water Industry Revenue Million Forecast, by Distribution Channel 2020 & 2033
- Table 44: Global Protein Water Industry Volume liter Forecast, by Distribution Channel 2020 & 2033
- Table 45: Global Protein Water Industry Revenue Million Forecast, by Country 2020 & 2033
- Table 46: Global Protein Water Industry Volume liter Forecast, by Country 2020 & 2033
- Table 47: China Protein Water Industry Revenue (Million) Forecast, by Application 2020 & 2033
- Table 48: China Protein Water Industry Volume (liter ) Forecast, by Application 2020 & 2033
- Table 49: Japan Protein Water Industry Revenue (Million) Forecast, by Application 2020 & 2033
- Table 50: Japan Protein Water Industry Volume (liter ) Forecast, by Application 2020 & 2033
- Table 51: India Protein Water Industry Revenue (Million) Forecast, by Application 2020 & 2033
- Table 52: India Protein Water Industry Volume (liter ) Forecast, by Application 2020 & 2033
- Table 53: Australia Protein Water Industry Revenue (Million) Forecast, by Application 2020 & 2033
- Table 54: Australia Protein Water Industry Volume (liter ) Forecast, by Application 2020 & 2033
- Table 55: Rest of Asia Pacific Protein Water Industry Revenue (Million) Forecast, by Application 2020 & 2033
- Table 56: Rest of Asia Pacific Protein Water Industry Volume (liter ) Forecast, by Application 2020 & 2033
- Table 57: Global Protein Water Industry Revenue Million Forecast, by Type 2020 & 2033
- Table 58: Global Protein Water Industry Volume liter Forecast, by Type 2020 & 2033
- Table 59: Global Protein Water Industry Revenue Million Forecast, by Distribution Channel 2020 & 2033
- Table 60: Global Protein Water Industry Volume liter Forecast, by Distribution Channel 2020 & 2033
- Table 61: Global Protein Water Industry Revenue Million Forecast, by Country 2020 & 2033
- Table 62: Global Protein Water Industry Volume liter Forecast, by Country 2020 & 2033
- Table 63: Brazil Protein Water Industry Revenue (Million) Forecast, by Application 2020 & 2033
- Table 64: Brazil Protein Water Industry Volume (liter ) Forecast, by Application 2020 & 2033
- Table 65: Argentina Protein Water Industry Revenue (Million) Forecast, by Application 2020 & 2033
- Table 66: Argentina Protein Water Industry Volume (liter ) Forecast, by Application 2020 & 2033
- Table 67: Rest of South America Protein Water Industry Revenue (Million) Forecast, by Application 2020 & 2033
- Table 68: Rest of South America Protein Water Industry Volume (liter ) Forecast, by Application 2020 & 2033
- Table 69: Global Protein Water Industry Revenue Million Forecast, by Type 2020 & 2033
- Table 70: Global Protein Water Industry Volume liter Forecast, by Type 2020 & 2033
- Table 71: Global Protein Water Industry Revenue Million Forecast, by Distribution Channel 2020 & 2033
- Table 72: Global Protein Water Industry Volume liter Forecast, by Distribution Channel 2020 & 2033
- Table 73: Global Protein Water Industry Revenue Million Forecast, by Country 2020 & 2033
- Table 74: Global Protein Water Industry Volume liter Forecast, by Country 2020 & 2033
- Table 75: South Africa Protein Water Industry Revenue (Million) Forecast, by Application 2020 & 2033
- Table 76: South Africa Protein Water Industry Volume (liter ) Forecast, by Application 2020 & 2033
- Table 77: Saudi Arabia Protein Water Industry Revenue (Million) Forecast, by Application 2020 & 2033
- Table 78: Saudi Arabia Protein Water Industry Volume (liter ) Forecast, by Application 2020 & 2033
- Table 79: Rest of Middle East and Africa Protein Water Industry Revenue (Million) Forecast, by Application 2020 & 2033
- Table 80: Rest of Middle East and Africa Protein Water Industry Volume (liter ) Forecast, by Application 2020 & 2033
Frequently Asked Questions
1. What is the projected Compound Annual Growth Rate (CAGR) of the Protein Water Industry?
The projected CAGR is approximately 5.50%.
2. Which companies are prominent players in the Protein Water Industry?
Key companies in the market include Arla Foods amba, Richmond Enterprises Holdings Limited (Bodiez Protein Water), Vyomax Nutrition Limited, Molecule Beverages Ltd, Miami Bay Beverage LLC (Trimino)*List Not Exhaustive, Aquatein, Fizzique LLC, Protein2o Inc, Agropur Inc (BiPro USA), Glanbia PLC (Optimum Nutrition Inc ).
3. What are the main segments of the Protein Water Industry?
The market segments include Type, Distribution Channel.
4. Can you provide details about the market size?
The market size is estimated to be USD 1187.1 Million as of 2022.
5. What are some drivers contributing to market growth?
Increasing awareness towards fitness among consumers; Demand for convenient fortified foods.
6. What are the notable trends driving market growth?
Increased Participation in the Sports Activities.
7. Are there any restraints impacting market growth?
Increasing vegan culture in the market.
8. Can you provide examples of recent developments in the market?
In July 2022, Mumbai-based Aquatein (Athlex Beverages Private Limited), India's first protein water brand launched three new products. Through its strategic offline partnerships, the brand is all set to roll out 1200 direct points of sales and also launch the brand internationally through strategic local partnerships in the Middle East and North Africa (MENA) region.
9. What pricing options are available for accessing the report?
Pricing options include single-user, multi-user, and enterprise licenses priced at USD 4750, USD 5250, and USD 8750 respectively.
10. Is the market size provided in terms of value or volume?
The market size is provided in terms of value, measured in Million and volume, measured in liter .
11. Are there any specific market keywords associated with the report?
Yes, the market keyword associated with the report is "Protein Water Industry," which aids in identifying and referencing the specific market segment covered.
12. How do I determine which pricing option suits my needs best?
The pricing options vary based on user requirements and access needs. Individual users may opt for single-user licenses, while businesses requiring broader access may choose multi-user or enterprise licenses for cost-effective access to the report.
13. Are there any additional resources or data provided in the Protein Water Industry report?
While the report offers comprehensive insights, it's advisable to review the specific contents or supplementary materials provided to ascertain if additional resources or data are available.
14. How can I stay updated on further developments or reports in the Protein Water Industry?
To stay informed about further developments, trends, and reports in the Protein Water Industry, consider subscribing to industry newsletters, following relevant companies and organizations, or regularly checking reputable industry news sources and publications.
Methodology
Step 1 - Identification of Relevant Samples Size from Population Database


Step 2 - Approaches for Defining Global Market Size (Value, Volume* & Price*)

Note*: In applicable scenarios
Step 3 - Data Sources
Primary Research
- Web Analytics
- Survey Reports
- Research Institute
- Latest Research Reports
- Opinion Leaders
Secondary Research
- Annual Reports
- White Paper
- Latest Press Release
- Industry Association
- Paid Database
- Investor Presentations

Step 4 - Data Triangulation
Involves using different sources of information in order to increase the validity of a study
These sources are likely to be stakeholders in a program - participants, other researchers, program staff, other community members, and so on.
Then we put all data in single framework & apply various statistical tools to find out the dynamic on the market.
During the analysis stage, feedback from the stakeholder groups would be compared to determine areas of agreement as well as areas of divergence