

Key Insights
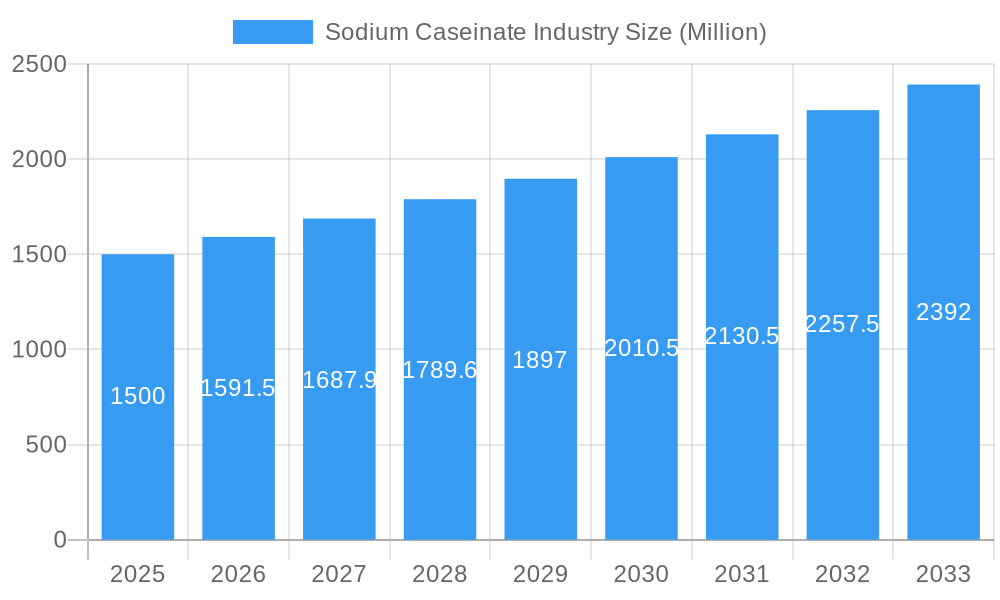
The global Sodium Caseinate market is poised for significant expansion, projected to reach an estimated USD 1.5 billion in 2025 and grow at a robust CAGR of 6.1% through 2033. This growth is primarily fueled by the increasing demand for high-quality protein ingredients across various industries, particularly in the food and beverage sector. Sodium caseinate, a versatile milk protein derivative, is highly valued for its emulsifying, stabilizing, and nutritional properties, making it an indispensable component in products ranging from dairy alternatives and processed foods to nutritional supplements and pharmaceuticals. The rising consumer awareness regarding the health benefits of protein, coupled with the expanding market for functional foods and specialized dietary products, will continue to drive demand. Furthermore, advancements in processing technologies are enhancing the quality and functionality of sodium caseinate, making it a preferred choice for manufacturers seeking to improve product texture, shelf-life, and nutritional profiles. The market's trajectory is also influenced by evolving consumer preferences towards natural and high-protein ingredients, further solidifying sodium caseinate's position.
Sodium Caseinate Industry Market Size (In Billion)
Key market dynamics shaping the sodium caseinate landscape include the burgeoning growth in emerging economies and the persistent innovation within the dairy processing industry. While factors such as raw material price volatility and stringent regulatory landscapes may present challenges, the overarching trend of increasing protein consumption globally, driven by health and wellness consciousness, acts as a powerful catalyst. The versatility of sodium caseinate allows its application in a wide array of products, from bakery goods and confectionery to infant formula and sports nutrition. Moreover, its use in pharmaceutical applications as an excipient and in dietary supplements for muscle recovery and satiety underscores its multifaceted utility. The competitive landscape is characterized by the presence of major global dairy processors and specialized ingredient manufacturers, all vying to capture market share through product innovation, strategic partnerships, and geographical expansion, particularly in the Asia Pacific region, which is expected to witness substantial growth.
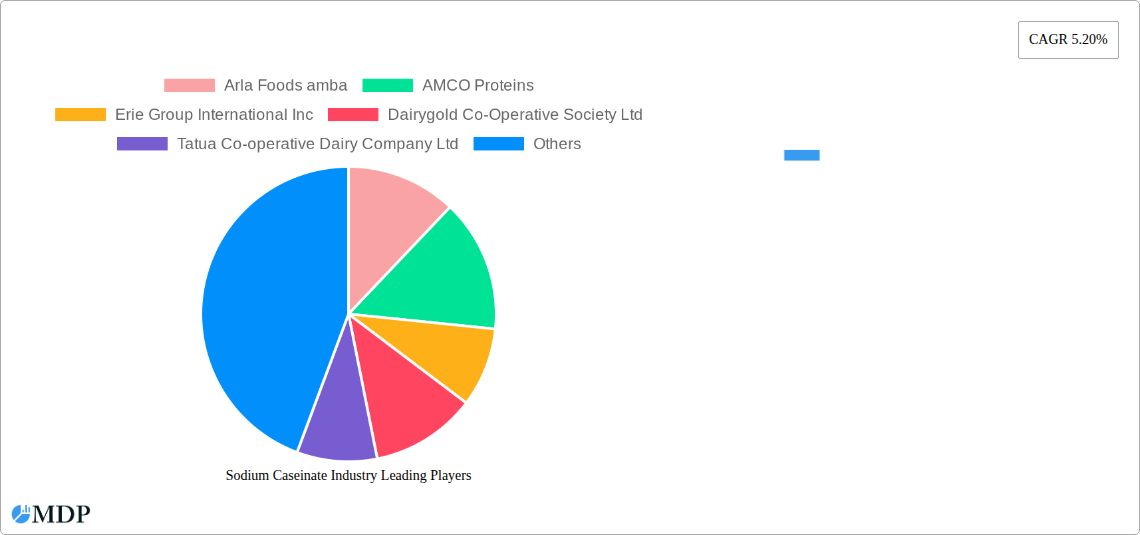
Sodium Caseinate Industry Company Market Share
Sodium Caseinate Industry Report: Market Dynamics, Trends, and Growth Projections (2019-2033)
This comprehensive report delves into the dynamic global Sodium Caseinate market, providing in-depth analysis and actionable insights for industry stakeholders. Spanning the historical period of 2019-2024, the base and estimated year of 2025, and a robust forecast period of 2025-2033, this study offers a definitive roadmap to navigating the evolving landscape of sodium caseinate production, applications, and market trends. With an estimated market valuation projected to reach billions by 2025, this report is indispensable for anyone seeking to understand the substantial growth opportunities and competitive forces at play. We meticulously examine market concentration, key growth drivers, leading segments, product innovations, challenges, and emerging opportunities, backed by detailed segmentation analysis across casein types, caseinate types, and diverse applications.
Sodium Caseinate Industry Market Dynamics & Concentration
The global Sodium Caseinate market exhibits a moderate to high concentration, with a few major players dominating a significant portion of the market share, estimated to be over 70% in 2025. Innovation drivers are primarily fueled by increasing demand for functional food ingredients, advancements in dairy processing technologies, and a growing focus on health and wellness. Regulatory frameworks, while crucial for ensuring product safety and quality, also present a nuanced challenge, with varying standards across different geographies impacting market entry and product formulation. Product substitutes, such as plant-based proteins and other dairy derivatives, are gaining traction but sodium caseinate continues to maintain a strong foothold due to its unique functional properties. End-user trends overwhelmingly point towards a rising preference for high-protein food and beverage products, coupled with a surge in the dietary supplements sector. Mergers and Acquisitions (M&A) activities are anticipated to remain a key strategy for market consolidation and expansion, with an estimated XX M&A deals expected between 2025 and 2033 to gain access to new markets, technologies, and product portfolios.
Sodium Caseinate Industry Industry Trends & Analysis
The Sodium Caseinate industry is experiencing robust growth, projected to achieve a Compound Annual Growth Rate (CAGR) of approximately X.XX% from 2025 to 2033. This expansion is fundamentally driven by the escalating global demand for high-protein food and beverage products. Consumers are increasingly prioritizing nutritional profiles, seeking ingredients that offer satiety, muscle support, and overall wellness benefits. Sodium caseinate, with its excellent emulsifying, stabilizing, and texturizing properties, perfectly aligns with these evolving consumer preferences, making it a staple in a wide array of food applications, from processed meats and baked goods to dairy alternatives and nutritional beverages. Technological disruptions in dairy processing are also playing a pivotal role, enabling more efficient extraction and refinement of caseinates, leading to improved product quality and cost-effectiveness. Furthermore, the growing awareness surrounding the health benefits of casein proteins, particularly their slow digestion rate which aids in sustained amino acid release, is further propelling market penetration in the dietary supplement and pharmaceutical sectors. Competitive dynamics are characterized by intense innovation in product development and a strategic focus on securing reliable supply chains. Companies are actively investing in research and development to enhance the functionality and expand the application range of sodium caseinate, while simultaneously working to mitigate the impact of raw material price volatility.
Leading Markets & Segments in Sodium Caseinate Industry
The Food and Beverage segment is the dominant application for sodium caseinate, accounting for an estimated XX% of the global market share in 2025. This segment's dominance is driven by the widespread use of sodium caseinate as a functional ingredient in a vast array of products, including:
- Dairy Products: Enhancing texture, stability, and mouthfeel in yogurts, cheeses, and ice creams.
- Bakery Products: Improving dough handling, volume, and shelf-life in bread, cakes, and pastries.
- Processed Meats: Acting as a binder and emulsifier, improving water-holding capacity and texture.
- Nutritional Beverages: Providing a smooth texture and enhancing protein content in ready-to-drink shakes and sports nutrition drinks.
Within the Caseinate Type segmentation, Sodium Caseinate itself holds the largest market share, driven by its versatility and cost-effectiveness.
Geographically, North America is expected to remain the leading market, projected to hold approximately XX% of the global market share in 2025. This dominance is attributed to:
- High Consumer Demand: A well-established consumer preference for protein-enriched foods and beverages.
- Developed Food Industry Infrastructure: A mature and sophisticated food manufacturing sector with advanced processing capabilities.
- Favorable Economic Conditions: Strong purchasing power and a willingness to invest in premium and functional food ingredients.
- Regulatory Support: Relatively stable and supportive regulatory frameworks for food ingredient approval and utilization.
The Dietary Supplements segment is also a significant growth area, driven by the increasing health consciousness and the rising popularity of protein supplements for fitness and general well-being.
Sodium Caseinate Industry Product Developments
Product developments in the sodium caseinate industry are increasingly focused on enhancing its functional properties and expanding its application spectrum. Innovations are geared towards creating specialized grades of sodium caseinate with improved emulsification, heat stability, and solubility for niche applications. Companies are also exploring the use of sodium caseinate in novel food formulations, such as plant-based meat alternatives and functional confectionery, aiming to replicate the texture and mouthfeel of traditional products. Competitive advantages are being built through the development of clean-label sodium caseinate products and the optimization of production processes to ensure high purity and consistent quality, meeting the stringent requirements of the pharmaceutical and dietary supplement industries.
Key Drivers of Sodium Caseinate Industry Growth
Several key factors are propelling the growth of the sodium caseinate industry. Technologically, advancements in dairy processing have led to more efficient and cost-effective methods for extracting and refining sodium caseinate, improving product quality and accessibility. Economically, the increasing global disposable income and a rising demand for convenience foods and health-focused products are significant drivers. Consumers are actively seeking ingredients that contribute to their well-being, making high-protein options like sodium caseinate increasingly attractive. Regulatory frameworks, while sometimes posing challenges, also provide a foundation for innovation by setting standards for product safety and efficacy, encouraging companies to invest in research and development to meet and exceed these benchmarks. The growing demand for specialized ingredients in the pharmaceutical and nutraceutical sectors further fuels expansion.
Challenges in the Sodium Caseinate Industry Market
The sodium caseinate industry faces several challenges that could impact its growth trajectory. Regulatory hurdles, including varying standards for food additives and ingredient labeling across different countries, can complicate market entry and expansion. Supply chain volatility, particularly concerning the availability and price of raw milk, can affect production costs and profit margins. Moreover, intense competitive pressures from alternative protein sources, both animal-derived and plant-based, necessitate continuous innovation and cost optimization to maintain market share. The potential for allergens associated with dairy products also requires careful consideration and clear communication to consumers.
Emerging Opportunities in Sodium Caseinate Industry
Emerging opportunities in the sodium caseinate industry are abundant and diverse. Technological breakthroughs in enzyme technology and fermentation processes are opening avenues for developing novel casein-based ingredients with enhanced functionalities and improved nutritional profiles. Strategic partnerships and collaborations between dairy cooperatives, ingredient manufacturers, and food product developers are crucial for unlocking new markets and co-creating innovative applications. Market expansion into developing economies, where the demand for processed foods and nutritional supplements is rapidly growing, presents significant long-term growth potential. The increasing consumer interest in traceability and sustainability in the food supply chain also presents an opportunity for companies to differentiate themselves by offering transparent and ethically sourced sodium caseinate.
Leading Players in the Sodium Caseinate Industry Sector
- Arla Foods amba
- AMCO Proteins
- Erie Group International Inc
- Dairygold Co-Operative Society Ltd
- Tatua Co-Operative Dairy Company Ltd
- Royal FrieslandCampina NV
- Kerry Group PLC
- Fonterra Co-operative Group Limited
- Glanbia PLC
- Groupe Lactalis
- Hoogwegt International BV
Key Milestones in Sodium Caseinate Industry Industry
- May 2022: Fonterra launched a new online dairy platform that makes it easier for customers to choose dairy ingredients ranging from milk powder to specialty dairy proteins.
- January 2022: To sell the milk powders and cream made by Royal A-ware, Hoogwegt and Royal A-ware formed a long-term, strategic partnership. The alliance is intended to boost the businesses' core operations.
- March 2021: FrieslandCampina announced the launch of a new portfolio created to assist owners and formulators of sports nutrition brands in enhancing and expanding their protein bar formulas. The newly launched solutions included four product concepts and six dairy-derived ingredients. The company's new bar solutions contain the following ingredients: BiotisTM GOS, Excellion EM 9, Nutri WheyTM 800F, Excellion Calcium Caseinate S, and Nutri WheyTM Isolate.
Strategic Outlook for Sodium Caseinate Industry Market
The strategic outlook for the sodium caseinate industry is exceptionally positive, with continued growth anticipated due to persistent demand for protein-rich ingredients and functional food solutions. Future market potential will be significantly shaped by ongoing innovations in product development, focusing on enhanced nutritional value and specialized functionalities for applications in sports nutrition, weight management, and medical foods. Companies that prioritize supply chain resilience, invest in sustainable sourcing practices, and actively pursue strategic partnerships will be best positioned to capitalize on emerging opportunities. The global expansion into untapped markets, particularly in Asia-Pacific and Latin America, alongside the development of clean-label and allergen-free variants, will be critical growth accelerators.
Sodium Caseinate Industry Segmentation
-
1. Casein Type
- 1.1. Rennet Casein
- 1.2. Acid Casein
-
2. Caseinate Type
- 2.1. Calcium
- 2.2. Potassium
- 2.3. Sodium
- 2.4. Other Caseinate Types
-
3. Application
- 3.1. Food and Beverage
- 3.2. Dietary Supplements
- 3.3. Pharmaceuticals
- 3.4. Other Applications
Sodium Caseinate Industry Segmentation By Geography
-
1. North America
- 1.1. United States
- 1.2. Canada
- 1.3. Mexico
- 1.4. Rest of North America
-
2. Europe
- 2.1. Spain
- 2.2. United Kingdom
- 2.3. Germany
- 2.4. France
- 2.5. Italy
- 2.6. Russia
- 2.7. Rest of Europe
-
3. Asia Pacific
- 3.1. China
- 3.2. Japan
- 3.3. India
- 3.4. Australia
- 3.5. Rest of Asia Pacific
-
4. South America
- 4.1. Brazil
- 4.2. Argentina
- 4.3. Rest of South America
-
5. Middle East and Africa
- 5.1. South Africa
- 5.2. Saudi Arabia
- 5.3. Rest of Middle East and Africa
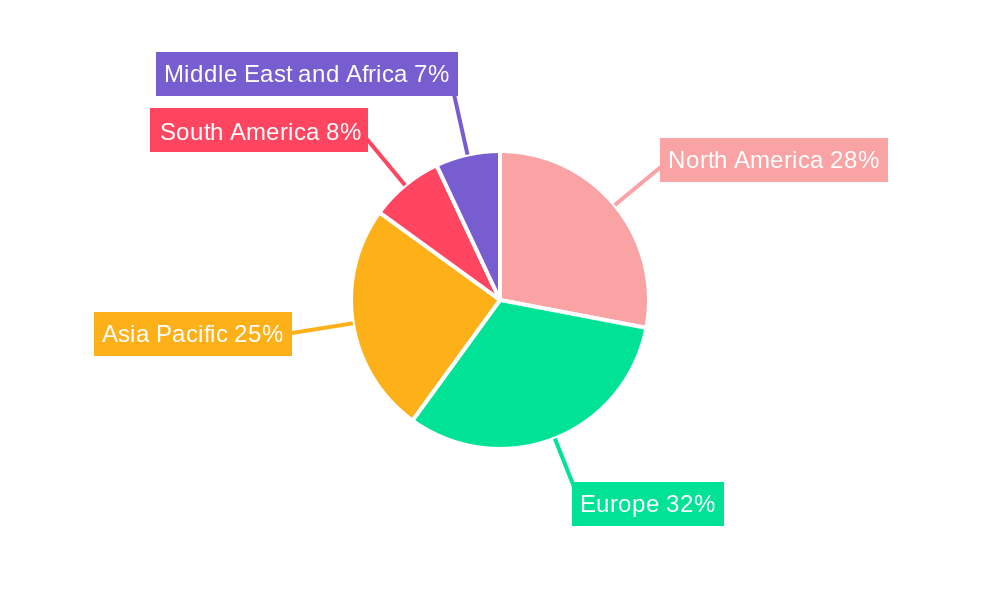
Sodium Caseinate Industry Regional Market Share
Geographic Coverage of Sodium Caseinate Industry
Sodium Caseinate Industry REPORT HIGHLIGHTS
| Aspects | Details |
|---|---|
| Study Period | 2020-2034 |
| Base Year | 2025 |
| Estimated Year | 2026 |
| Forecast Period | 2026-2034 |
| Historical Period | 2020-2025 |
| Growth Rate | CAGR of 4.8% from 2020-2034 |
| Segmentation |
|
Table of Contents
- 1. Introduction
- 1.1. Research Scope
- 1.2. Market Segmentation
- 1.3. Research Objective
- 1.4. Definitions and Assumptions
- 2. Executive Summary
- 2.1. Market Snapshot
- 3. Market Dynamics
- 3.1. Market Drivers
- 3.2. Market Restrains
- 3.3. Market Trends
- 3.4. Market Opportunities
- 4. Market Factor Analysis
- 4.1. Porters Five Forces
- 4.1.1. Bargaining Power of Suppliers
- 4.1.2. Bargaining Power of Buyers
- 4.1.3. Threat of New Entrants
- 4.1.4. Threat of Substitutes
- 4.1.5. Competitive Rivalry
- 4.2. PESTEL analysis
- 4.3. BCG Analysis
- 4.3.1. Stars (High Growth, High Market Share)
- 4.3.2. Cash Cows (Low Growth, High Market Share)
- 4.3.3. Question Mark (High Growth, Low Market Share)
- 4.3.4. Dogs (Low Growth, Low Market Share)
- 4.4. Ansoff Matrix Analysis
- 4.5. Supply Chain Analysis
- 4.6. Regulatory Landscape
- 4.7. Current Market Potential and Opportunity Assessment (TAM–SAM–SOM Framework)
- 4.8. MDP Analyst Note
- 4.1. Porters Five Forces
- 5. Market Analysis, Insights and Forecast 2021-2033
- 5.1. Market Analysis, Insights and Forecast - by Casein Type
- 5.1.1. Rennet Casein
- 5.1.2. Acid Casein
- 5.2. Market Analysis, Insights and Forecast - by Caseinate Type
- 5.2.1. Calcium
- 5.2.2. Potassium
- 5.2.3. Sodium
- 5.2.4. Other Caseinate Types
- 5.3. Market Analysis, Insights and Forecast - by Application
- 5.3.1. Food and Beverage
- 5.3.2. Dietary Supplements
- 5.3.3. Pharmaceuticals
- 5.3.4. Other Applications
- 5.4. Market Analysis, Insights and Forecast - by Region
- 5.4.1. North America
- 5.4.2. Europe
- 5.4.3. Asia Pacific
- 5.4.4. South America
- 5.4.5. Middle East and Africa
- 5.1. Market Analysis, Insights and Forecast - by Casein Type
- 6. Global Sodium Caseinate Industry Analysis, Insights and Forecast, 2021-2033
- 6.1. Market Analysis, Insights and Forecast - by Casein Type
- 6.1.1. Rennet Casein
- 6.1.2. Acid Casein
- 6.2. Market Analysis, Insights and Forecast - by Caseinate Type
- 6.2.1. Calcium
- 6.2.2. Potassium
- 6.2.3. Sodium
- 6.2.4. Other Caseinate Types
- 6.3. Market Analysis, Insights and Forecast - by Application
- 6.3.1. Food and Beverage
- 6.3.2. Dietary Supplements
- 6.3.3. Pharmaceuticals
- 6.3.4. Other Applications
- 6.1. Market Analysis, Insights and Forecast - by Casein Type
- 7. North America Sodium Caseinate Industry Analysis, Insights and Forecast, 2020-2032
- 7.1. Market Analysis, Insights and Forecast - by Casein Type
- 7.1.1. Rennet Casein
- 7.1.2. Acid Casein
- 7.2. Market Analysis, Insights and Forecast - by Caseinate Type
- 7.2.1. Calcium
- 7.2.2. Potassium
- 7.2.3. Sodium
- 7.2.4. Other Caseinate Types
- 7.3. Market Analysis, Insights and Forecast - by Application
- 7.3.1. Food and Beverage
- 7.3.2. Dietary Supplements
- 7.3.3. Pharmaceuticals
- 7.3.4. Other Applications
- 7.1. Market Analysis, Insights and Forecast - by Casein Type
- 8. Europe Sodium Caseinate Industry Analysis, Insights and Forecast, 2020-2032
- 8.1. Market Analysis, Insights and Forecast - by Casein Type
- 8.1.1. Rennet Casein
- 8.1.2. Acid Casein
- 8.2. Market Analysis, Insights and Forecast - by Caseinate Type
- 8.2.1. Calcium
- 8.2.2. Potassium
- 8.2.3. Sodium
- 8.2.4. Other Caseinate Types
- 8.3. Market Analysis, Insights and Forecast - by Application
- 8.3.1. Food and Beverage
- 8.3.2. Dietary Supplements
- 8.3.3. Pharmaceuticals
- 8.3.4. Other Applications
- 8.1. Market Analysis, Insights and Forecast - by Casein Type
- 9. Asia Pacific Sodium Caseinate Industry Analysis, Insights and Forecast, 2020-2032
- 9.1. Market Analysis, Insights and Forecast - by Casein Type
- 9.1.1. Rennet Casein
- 9.1.2. Acid Casein
- 9.2. Market Analysis, Insights and Forecast - by Caseinate Type
- 9.2.1. Calcium
- 9.2.2. Potassium
- 9.2.3. Sodium
- 9.2.4. Other Caseinate Types
- 9.3. Market Analysis, Insights and Forecast - by Application
- 9.3.1. Food and Beverage
- 9.3.2. Dietary Supplements
- 9.3.3. Pharmaceuticals
- 9.3.4. Other Applications
- 9.1. Market Analysis, Insights and Forecast - by Casein Type
- 10. South America Sodium Caseinate Industry Analysis, Insights and Forecast, 2020-2032
- 10.1. Market Analysis, Insights and Forecast - by Casein Type
- 10.1.1. Rennet Casein
- 10.1.2. Acid Casein
- 10.2. Market Analysis, Insights and Forecast - by Caseinate Type
- 10.2.1. Calcium
- 10.2.2. Potassium
- 10.2.3. Sodium
- 10.2.4. Other Caseinate Types
- 10.3. Market Analysis, Insights and Forecast - by Application
- 10.3.1. Food and Beverage
- 10.3.2. Dietary Supplements
- 10.3.3. Pharmaceuticals
- 10.3.4. Other Applications
- 10.1. Market Analysis, Insights and Forecast - by Casein Type
- 11. Middle East and Africa Sodium Caseinate Industry Analysis, Insights and Forecast, 2020-2032
- 11.1. Market Analysis, Insights and Forecast - by Casein Type
- 11.1.1. Rennet Casein
- 11.1.2. Acid Casein
- 11.2. Market Analysis, Insights and Forecast - by Caseinate Type
- 11.2.1. Calcium
- 11.2.2. Potassium
- 11.2.3. Sodium
- 11.2.4. Other Caseinate Types
- 11.3. Market Analysis, Insights and Forecast - by Application
- 11.3.1. Food and Beverage
- 11.3.2. Dietary Supplements
- 11.3.3. Pharmaceuticals
- 11.3.4. Other Applications
- 11.1. Market Analysis, Insights and Forecast - by Casein Type
- 12. Competitive Analysis
- 12.1. Company Profiles
- 12.1.1 Arla Foods amba
- 12.1.1.1. Company Overview
- 12.1.1.2. Products
- 12.1.1.3. Company Financials
- 12.1.1.4. SWOT Analysis
- 12.1.2 AMCO Proteins
- 12.1.2.1. Company Overview
- 12.1.2.2. Products
- 12.1.2.3. Company Financials
- 12.1.2.4. SWOT Analysis
- 12.1.3 Erie Group International Inc
- 12.1.3.1. Company Overview
- 12.1.3.2. Products
- 12.1.3.3. Company Financials
- 12.1.3.4. SWOT Analysis
- 12.1.4 Dairygold Co-Operative Society Ltd
- 12.1.4.1. Company Overview
- 12.1.4.2. Products
- 12.1.4.3. Company Financials
- 12.1.4.4. SWOT Analysis
- 12.1.5 Tatua Co-operative Dairy Company Ltd
- 12.1.5.1. Company Overview
- 12.1.5.2. Products
- 12.1.5.3. Company Financials
- 12.1.5.4. SWOT Analysis
- 12.1.6 Royal FrieslandCampina NV
- 12.1.6.1. Company Overview
- 12.1.6.2. Products
- 12.1.6.3. Company Financials
- 12.1.6.4. SWOT Analysis
- 12.1.7 Kerry Group PLC
- 12.1.7.1. Company Overview
- 12.1.7.2. Products
- 12.1.7.3. Company Financials
- 12.1.7.4. SWOT Analysis
- 12.1.8 Fonterra Co-operative Group Limited
- 12.1.8.1. Company Overview
- 12.1.8.2. Products
- 12.1.8.3. Company Financials
- 12.1.8.4. SWOT Analysis
- 12.1.9 Glanbia PLC*List Not Exhaustive
- 12.1.9.1. Company Overview
- 12.1.9.2. Products
- 12.1.9.3. Company Financials
- 12.1.9.4. SWOT Analysis
- 12.1.10 Groupe Lactalis
- 12.1.10.1. Company Overview
- 12.1.10.2. Products
- 12.1.10.3. Company Financials
- 12.1.10.4. SWOT Analysis
- 12.1.11 Hoogwegt International BV
- 12.1.11.1. Company Overview
- 12.1.11.2. Products
- 12.1.11.3. Company Financials
- 12.1.11.4. SWOT Analysis
- 12.1.1 Arla Foods amba
- 12.2. Market Entropy
- 12.2.1 Company's Key Areas Served
- 12.2.2 Recent Developments
- 12.3. Company Market Share Analysis 2025
- 12.3.1 Top 5 Companies Market Share Analysis
- 12.3.2 Top 3 Companies Market Share Analysis
- 12.4. List of Potential Customers
- 13. Research Methodology
List of Figures
- Figure 1: Global Sodium Caseinate Industry Revenue Breakdown (billion, %) by Region 2025 & 2033
- Figure 2: North America Sodium Caseinate Industry Revenue (billion), by Casein Type 2025 & 2033
- Figure 3: North America Sodium Caseinate Industry Revenue Share (%), by Casein Type 2025 & 2033
- Figure 4: North America Sodium Caseinate Industry Revenue (billion), by Caseinate Type 2025 & 2033
- Figure 5: North America Sodium Caseinate Industry Revenue Share (%), by Caseinate Type 2025 & 2033
- Figure 6: North America Sodium Caseinate Industry Revenue (billion), by Application 2025 & 2033
- Figure 7: North America Sodium Caseinate Industry Revenue Share (%), by Application 2025 & 2033
- Figure 8: North America Sodium Caseinate Industry Revenue (billion), by Country 2025 & 2033
- Figure 9: North America Sodium Caseinate Industry Revenue Share (%), by Country 2025 & 2033
- Figure 10: Europe Sodium Caseinate Industry Revenue (billion), by Casein Type 2025 & 2033
- Figure 11: Europe Sodium Caseinate Industry Revenue Share (%), by Casein Type 2025 & 2033
- Figure 12: Europe Sodium Caseinate Industry Revenue (billion), by Caseinate Type 2025 & 2033
- Figure 13: Europe Sodium Caseinate Industry Revenue Share (%), by Caseinate Type 2025 & 2033
- Figure 14: Europe Sodium Caseinate Industry Revenue (billion), by Application 2025 & 2033
- Figure 15: Europe Sodium Caseinate Industry Revenue Share (%), by Application 2025 & 2033
- Figure 16: Europe Sodium Caseinate Industry Revenue (billion), by Country 2025 & 2033
- Figure 17: Europe Sodium Caseinate Industry Revenue Share (%), by Country 2025 & 2033
- Figure 18: Asia Pacific Sodium Caseinate Industry Revenue (billion), by Casein Type 2025 & 2033
- Figure 19: Asia Pacific Sodium Caseinate Industry Revenue Share (%), by Casein Type 2025 & 2033
- Figure 20: Asia Pacific Sodium Caseinate Industry Revenue (billion), by Caseinate Type 2025 & 2033
- Figure 21: Asia Pacific Sodium Caseinate Industry Revenue Share (%), by Caseinate Type 2025 & 2033
- Figure 22: Asia Pacific Sodium Caseinate Industry Revenue (billion), by Application 2025 & 2033
- Figure 23: Asia Pacific Sodium Caseinate Industry Revenue Share (%), by Application 2025 & 2033
- Figure 24: Asia Pacific Sodium Caseinate Industry Revenue (billion), by Country 2025 & 2033
- Figure 25: Asia Pacific Sodium Caseinate Industry Revenue Share (%), by Country 2025 & 2033
- Figure 26: South America Sodium Caseinate Industry Revenue (billion), by Casein Type 2025 & 2033
- Figure 27: South America Sodium Caseinate Industry Revenue Share (%), by Casein Type 2025 & 2033
- Figure 28: South America Sodium Caseinate Industry Revenue (billion), by Caseinate Type 2025 & 2033
- Figure 29: South America Sodium Caseinate Industry Revenue Share (%), by Caseinate Type 2025 & 2033
- Figure 30: South America Sodium Caseinate Industry Revenue (billion), by Application 2025 & 2033
- Figure 31: South America Sodium Caseinate Industry Revenue Share (%), by Application 2025 & 2033
- Figure 32: South America Sodium Caseinate Industry Revenue (billion), by Country 2025 & 2033
- Figure 33: South America Sodium Caseinate Industry Revenue Share (%), by Country 2025 & 2033
- Figure 34: Middle East and Africa Sodium Caseinate Industry Revenue (billion), by Casein Type 2025 & 2033
- Figure 35: Middle East and Africa Sodium Caseinate Industry Revenue Share (%), by Casein Type 2025 & 2033
- Figure 36: Middle East and Africa Sodium Caseinate Industry Revenue (billion), by Caseinate Type 2025 & 2033
- Figure 37: Middle East and Africa Sodium Caseinate Industry Revenue Share (%), by Caseinate Type 2025 & 2033
- Figure 38: Middle East and Africa Sodium Caseinate Industry Revenue (billion), by Application 2025 & 2033
- Figure 39: Middle East and Africa Sodium Caseinate Industry Revenue Share (%), by Application 2025 & 2033
- Figure 40: Middle East and Africa Sodium Caseinate Industry Revenue (billion), by Country 2025 & 2033
- Figure 41: Middle East and Africa Sodium Caseinate Industry Revenue Share (%), by Country 2025 & 2033
List of Tables
- Table 1: Global Sodium Caseinate Industry Revenue billion Forecast, by Casein Type 2020 & 2033
- Table 2: Global Sodium Caseinate Industry Revenue billion Forecast, by Caseinate Type 2020 & 2033
- Table 3: Global Sodium Caseinate Industry Revenue billion Forecast, by Application 2020 & 2033
- Table 4: Global Sodium Caseinate Industry Revenue billion Forecast, by Region 2020 & 2033
- Table 5: Global Sodium Caseinate Industry Revenue billion Forecast, by Casein Type 2020 & 2033
- Table 6: Global Sodium Caseinate Industry Revenue billion Forecast, by Caseinate Type 2020 & 2033
- Table 7: Global Sodium Caseinate Industry Revenue billion Forecast, by Application 2020 & 2033
- Table 8: Global Sodium Caseinate Industry Revenue billion Forecast, by Country 2020 & 2033
- Table 9: United States Sodium Caseinate Industry Revenue (billion) Forecast, by Application 2020 & 2033
- Table 10: Canada Sodium Caseinate Industry Revenue (billion) Forecast, by Application 2020 & 2033
- Table 11: Mexico Sodium Caseinate Industry Revenue (billion) Forecast, by Application 2020 & 2033
- Table 12: Rest of North America Sodium Caseinate Industry Revenue (billion) Forecast, by Application 2020 & 2033
- Table 13: Global Sodium Caseinate Industry Revenue billion Forecast, by Casein Type 2020 & 2033
- Table 14: Global Sodium Caseinate Industry Revenue billion Forecast, by Caseinate Type 2020 & 2033
- Table 15: Global Sodium Caseinate Industry Revenue billion Forecast, by Application 2020 & 2033
- Table 16: Global Sodium Caseinate Industry Revenue billion Forecast, by Country 2020 & 2033
- Table 17: Spain Sodium Caseinate Industry Revenue (billion) Forecast, by Application 2020 & 2033
- Table 18: United Kingdom Sodium Caseinate Industry Revenue (billion) Forecast, by Application 2020 & 2033
- Table 19: Germany Sodium Caseinate Industry Revenue (billion) Forecast, by Application 2020 & 2033
- Table 20: France Sodium Caseinate Industry Revenue (billion) Forecast, by Application 2020 & 2033
- Table 21: Italy Sodium Caseinate Industry Revenue (billion) Forecast, by Application 2020 & 2033
- Table 22: Russia Sodium Caseinate Industry Revenue (billion) Forecast, by Application 2020 & 2033
- Table 23: Rest of Europe Sodium Caseinate Industry Revenue (billion) Forecast, by Application 2020 & 2033
- Table 24: Global Sodium Caseinate Industry Revenue billion Forecast, by Casein Type 2020 & 2033
- Table 25: Global Sodium Caseinate Industry Revenue billion Forecast, by Caseinate Type 2020 & 2033
- Table 26: Global Sodium Caseinate Industry Revenue billion Forecast, by Application 2020 & 2033
- Table 27: Global Sodium Caseinate Industry Revenue billion Forecast, by Country 2020 & 2033
- Table 28: China Sodium Caseinate Industry Revenue (billion) Forecast, by Application 2020 & 2033
- Table 29: Japan Sodium Caseinate Industry Revenue (billion) Forecast, by Application 2020 & 2033
- Table 30: India Sodium Caseinate Industry Revenue (billion) Forecast, by Application 2020 & 2033
- Table 31: Australia Sodium Caseinate Industry Revenue (billion) Forecast, by Application 2020 & 2033
- Table 32: Rest of Asia Pacific Sodium Caseinate Industry Revenue (billion) Forecast, by Application 2020 & 2033
- Table 33: Global Sodium Caseinate Industry Revenue billion Forecast, by Casein Type 2020 & 2033
- Table 34: Global Sodium Caseinate Industry Revenue billion Forecast, by Caseinate Type 2020 & 2033
- Table 35: Global Sodium Caseinate Industry Revenue billion Forecast, by Application 2020 & 2033
- Table 36: Global Sodium Caseinate Industry Revenue billion Forecast, by Country 2020 & 2033
- Table 37: Brazil Sodium Caseinate Industry Revenue (billion) Forecast, by Application 2020 & 2033
- Table 38: Argentina Sodium Caseinate Industry Revenue (billion) Forecast, by Application 2020 & 2033
- Table 39: Rest of South America Sodium Caseinate Industry Revenue (billion) Forecast, by Application 2020 & 2033
- Table 40: Global Sodium Caseinate Industry Revenue billion Forecast, by Casein Type 2020 & 2033
- Table 41: Global Sodium Caseinate Industry Revenue billion Forecast, by Caseinate Type 2020 & 2033
- Table 42: Global Sodium Caseinate Industry Revenue billion Forecast, by Application 2020 & 2033
- Table 43: Global Sodium Caseinate Industry Revenue billion Forecast, by Country 2020 & 2033
- Table 44: South Africa Sodium Caseinate Industry Revenue (billion) Forecast, by Application 2020 & 2033
- Table 45: Saudi Arabia Sodium Caseinate Industry Revenue (billion) Forecast, by Application 2020 & 2033
- Table 46: Rest of Middle East and Africa Sodium Caseinate Industry Revenue (billion) Forecast, by Application 2020 & 2033
Frequently Asked Questions
1. What is the projected Compound Annual Growth Rate (CAGR) of the Sodium Caseinate Industry?
The projected CAGR is approximately 4.8%.
2. Which companies are prominent players in the Sodium Caseinate Industry?
Key companies in the market include Arla Foods amba, AMCO Proteins, Erie Group International Inc, Dairygold Co-Operative Society Ltd, Tatua Co-operative Dairy Company Ltd, Royal FrieslandCampina NV, Kerry Group PLC, Fonterra Co-operative Group Limited, Glanbia PLC*List Not Exhaustive, Groupe Lactalis, Hoogwegt International BV.
3. What are the main segments of the Sodium Caseinate Industry?
The market segments include Casein Type, Caseinate Type, Application.
4. Can you provide details about the market size?
The market size is estimated to be USD 5.3 billion as of 2022.
5. What are some drivers contributing to market growth?
Health Benefits Promoting Apple Cider Vinegar Demand; Unfiltered Apple Cider Vinegar Being Popular.
6. What are the notable trends driving market growth?
Increasing Application of Casein and Caseinates in Protein-rich Food Products.
7. Are there any restraints impacting market growth?
Rising Demand for Other Vinegar Types.
8. Can you provide examples of recent developments in the market?
May 2022: Fonterra launched a new online dairy platform that makes it easier for customers to choose dairy ingredients ranging from milk powder to specialty dairy proteins.
9. What pricing options are available for accessing the report?
Pricing options include single-user, multi-user, and enterprise licenses priced at USD 4750, USD 5250, and USD 8750 respectively.
10. Is the market size provided in terms of value or volume?
The market size is provided in terms of value, measured in billion.
11. Are there any specific market keywords associated with the report?
Yes, the market keyword associated with the report is "Sodium Caseinate Industry," which aids in identifying and referencing the specific market segment covered.
12. How do I determine which pricing option suits my needs best?
The pricing options vary based on user requirements and access needs. Individual users may opt for single-user licenses, while businesses requiring broader access may choose multi-user or enterprise licenses for cost-effective access to the report.
13. Are there any additional resources or data provided in the Sodium Caseinate Industry report?
While the report offers comprehensive insights, it's advisable to review the specific contents or supplementary materials provided to ascertain if additional resources or data are available.
14. How can I stay updated on further developments or reports in the Sodium Caseinate Industry?
To stay informed about further developments, trends, and reports in the Sodium Caseinate Industry, consider subscribing to industry newsletters, following relevant companies and organizations, or regularly checking reputable industry news sources and publications.
Methodology
Step 1 - Identification of Relevant Samples Size from Population Database


Step 2 - Approaches for Defining Global Market Size (Value, Volume* & Price*)

Note*: In applicable scenarios
Step 3 - Data Sources
Primary Research
- Web Analytics
- Survey Reports
- Research Institute
- Latest Research Reports
- Opinion Leaders
Secondary Research
- Annual Reports
- White Paper
- Latest Press Release
- Industry Association
- Paid Database
- Investor Presentations

Step 4 - Data Triangulation
Involves using different sources of information in order to increase the validity of a study
These sources are likely to be stakeholders in a program - participants, other researchers, program staff, other community members, and so on.
Then we put all data in single framework & apply various statistical tools to find out the dynamic on the market.
During the analysis stage, feedback from the stakeholder groups would be compared to determine areas of agreement as well as areas of divergence