

Key Insights
The global Food Grade Ethanol market is poised for significant expansion, projected to reach USD 3.75 billion by 2025, driven by a robust Compound Annual Growth Rate (CAGR) of 7.5% throughout the forecast period of 2025-2033. This impressive growth trajectory is underpinned by several key factors, prominently including the escalating demand for natural and high-quality ingredients across the food and beverage sector, alongside a burgeoning consumer preference for healthier dietary choices, leading to increased adoption of food-grade ethanol in nutritional supplements. Furthermore, the versatility of food-grade ethanol as a solvent, preservative, and flavoring agent in a wide array of food products, from baked goods and confectionery to sauces and seasonings, continues to fuel its market penetration. The expanding global food processing industry, coupled with technological advancements in ethanol production, are also contributing to this positive market outlook.

Food Grade Ethanol Industry Market Size (In Billion)
While the market demonstrates strong growth potential, certain challenges warrant attention. Stringent regulatory frameworks governing the use of food-grade ethanol in different regions can present hurdles for market participants in terms of compliance and product development. Fluctuations in the prices of raw materials, particularly agricultural commodities like corn and sugarcane, can impact production costs and consequently influence market pricing dynamics. However, the persistent innovation in bio-based ethanol production and the development of more sustainable sourcing practices are expected to mitigate some of these restraints. Key players such as Cargill Incorporated, Archer Daniels Midland Company, and Roquette Freres are actively investing in research and development to enhance product offerings and expand their market reach, further solidifying the market's growth trajectory. The expanding applications in functional foods and beverages also present a promising avenue for future market expansion.

Food Grade Ethanol Industry Company Market Share
This in-depth report provides an exhaustive analysis of the Food Grade Ethanol Industry, a critical sector supporting the global food, beverage, and dietary supplement markets. With an estimated market size projected to reach billions by 2033, this report delves into the intricate dynamics, key trends, and future outlook of this burgeoning industry. Covering the historical period from 2019 to 2024 and a forecast period extending to 2033, with a base and estimated year of 2025, this study offers unparalleled insights for industry stakeholders, investors, and strategic planners.
Food Grade Ethanol Industry Market Dynamics & Concentration
The Food Grade Ethanol Industry is characterized by a moderate to high concentration, with key players like Cargill Incorporated, MGP, Manildra Group, and Archer Daniels Midland Company holding significant market shares, estimated in the billions of dollars. Innovation remains a primary driver, with continuous investment in advanced distillation techniques and feedstock diversification. Regulatory frameworks, particularly around purity standards and sustainability, play a crucial role in shaping market entry and operational strategies. Product substitutes, such as certain artificial flavorings and preservatives, present a minor challenge, though the natural appeal and versatility of food-grade ethanol ensure its continued demand. End-user trends point towards a growing preference for naturally derived ingredients and functional food and beverage products, directly benefiting the demand for high-quality food-grade ethanol. Merger and acquisition (M&A) activities, while not currently at an all-time high, are anticipated to increase as larger players seek to consolidate market positions and expand their product portfolios. The number of M&A deals is projected to see a steady increase from 2025 onwards, potentially impacting the overall market landscape.
Food Grade Ethanol Industry Industry Trends & Analysis
The Food Grade Ethanol Industry is poised for substantial growth, driven by an escalating global demand for processed foods, premium beverages, and health-conscious dietary supplements. The Compound Annual Growth Rate (CAGR) for this sector is conservatively estimated at xx% during the forecast period, reflecting robust expansion fueled by evolving consumer preferences and increasing disposable incomes in emerging economies. Technological disruptions are continuously optimizing production processes, leading to enhanced purity, reduced costs, and improved sustainability metrics. The adoption of advanced fermentation techniques and more efficient purification methods are key areas of innovation. Consumer preferences are increasingly leaning towards natural, clean-label ingredients, which directly bolsters the demand for naturally derived food-grade ethanol. The perceived health benefits and versatility of ethanol as a solvent, preservative, and carrier for flavors and active ingredients in dietary supplements are further accelerating its market penetration. Competitive dynamics are intense, with established players investing heavily in research and development to maintain their edge. The market penetration of specialized food-grade ethanol products is expected to rise significantly as manufacturers cater to niche applications requiring specific purity levels and functionalities. The industry is also witnessing a growing emphasis on sustainable sourcing of raw materials, such as corn and sugarcane, with a substantial portion of the market share allocated to producers with strong environmental, social, and governance (ESG) credentials.
Leading Markets & Segments in Food Grade Ethanol Industry
The Food application segment is currently the dominant market within the Food Grade Ethanol Industry, driven by its widespread use as a solvent for flavorings, a preservative, and a base for extracts in a vast array of food products. The global market for food-grade ethanol in this segment is estimated to be in the tens of billions of dollars. North America and Europe represent the leading regional markets, owing to their established food processing industries and high consumer demand for processed and convenience foods. However, the Asia Pacific region is exhibiting the fastest growth, propelled by rapid urbanization, a burgeoning middle class, and a shift towards Westernized dietary habits.
- Type: Ethanol: This sub-segment is the cornerstone of the industry, encompassing various grades of purified ethanol used across numerous applications. The consistent demand from the food and beverage sectors ensures its continued dominance.
- Application: Food: As mentioned, this is the largest segment, with key drivers including increasing demand for convenient and processed foods, rising consumer awareness of natural ingredients, and the expanding use of flavor extracts and food colorings. Economic policies promoting food security and industrial growth in developing nations further contribute to this segment's expansion.
- Application: Beverages: The beverage industry is another significant consumer, utilizing food-grade ethanol for the production of alcoholic beverages, as well as a solvent for flavorings and colorings in non-alcoholic drinks. Growing consumer spending on premium and craft beverages fuels this application.
- Application: Dietary Supplements: This segment is experiencing rapid growth due to the increasing global focus on health and wellness. Food-grade ethanol serves as an essential solvent and extraction medium for active pharmaceutical ingredients (APIs) and botanical extracts used in a wide range of dietary supplements. Technological advancements in encapsulation and delivery systems are further enhancing the utility of ethanol in this sector.
The dominance analysis reveals a strong interplay between these segments. For instance, innovations in the beverage sector often drive demand for specific grades of food-grade ethanol, while advancements in dietary supplement formulation necessitate higher purity standards. Economic policies that support agricultural output directly impact the availability and cost of raw materials for ethanol production, influencing the overall market dynamics. Infrastructure development in emerging economies is crucial for the efficient distribution of food-grade ethanol, further supporting the growth of its application segments.
Food Grade Ethanol Industry Product Developments
Product developments in the Food Grade Ethanol Industry are primarily focused on enhancing purity, sustainability, and specialized functionalities. Innovations in distillation and purification technologies are yielding ultra-high purity ethanol grades, crucial for sensitive applications like infant food and pharmaceutical excipients. The development of bio-based ethanol derived from novel feedstocks, such as agricultural waste and algae, is gaining traction, offering a more sustainable alternative to traditional sources. Competitive advantages are being forged through the production of ethanol with specific sensory profiles, tailored for distinct flavor extraction needs in the food and beverage industries, and through the creation of ethanol formulations optimized for the efficient delivery of active ingredients in dietary supplements.
Key Drivers of Food Grade Ethanol Industry Growth
Several key drivers are propelling the growth of the Food Grade Ethanol Industry. Technological advancements in fermentation and distillation processes are leading to more efficient and cost-effective production of high-purity ethanol. The increasing global demand for processed foods, beverages, and health-conscious dietary supplements, driven by population growth and changing lifestyles, is a major catalyst. Furthermore, a growing preference for natural and clean-label ingredients in consumer products directly benefits the demand for food-grade ethanol, which is often perceived as a natural and versatile ingredient. Favorable regulatory environments in some regions, supporting the use of ethanol in food applications, also contribute to its expansion.
Challenges in the Food Grade Ethanol Industry Market
The Food Grade Ethanol Industry faces several challenges that could impede its growth trajectory. Stringent regulatory hurdles related to product purity, labeling, and safety standards in different countries can increase compliance costs and market entry barriers. Supply chain disruptions, influenced by geopolitical events, climate change impacting agricultural yields, and logistical complexities, can lead to price volatility and availability issues. Intense competition from both established players and new entrants, coupled with the constant need for investment in advanced technologies, also poses a significant challenge. The fluctuating prices of raw materials, such as corn and sugarcane, can impact profit margins.
Emerging Opportunities in Food Grade Ethanol Industry
Emerging opportunities in the Food Grade Ethanol Industry are diverse and promising. Technological breakthroughs in enzyme technology and genetic engineering are enabling the development of novel, high-yield fermentation processes and the utilization of a wider range of sustainable feedstocks. Strategic partnerships between ethanol producers and food, beverage, and dietary supplement manufacturers are creating opportunities for customized product development and co-innovation. Market expansion into emerging economies, with their rapidly growing middle classes and increasing demand for processed goods, presents significant untapped potential. Furthermore, the growing consumer interest in plant-based and naturally derived ingredients is opening new avenues for bio-ethanol derived from non-food crops.
Leading Players in the Food Grade Ethanol Industry Sector
- Cargill Incorporated
- MGP
- Manildra Group
- Cristalco
- Archer Daniels Midland Company
- Wilmar International Ltd
- Roquette Freres
- Greenfield Global Inc.
- Coca-Cola Company
- Grain Processing Corporation
Key Milestones in Food Grade Ethanol Industry Industry
- 2019: Increased focus on sustainability drives investments in advanced bio-refinery technologies, leading to more efficient ethanol production.
- 2020: Heightened consumer demand for natural ingredients and clean-label products boosts the market for high-purity food-grade ethanol.
- 2021: Key players announce strategic collaborations to expand their product portfolios and reach into emerging markets.
- 2022: Regulatory bodies release updated guidelines for food-grade ethanol purity standards, prompting innovation in purification techniques.
- 2023: Significant investments observed in research and development for novel feedstocks, including non-grain sources.
- 2024: M&A activities show a moderate uptick as companies seek to consolidate market share and enhance operational efficiencies.
- 2025: Expected increase in demand for specialized food-grade ethanol grades for functional foods and advanced dietary supplements.
- 2026-2030: Anticipated acceleration in market expansion into rapidly developing economies in Asia and Africa.
- 2031-2033: Continued innovation in bio-ethanol production and its applications, with a strong emphasis on circular economy principles.
Strategic Outlook for Food Grade Ethanol Industry Market
The strategic outlook for the Food Grade Ethanol Industry remains exceptionally positive, driven by sustained global demand and continuous innovation. Growth accelerators include the ongoing trend towards natural and clean-label products, the expanding dietary supplement market, and the development of advanced bio-refining technologies. Strategic opportunities lie in further penetration of emerging markets, diversification of feedstock sources for enhanced sustainability, and the development of specialized ethanol grades catering to evolving consumer and industrial needs. Companies that prioritize R&D, sustainable practices, and strategic partnerships will be best positioned to capitalize on the significant future market potential.
Food Grade Ethanol Industry Segmentation
-
1. Type
- 1.1. Ethanol
- 1.2. Polyols
-
2. Application
- 2.1. Food
- 2.2. Beverages
- 2.3. Dietary Supplements
Food Grade Ethanol Industry Segmentation By Geography
-
1. North America
- 1.1. United States
- 1.2. Canada
- 1.3. Mexico
- 1.4. Rest of North America
-
2. Europe
- 2.1. Spain
- 2.2. United Kingdom
- 2.3. Germany
- 2.4. France
- 2.5. Italy
- 2.6. Rest of Europe
-
3. Asia Pacific
- 3.1. China
- 3.2. Japan
- 3.3. India
- 3.4. Australia
- 3.5. Rest of Asia Pacific
-
4. South America
- 4.1. Brazil
- 4.2. Argentina
- 4.3. Rest of South America
- 5. Middle East
-
6. South Africa
- 6.1. Saudi Arabia
- 6.2. Rest of Middle East
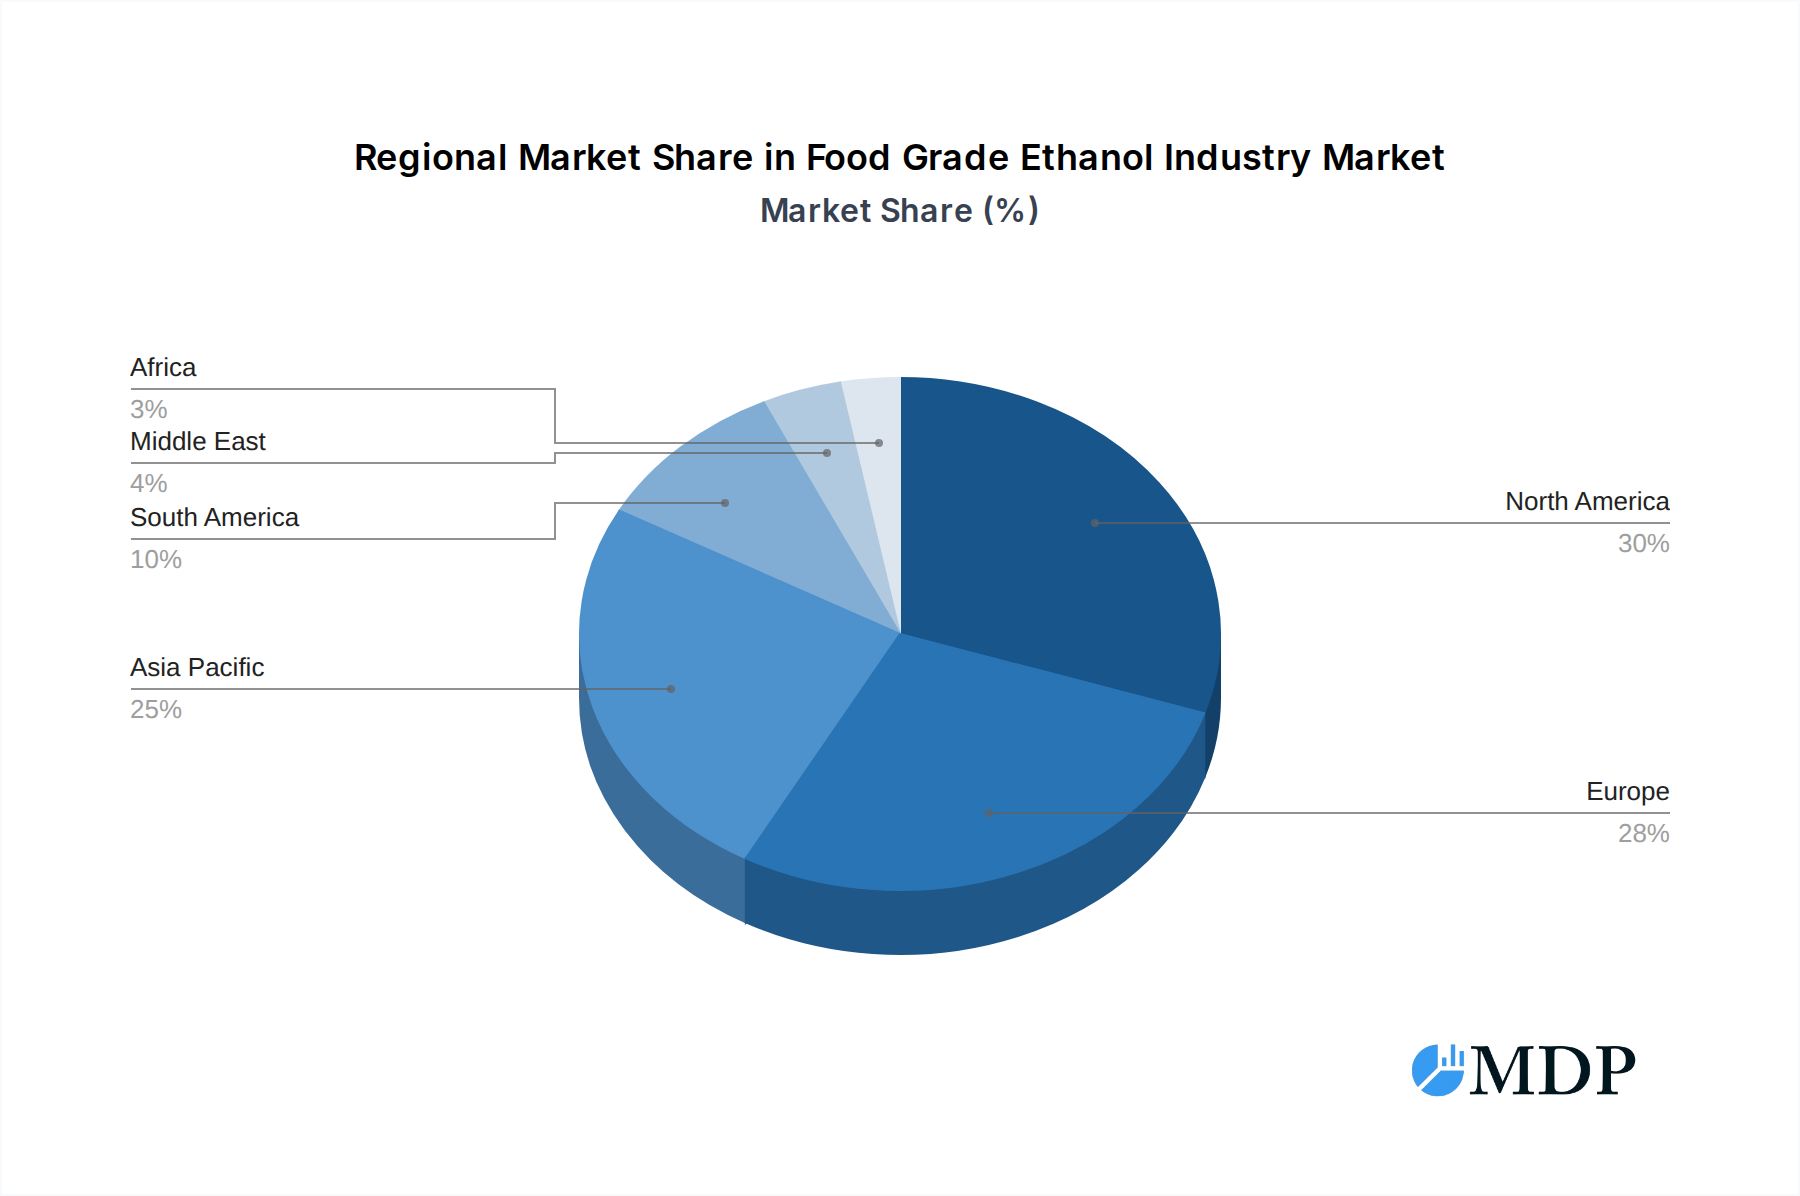
Food Grade Ethanol Industry Regional Market Share
Geographic Coverage of Food Grade Ethanol Industry
Food Grade Ethanol Industry REPORT HIGHLIGHTS
| Aspects | Details |
|---|---|
| Study Period | 2020-2034 |
| Base Year | 2025 |
| Estimated Year | 2026 |
| Forecast Period | 2026-2034 |
| Historical Period | 2020-2025 |
| Growth Rate | CAGR of 7.5% from 2020-2034 |
| Segmentation |
|
Table of Contents
- 1. Introduction
- 1.1. Research Scope
- 1.2. Market Segmentation
- 1.3. Research Objective
- 1.4. Definitions and Assumptions
- 2. Executive Summary
- 2.1. Market Snapshot
- 3. Market Dynamics
- 3.1. Market Drivers
- 3.2. Market Restrains
- 3.3. Market Trends
- 3.4. Market Opportunities
- 4. Market Factor Analysis
- 4.1. Porters Five Forces
- 4.1.1. Bargaining Power of Suppliers
- 4.1.2. Bargaining Power of Buyers
- 4.1.3. Threat of New Entrants
- 4.1.4. Threat of Substitutes
- 4.1.5. Competitive Rivalry
- 4.2. PESTEL analysis
- 4.3. BCG Analysis
- 4.3.1. Stars (High Growth, High Market Share)
- 4.3.2. Cash Cows (Low Growth, High Market Share)
- 4.3.3. Question Mark (High Growth, Low Market Share)
- 4.3.4. Dogs (Low Growth, Low Market Share)
- 4.4. Ansoff Matrix Analysis
- 4.5. Supply Chain Analysis
- 4.6. Regulatory Landscape
- 4.7. Current Market Potential and Opportunity Assessment (TAM–SAM–SOM Framework)
- 4.8. MDP Analyst Note
- 4.1. Porters Five Forces
- 5. Market Analysis, Insights and Forecast 2021-2033
- 5.1. Market Analysis, Insights and Forecast - by Type
- 5.1.1. Ethanol
- 5.1.2. Polyols
- 5.2. Market Analysis, Insights and Forecast - by Application
- 5.2.1. Food
- 5.2.2. Beverages
- 5.2.3. Dietary Supplements
- 5.3. Market Analysis, Insights and Forecast - by Region
- 5.3.1. North America
- 5.3.2. Europe
- 5.3.3. Asia Pacific
- 5.3.4. South America
- 5.3.5. Middle East
- 5.3.6. South Africa
- 5.1. Market Analysis, Insights and Forecast - by Type
- 6. Global Food Grade Ethanol Industry Analysis, Insights and Forecast, 2021-2033
- 6.1. Market Analysis, Insights and Forecast - by Type
- 6.1.1. Ethanol
- 6.1.2. Polyols
- 6.2. Market Analysis, Insights and Forecast - by Application
- 6.2.1. Food
- 6.2.2. Beverages
- 6.2.3. Dietary Supplements
- 6.1. Market Analysis, Insights and Forecast - by Type
- 7. North America Food Grade Ethanol Industry Analysis, Insights and Forecast, 2020-2032
- 7.1. Market Analysis, Insights and Forecast - by Type
- 7.1.1. Ethanol
- 7.1.2. Polyols
- 7.2. Market Analysis, Insights and Forecast - by Application
- 7.2.1. Food
- 7.2.2. Beverages
- 7.2.3. Dietary Supplements
- 7.1. Market Analysis, Insights and Forecast - by Type
- 8. Europe Food Grade Ethanol Industry Analysis, Insights and Forecast, 2020-2032
- 8.1. Market Analysis, Insights and Forecast - by Type
- 8.1.1. Ethanol
- 8.1.2. Polyols
- 8.2. Market Analysis, Insights and Forecast - by Application
- 8.2.1. Food
- 8.2.2. Beverages
- 8.2.3. Dietary Supplements
- 8.1. Market Analysis, Insights and Forecast - by Type
- 9. Asia Pacific Food Grade Ethanol Industry Analysis, Insights and Forecast, 2020-2032
- 9.1. Market Analysis, Insights and Forecast - by Type
- 9.1.1. Ethanol
- 9.1.2. Polyols
- 9.2. Market Analysis, Insights and Forecast - by Application
- 9.2.1. Food
- 9.2.2. Beverages
- 9.2.3. Dietary Supplements
- 9.1. Market Analysis, Insights and Forecast - by Type
- 10. South America Food Grade Ethanol Industry Analysis, Insights and Forecast, 2020-2032
- 10.1. Market Analysis, Insights and Forecast - by Type
- 10.1.1. Ethanol
- 10.1.2. Polyols
- 10.2. Market Analysis, Insights and Forecast - by Application
- 10.2.1. Food
- 10.2.2. Beverages
- 10.2.3. Dietary Supplements
- 10.1. Market Analysis, Insights and Forecast - by Type
- 11. Middle East Food Grade Ethanol Industry Analysis, Insights and Forecast, 2020-2032
- 11.1. Market Analysis, Insights and Forecast - by Type
- 11.1.1. Ethanol
- 11.1.2. Polyols
- 11.2. Market Analysis, Insights and Forecast - by Application
- 11.2.1. Food
- 11.2.2. Beverages
- 11.2.3. Dietary Supplements
- 11.1. Market Analysis, Insights and Forecast - by Type
- 12. South Africa Food Grade Ethanol Industry Analysis, Insights and Forecast, 2020-2032
- 12.1. Market Analysis, Insights and Forecast - by Type
- 12.1.1. Ethanol
- 12.1.2. Polyols
- 12.2. Market Analysis, Insights and Forecast - by Application
- 12.2.1. Food
- 12.2.2. Beverages
- 12.2.3. Dietary Supplements
- 12.1. Market Analysis, Insights and Forecast - by Type
- 13. Competitive Analysis
- 13.1. Company Profiles
- 13.1.1 Cargill Incorporated
- 13.1.1.1. Company Overview
- 13.1.1.2. Products
- 13.1.1.3. Company Financials
- 13.1.1.4. SWOT Analysis
- 13.1.2 MGP
- 13.1.2.1. Company Overview
- 13.1.2.2. Products
- 13.1.2.3. Company Financials
- 13.1.2.4. SWOT Analysis
- 13.1.3 Manildra Group
- 13.1.3.1. Company Overview
- 13.1.3.2. Products
- 13.1.3.3. Company Financials
- 13.1.3.4. SWOT Analysis
- 13.1.4 Cristalco*List Not Exhaustive
- 13.1.4.1. Company Overview
- 13.1.4.2. Products
- 13.1.4.3. Company Financials
- 13.1.4.4. SWOT Analysis
- 13.1.5 Archer Daniels Midland Company
- 13.1.5.1. Company Overview
- 13.1.5.2. Products
- 13.1.5.3. Company Financials
- 13.1.5.4. SWOT Analysis
- 13.1.6 Wilmar International Ltd
- 13.1.6.1. Company Overview
- 13.1.6.2. Products
- 13.1.6.3. Company Financials
- 13.1.6.4. SWOT Analysis
- 13.1.7 Roquette Freres
- 13.1.7.1. Company Overview
- 13.1.7.2. Products
- 13.1.7.3. Company Financials
- 13.1.7.4. SWOT Analysis
- 13.1.8 Greenfield Global Inc.
- 13.1.8.1. Company Overview
- 13.1.8.2. Products
- 13.1.8.3. Company Financials
- 13.1.8.4. SWOT Analysis
- 13.1.9 Coca-Cola Company
- 13.1.9.1. Company Overview
- 13.1.9.2. Products
- 13.1.9.3. Company Financials
- 13.1.9.4. SWOT Analysis
- 13.1.10 Grain Processing Corporation
- 13.1.10.1. Company Overview
- 13.1.10.2. Products
- 13.1.10.3. Company Financials
- 13.1.10.4. SWOT Analysis
- 13.1.1 Cargill Incorporated
- 13.2. Market Entropy
- 13.2.1 Company's Key Areas Served
- 13.2.2 Recent Developments
- 13.3. Company Market Share Analysis 2025
- 13.3.1 Top 5 Companies Market Share Analysis
- 13.3.2 Top 3 Companies Market Share Analysis
- 13.4. List of Potential Customers
- 14. Research Methodology
List of Figures
- Figure 1: Global Food Grade Ethanol Industry Revenue Breakdown (billion, %) by Region 2025 & 2033
- Figure 2: Global Food Grade Ethanol Industry Volume Breakdown (K Tons, %) by Region 2025 & 2033
- Figure 3: North America Food Grade Ethanol Industry Revenue (billion), by Type 2025 & 2033
- Figure 4: North America Food Grade Ethanol Industry Volume (K Tons), by Type 2025 & 2033
- Figure 5: North America Food Grade Ethanol Industry Revenue Share (%), by Type 2025 & 2033
- Figure 6: North America Food Grade Ethanol Industry Volume Share (%), by Type 2025 & 2033
- Figure 7: North America Food Grade Ethanol Industry Revenue (billion), by Application 2025 & 2033
- Figure 8: North America Food Grade Ethanol Industry Volume (K Tons), by Application 2025 & 2033
- Figure 9: North America Food Grade Ethanol Industry Revenue Share (%), by Application 2025 & 2033
- Figure 10: North America Food Grade Ethanol Industry Volume Share (%), by Application 2025 & 2033
- Figure 11: North America Food Grade Ethanol Industry Revenue (billion), by Country 2025 & 2033
- Figure 12: North America Food Grade Ethanol Industry Volume (K Tons), by Country 2025 & 2033
- Figure 13: North America Food Grade Ethanol Industry Revenue Share (%), by Country 2025 & 2033
- Figure 14: North America Food Grade Ethanol Industry Volume Share (%), by Country 2025 & 2033
- Figure 15: Europe Food Grade Ethanol Industry Revenue (billion), by Type 2025 & 2033
- Figure 16: Europe Food Grade Ethanol Industry Volume (K Tons), by Type 2025 & 2033
- Figure 17: Europe Food Grade Ethanol Industry Revenue Share (%), by Type 2025 & 2033
- Figure 18: Europe Food Grade Ethanol Industry Volume Share (%), by Type 2025 & 2033
- Figure 19: Europe Food Grade Ethanol Industry Revenue (billion), by Application 2025 & 2033
- Figure 20: Europe Food Grade Ethanol Industry Volume (K Tons), by Application 2025 & 2033
- Figure 21: Europe Food Grade Ethanol Industry Revenue Share (%), by Application 2025 & 2033
- Figure 22: Europe Food Grade Ethanol Industry Volume Share (%), by Application 2025 & 2033
- Figure 23: Europe Food Grade Ethanol Industry Revenue (billion), by Country 2025 & 2033
- Figure 24: Europe Food Grade Ethanol Industry Volume (K Tons), by Country 2025 & 2033
- Figure 25: Europe Food Grade Ethanol Industry Revenue Share (%), by Country 2025 & 2033
- Figure 26: Europe Food Grade Ethanol Industry Volume Share (%), by Country 2025 & 2033
- Figure 27: Asia Pacific Food Grade Ethanol Industry Revenue (billion), by Type 2025 & 2033
- Figure 28: Asia Pacific Food Grade Ethanol Industry Volume (K Tons), by Type 2025 & 2033
- Figure 29: Asia Pacific Food Grade Ethanol Industry Revenue Share (%), by Type 2025 & 2033
- Figure 30: Asia Pacific Food Grade Ethanol Industry Volume Share (%), by Type 2025 & 2033
- Figure 31: Asia Pacific Food Grade Ethanol Industry Revenue (billion), by Application 2025 & 2033
- Figure 32: Asia Pacific Food Grade Ethanol Industry Volume (K Tons), by Application 2025 & 2033
- Figure 33: Asia Pacific Food Grade Ethanol Industry Revenue Share (%), by Application 2025 & 2033
- Figure 34: Asia Pacific Food Grade Ethanol Industry Volume Share (%), by Application 2025 & 2033
- Figure 35: Asia Pacific Food Grade Ethanol Industry Revenue (billion), by Country 2025 & 2033
- Figure 36: Asia Pacific Food Grade Ethanol Industry Volume (K Tons), by Country 2025 & 2033
- Figure 37: Asia Pacific Food Grade Ethanol Industry Revenue Share (%), by Country 2025 & 2033
- Figure 38: Asia Pacific Food Grade Ethanol Industry Volume Share (%), by Country 2025 & 2033
- Figure 39: South America Food Grade Ethanol Industry Revenue (billion), by Type 2025 & 2033
- Figure 40: South America Food Grade Ethanol Industry Volume (K Tons), by Type 2025 & 2033
- Figure 41: South America Food Grade Ethanol Industry Revenue Share (%), by Type 2025 & 2033
- Figure 42: South America Food Grade Ethanol Industry Volume Share (%), by Type 2025 & 2033
- Figure 43: South America Food Grade Ethanol Industry Revenue (billion), by Application 2025 & 2033
- Figure 44: South America Food Grade Ethanol Industry Volume (K Tons), by Application 2025 & 2033
- Figure 45: South America Food Grade Ethanol Industry Revenue Share (%), by Application 2025 & 2033
- Figure 46: South America Food Grade Ethanol Industry Volume Share (%), by Application 2025 & 2033
- Figure 47: South America Food Grade Ethanol Industry Revenue (billion), by Country 2025 & 2033
- Figure 48: South America Food Grade Ethanol Industry Volume (K Tons), by Country 2025 & 2033
- Figure 49: South America Food Grade Ethanol Industry Revenue Share (%), by Country 2025 & 2033
- Figure 50: South America Food Grade Ethanol Industry Volume Share (%), by Country 2025 & 2033
- Figure 51: Middle East Food Grade Ethanol Industry Revenue (billion), by Type 2025 & 2033
- Figure 52: Middle East Food Grade Ethanol Industry Volume (K Tons), by Type 2025 & 2033
- Figure 53: Middle East Food Grade Ethanol Industry Revenue Share (%), by Type 2025 & 2033
- Figure 54: Middle East Food Grade Ethanol Industry Volume Share (%), by Type 2025 & 2033
- Figure 55: Middle East Food Grade Ethanol Industry Revenue (billion), by Application 2025 & 2033
- Figure 56: Middle East Food Grade Ethanol Industry Volume (K Tons), by Application 2025 & 2033
- Figure 57: Middle East Food Grade Ethanol Industry Revenue Share (%), by Application 2025 & 2033
- Figure 58: Middle East Food Grade Ethanol Industry Volume Share (%), by Application 2025 & 2033
- Figure 59: Middle East Food Grade Ethanol Industry Revenue (billion), by Country 2025 & 2033
- Figure 60: Middle East Food Grade Ethanol Industry Volume (K Tons), by Country 2025 & 2033
- Figure 61: Middle East Food Grade Ethanol Industry Revenue Share (%), by Country 2025 & 2033
- Figure 62: Middle East Food Grade Ethanol Industry Volume Share (%), by Country 2025 & 2033
- Figure 63: South Africa Food Grade Ethanol Industry Revenue (billion), by Type 2025 & 2033
- Figure 64: South Africa Food Grade Ethanol Industry Volume (K Tons), by Type 2025 & 2033
- Figure 65: South Africa Food Grade Ethanol Industry Revenue Share (%), by Type 2025 & 2033
- Figure 66: South Africa Food Grade Ethanol Industry Volume Share (%), by Type 2025 & 2033
- Figure 67: South Africa Food Grade Ethanol Industry Revenue (billion), by Application 2025 & 2033
- Figure 68: South Africa Food Grade Ethanol Industry Volume (K Tons), by Application 2025 & 2033
- Figure 69: South Africa Food Grade Ethanol Industry Revenue Share (%), by Application 2025 & 2033
- Figure 70: South Africa Food Grade Ethanol Industry Volume Share (%), by Application 2025 & 2033
- Figure 71: South Africa Food Grade Ethanol Industry Revenue (billion), by Country 2025 & 2033
- Figure 72: South Africa Food Grade Ethanol Industry Volume (K Tons), by Country 2025 & 2033
- Figure 73: South Africa Food Grade Ethanol Industry Revenue Share (%), by Country 2025 & 2033
- Figure 74: South Africa Food Grade Ethanol Industry Volume Share (%), by Country 2025 & 2033
List of Tables
- Table 1: Global Food Grade Ethanol Industry Revenue billion Forecast, by Type 2020 & 2033
- Table 2: Global Food Grade Ethanol Industry Volume K Tons Forecast, by Type 2020 & 2033
- Table 3: Global Food Grade Ethanol Industry Revenue billion Forecast, by Application 2020 & 2033
- Table 4: Global Food Grade Ethanol Industry Volume K Tons Forecast, by Application 2020 & 2033
- Table 5: Global Food Grade Ethanol Industry Revenue billion Forecast, by Region 2020 & 2033
- Table 6: Global Food Grade Ethanol Industry Volume K Tons Forecast, by Region 2020 & 2033
- Table 7: Global Food Grade Ethanol Industry Revenue billion Forecast, by Type 2020 & 2033
- Table 8: Global Food Grade Ethanol Industry Volume K Tons Forecast, by Type 2020 & 2033
- Table 9: Global Food Grade Ethanol Industry Revenue billion Forecast, by Application 2020 & 2033
- Table 10: Global Food Grade Ethanol Industry Volume K Tons Forecast, by Application 2020 & 2033
- Table 11: Global Food Grade Ethanol Industry Revenue billion Forecast, by Country 2020 & 2033
- Table 12: Global Food Grade Ethanol Industry Volume K Tons Forecast, by Country 2020 & 2033
- Table 13: United States Food Grade Ethanol Industry Revenue (billion) Forecast, by Application 2020 & 2033
- Table 14: United States Food Grade Ethanol Industry Volume (K Tons) Forecast, by Application 2020 & 2033
- Table 15: Canada Food Grade Ethanol Industry Revenue (billion) Forecast, by Application 2020 & 2033
- Table 16: Canada Food Grade Ethanol Industry Volume (K Tons) Forecast, by Application 2020 & 2033
- Table 17: Mexico Food Grade Ethanol Industry Revenue (billion) Forecast, by Application 2020 & 2033
- Table 18: Mexico Food Grade Ethanol Industry Volume (K Tons) Forecast, by Application 2020 & 2033
- Table 19: Rest of North America Food Grade Ethanol Industry Revenue (billion) Forecast, by Application 2020 & 2033
- Table 20: Rest of North America Food Grade Ethanol Industry Volume (K Tons) Forecast, by Application 2020 & 2033
- Table 21: Global Food Grade Ethanol Industry Revenue billion Forecast, by Type 2020 & 2033
- Table 22: Global Food Grade Ethanol Industry Volume K Tons Forecast, by Type 2020 & 2033
- Table 23: Global Food Grade Ethanol Industry Revenue billion Forecast, by Application 2020 & 2033
- Table 24: Global Food Grade Ethanol Industry Volume K Tons Forecast, by Application 2020 & 2033
- Table 25: Global Food Grade Ethanol Industry Revenue billion Forecast, by Country 2020 & 2033
- Table 26: Global Food Grade Ethanol Industry Volume K Tons Forecast, by Country 2020 & 2033
- Table 27: Spain Food Grade Ethanol Industry Revenue (billion) Forecast, by Application 2020 & 2033
- Table 28: Spain Food Grade Ethanol Industry Volume (K Tons) Forecast, by Application 2020 & 2033
- Table 29: United Kingdom Food Grade Ethanol Industry Revenue (billion) Forecast, by Application 2020 & 2033
- Table 30: United Kingdom Food Grade Ethanol Industry Volume (K Tons) Forecast, by Application 2020 & 2033
- Table 31: Germany Food Grade Ethanol Industry Revenue (billion) Forecast, by Application 2020 & 2033
- Table 32: Germany Food Grade Ethanol Industry Volume (K Tons) Forecast, by Application 2020 & 2033
- Table 33: France Food Grade Ethanol Industry Revenue (billion) Forecast, by Application 2020 & 2033
- Table 34: France Food Grade Ethanol Industry Volume (K Tons) Forecast, by Application 2020 & 2033
- Table 35: Italy Food Grade Ethanol Industry Revenue (billion) Forecast, by Application 2020 & 2033
- Table 36: Italy Food Grade Ethanol Industry Volume (K Tons) Forecast, by Application 2020 & 2033
- Table 37: Rest of Europe Food Grade Ethanol Industry Revenue (billion) Forecast, by Application 2020 & 2033
- Table 38: Rest of Europe Food Grade Ethanol Industry Volume (K Tons) Forecast, by Application 2020 & 2033
- Table 39: Global Food Grade Ethanol Industry Revenue billion Forecast, by Type 2020 & 2033
- Table 40: Global Food Grade Ethanol Industry Volume K Tons Forecast, by Type 2020 & 2033
- Table 41: Global Food Grade Ethanol Industry Revenue billion Forecast, by Application 2020 & 2033
- Table 42: Global Food Grade Ethanol Industry Volume K Tons Forecast, by Application 2020 & 2033
- Table 43: Global Food Grade Ethanol Industry Revenue billion Forecast, by Country 2020 & 2033
- Table 44: Global Food Grade Ethanol Industry Volume K Tons Forecast, by Country 2020 & 2033
- Table 45: China Food Grade Ethanol Industry Revenue (billion) Forecast, by Application 2020 & 2033
- Table 46: China Food Grade Ethanol Industry Volume (K Tons) Forecast, by Application 2020 & 2033
- Table 47: Japan Food Grade Ethanol Industry Revenue (billion) Forecast, by Application 2020 & 2033
- Table 48: Japan Food Grade Ethanol Industry Volume (K Tons) Forecast, by Application 2020 & 2033
- Table 49: India Food Grade Ethanol Industry Revenue (billion) Forecast, by Application 2020 & 2033
- Table 50: India Food Grade Ethanol Industry Volume (K Tons) Forecast, by Application 2020 & 2033
- Table 51: Australia Food Grade Ethanol Industry Revenue (billion) Forecast, by Application 2020 & 2033
- Table 52: Australia Food Grade Ethanol Industry Volume (K Tons) Forecast, by Application 2020 & 2033
- Table 53: Rest of Asia Pacific Food Grade Ethanol Industry Revenue (billion) Forecast, by Application 2020 & 2033
- Table 54: Rest of Asia Pacific Food Grade Ethanol Industry Volume (K Tons) Forecast, by Application 2020 & 2033
- Table 55: Global Food Grade Ethanol Industry Revenue billion Forecast, by Type 2020 & 2033
- Table 56: Global Food Grade Ethanol Industry Volume K Tons Forecast, by Type 2020 & 2033
- Table 57: Global Food Grade Ethanol Industry Revenue billion Forecast, by Application 2020 & 2033
- Table 58: Global Food Grade Ethanol Industry Volume K Tons Forecast, by Application 2020 & 2033
- Table 59: Global Food Grade Ethanol Industry Revenue billion Forecast, by Country 2020 & 2033
- Table 60: Global Food Grade Ethanol Industry Volume K Tons Forecast, by Country 2020 & 2033
- Table 61: Brazil Food Grade Ethanol Industry Revenue (billion) Forecast, by Application 2020 & 2033
- Table 62: Brazil Food Grade Ethanol Industry Volume (K Tons) Forecast, by Application 2020 & 2033
- Table 63: Argentina Food Grade Ethanol Industry Revenue (billion) Forecast, by Application 2020 & 2033
- Table 64: Argentina Food Grade Ethanol Industry Volume (K Tons) Forecast, by Application 2020 & 2033
- Table 65: Rest of South America Food Grade Ethanol Industry Revenue (billion) Forecast, by Application 2020 & 2033
- Table 66: Rest of South America Food Grade Ethanol Industry Volume (K Tons) Forecast, by Application 2020 & 2033
- Table 67: Global Food Grade Ethanol Industry Revenue billion Forecast, by Type 2020 & 2033
- Table 68: Global Food Grade Ethanol Industry Volume K Tons Forecast, by Type 2020 & 2033
- Table 69: Global Food Grade Ethanol Industry Revenue billion Forecast, by Application 2020 & 2033
- Table 70: Global Food Grade Ethanol Industry Volume K Tons Forecast, by Application 2020 & 2033
- Table 71: Global Food Grade Ethanol Industry Revenue billion Forecast, by Country 2020 & 2033
- Table 72: Global Food Grade Ethanol Industry Volume K Tons Forecast, by Country 2020 & 2033
- Table 73: Global Food Grade Ethanol Industry Revenue billion Forecast, by Type 2020 & 2033
- Table 74: Global Food Grade Ethanol Industry Volume K Tons Forecast, by Type 2020 & 2033
- Table 75: Global Food Grade Ethanol Industry Revenue billion Forecast, by Application 2020 & 2033
- Table 76: Global Food Grade Ethanol Industry Volume K Tons Forecast, by Application 2020 & 2033
- Table 77: Global Food Grade Ethanol Industry Revenue billion Forecast, by Country 2020 & 2033
- Table 78: Global Food Grade Ethanol Industry Volume K Tons Forecast, by Country 2020 & 2033
- Table 79: Saudi Arabia Food Grade Ethanol Industry Revenue (billion) Forecast, by Application 2020 & 2033
- Table 80: Saudi Arabia Food Grade Ethanol Industry Volume (K Tons) Forecast, by Application 2020 & 2033
- Table 81: Rest of Middle East Food Grade Ethanol Industry Revenue (billion) Forecast, by Application 2020 & 2033
- Table 82: Rest of Middle East Food Grade Ethanol Industry Volume (K Tons) Forecast, by Application 2020 & 2033
Frequently Asked Questions
1. What is the projected Compound Annual Growth Rate (CAGR) of the Food Grade Ethanol Industry?
The projected CAGR is approximately 7.5%.
2. Which companies are prominent players in the Food Grade Ethanol Industry?
Key companies in the market include Cargill Incorporated, MGP, Manildra Group, Cristalco*List Not Exhaustive, Archer Daniels Midland Company, Wilmar International Ltd, Roquette Freres, Greenfield Global Inc. , Coca-Cola Company , Grain Processing Corporation.
3. What are the main segments of the Food Grade Ethanol Industry?
The market segments include Type, Application.
4. Can you provide details about the market size?
The market size is estimated to be USD 3.75 billion as of 2022.
5. What are some drivers contributing to market growth?
Inclination Towards Fitness and Increasing Intake of Plant-based Protein; Increase in Consumer Inclination Towards Meat Substitutes.
6. What are the notable trends driving market growth?
Ethanol Dominates the Market Share.
7. Are there any restraints impacting market growth?
Gluten-Intolerance Among the Population Hindering the Market.
8. Can you provide examples of recent developments in the market?
N/A
9. What pricing options are available for accessing the report?
Pricing options include single-user, multi-user, and enterprise licenses priced at USD 4750, USD 5250, and USD 8750 respectively.
10. Is the market size provided in terms of value or volume?
The market size is provided in terms of value, measured in billion and volume, measured in K Tons.
11. Are there any specific market keywords associated with the report?
Yes, the market keyword associated with the report is "Food Grade Ethanol Industry," which aids in identifying and referencing the specific market segment covered.
12. How do I determine which pricing option suits my needs best?
The pricing options vary based on user requirements and access needs. Individual users may opt for single-user licenses, while businesses requiring broader access may choose multi-user or enterprise licenses for cost-effective access to the report.
13. Are there any additional resources or data provided in the Food Grade Ethanol Industry report?
While the report offers comprehensive insights, it's advisable to review the specific contents or supplementary materials provided to ascertain if additional resources or data are available.
14. How can I stay updated on further developments or reports in the Food Grade Ethanol Industry?
To stay informed about further developments, trends, and reports in the Food Grade Ethanol Industry, consider subscribing to industry newsletters, following relevant companies and organizations, or regularly checking reputable industry news sources and publications.
Methodology
Step 1 - Identification of Relevant Samples Size from Population Database


Step 2 - Approaches for Defining Global Market Size (Value, Volume* & Price*)

Note*: In applicable scenarios
Step 3 - Data Sources
Primary Research
- Web Analytics
- Survey Reports
- Research Institute
- Latest Research Reports
- Opinion Leaders
Secondary Research
- Annual Reports
- White Paper
- Latest Press Release
- Industry Association
- Paid Database
- Investor Presentations

Step 4 - Data Triangulation
Involves using different sources of information in order to increase the validity of a study
These sources are likely to be stakeholders in a program - participants, other researchers, program staff, other community members, and so on.
Then we put all data in single framework & apply various statistical tools to find out the dynamic on the market.
During the analysis stage, feedback from the stakeholder groups would be compared to determine areas of agreement as well as areas of divergence