

Key Insights
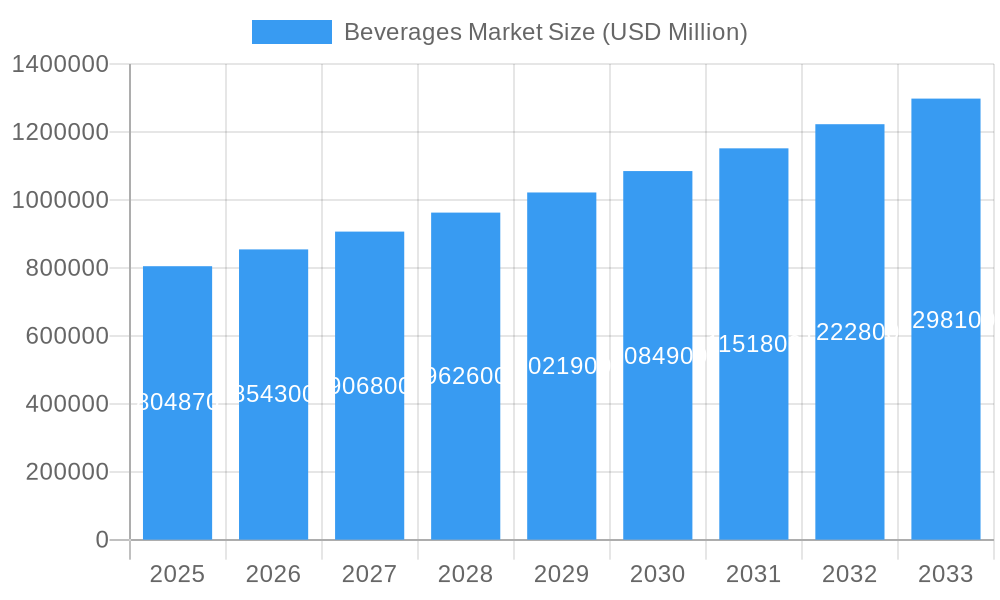
The global Beverages Market is poised for robust expansion, projected to reach $804.87 billion in 2025, with an anticipated Compound Annual Growth Rate (CAGR) of 6.22% through 2033. This significant growth is propelled by several key drivers, including evolving consumer preferences for healthier and more functional beverages, a rising disposable income in emerging economies, and the increasing prevalence of on-the-go consumption patterns. The non-alcoholic segment, particularly energy and sports drinks, packaged juices, and ready-to-drink (RTD) tea and coffee, is expected to witness substantial demand due to growing health consciousness and the convenience they offer. Furthermore, the alcoholic beverages segment, encompassing beer, wine, and spirits, continues to exhibit steady growth driven by premiumization trends and the exploration of novel flavor profiles. Technological advancements in production and packaging, alongside expanding distribution networks, particularly the burgeoning online retail channel, are also critical contributors to this positive market trajectory.
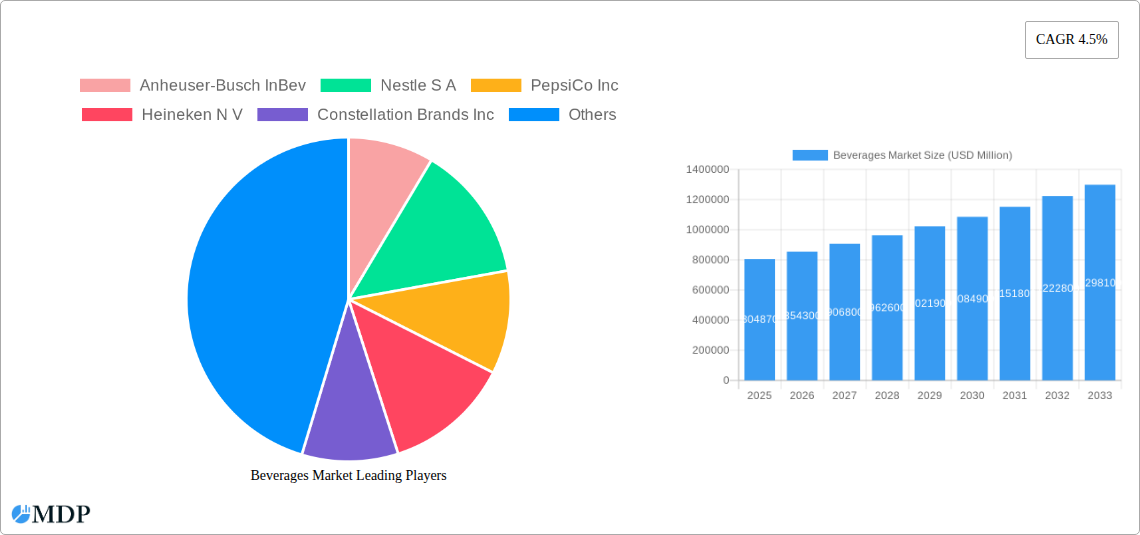
Beverages Market Market Size (In Billion)
Despite the strong growth outlook, certain restraints could temper the market's pace. These include increasing regulatory scrutiny on sugar content and marketing practices for certain beverage categories, fluctuations in raw material prices, and heightened competition among established players and new entrants. Nevertheless, the market's dynamism is evident in the ongoing innovation, with companies focusing on sustainable sourcing, reduced sugar options, and unique product formulations to capture consumer attention. The distribution landscape is also transforming, with a notable shift towards e-commerce and direct-to-consumer models, complementing traditional on-trade and off-trade channels. Geographically, the Asia Pacific region is anticipated to be a major growth engine, driven by its large population and increasing urbanization, while North America and Europe will continue to be significant contributors, driven by mature yet innovative markets.
Beverages Market Company Market Share
Dive deep into the dynamic world of the global beverages market with this indispensable industry report. Spanning from 2019 to 2033, with a base and estimated year of 2025, this analysis provides unparalleled insights into market dynamics, key trends, leading segments, and strategic outlook. We explore the expansive reach of alcoholic and non-alcoholic beverages, from craft beers and premium wines to energy drinks, soft drinks, bottled water, and RTD teas and coffees. Our report details distribution channel dominance, including on-trade and off-trade channels like supermarkets, convenience stores, and burgeoning online retail. With a projected market valuation of over $1.5 trillion in 2025 and a steady CAGR of 5.8% during the forecast period (2025-2033), this research is your ultimate guide to navigating this multi-billion dollar industry. Discover the innovations, challenges, and opportunities shaping the future of beverages, driven by global giants and emerging players alike.
Beverages Market Market Dynamics & Concentration
The global beverages market, projected to exceed $2.2 trillion by 2033, exhibits moderate to high concentration, with a few dominant players controlling significant market share. Anheuser-Busch InBev, Nestle S.A., PepsiCo Inc., The Coca-Cola Company, and Heineken N.V. are key entities influencing market direction. Innovation serves as a primary driver, fueled by evolving consumer preferences for healthier options, functional beverages, and novel flavors. Regulatory frameworks, particularly concerning sugar content, alcohol advertising, and environmental sustainability, significantly impact market strategies and product development. Product substitutes, such as the increasing demand for tap water over bottled water or homemade beverages over pre-packaged options, present ongoing challenges. End-user trends are heavily skewed towards convenience, health and wellness, and premiumization. Merger and acquisition (M&A) activities remain robust, with an estimated 250+ significant deals in the historical period (2019-2024), primarily aimed at portfolio expansion, market consolidation, and gaining access to new technologies or consumer segments.
- Market Concentration: Moderate to High
- Key Innovation Drivers: Health & Wellness, Functional Ingredients, Sustainability, Novel Flavors, Premiumization
- Regulatory Influence: Sugar Taxes, Labeling Regulations, Environmental Standards, Alcohol Restrictions
- Product Substitutes: Tap Water, Homemade Beverages, Plant-Based Alternatives
- End-User Trends: Convenience, Health Consciousness, Ethical Sourcing, Experiential Consumption
- M&A Activity: Active, focused on portfolio diversification and market expansion, with approximately 250+ major transactions in the historical period.
Beverages Market Industry Trends & Analysis
The global beverages market is characterized by sustained growth, driven by a burgeoning global population, rising disposable incomes in emerging economies, and increasingly sophisticated consumer demands. During the historical period (2019-2024), the market demonstrated a robust Compound Annual Growth Rate (CAGR) of approximately 4.5%, indicating strong underlying demand. Looking ahead, the forecast period (2025-2033) anticipates an acceleration, with an estimated CAGR of 5.8%, pushing the market valuation beyond the $2.2 trillion mark. This growth is significantly influenced by several key trends. Technological disruptions, such as advancements in packaging technology leading to extended shelf life and improved recyclability, and the rise of direct-to-consumer (DTC) e-commerce platforms, are reshaping distribution and consumer engagement. Consumer preferences are undergoing a profound shift towards healthier alternatives, including low-sugar options, plant-based beverages, and functional drinks fortified with vitamins, probiotics, and adaptogens. The demand for sustainability is also paramount, with consumers actively seeking brands with eco-friendly packaging and ethical sourcing practices. Competitive dynamics are fierce, with established global giants continuously innovating and acquiring smaller, agile brands to capture niche markets. The penetration of non-alcoholic beverages, particularly bottled water and packaged juices, continues to rise steadily across all demographics.
Leading Markets & Segments in Beverages Market
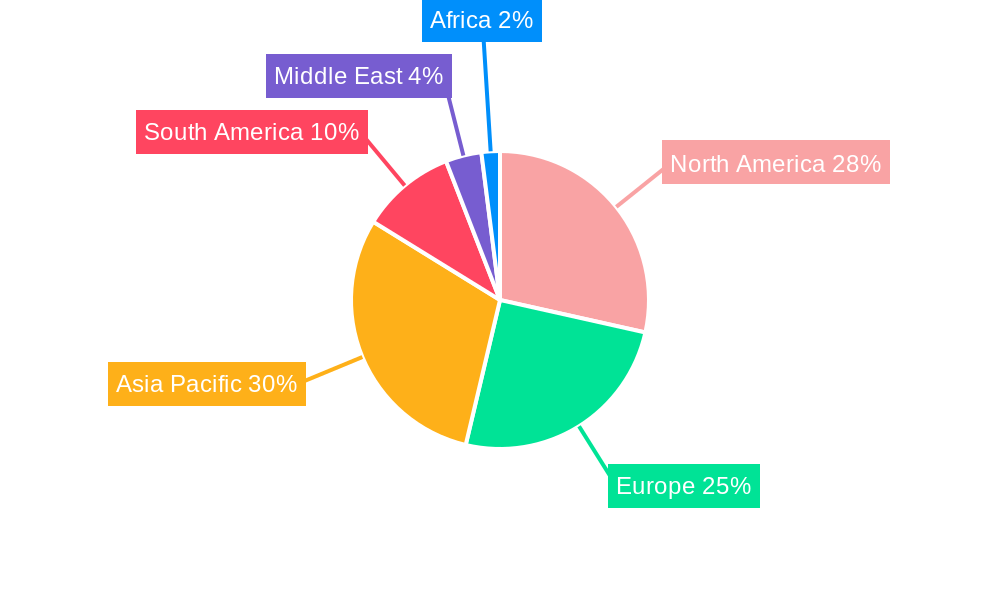
The global beverages market exhibits distinct regional dominance and segment leadership. North America and Europe currently lead in market value, driven by high disposable incomes and established consumer bases for both alcoholic and non-alcoholic beverages. However, the Asia-Pacific region is poised for the most significant growth, fueled by rapid urbanization, a growing middle class, and increasing brand awareness.
Product Type Dominance:
Non-Alcoholic Beverages: This segment is the largest contributor to the global market value, projected to exceed $1.3 trillion by 2025.
- Bottled Water: Continues its reign as a top-performing category due to health consciousness and convenience, with a market share of approximately 20%. Key drivers include rising awareness of hydration benefits and the availability of flavored and functional water variants.
- Soft Drinks: Remains a significant player, though facing headwinds from health concerns, with innovation focusing on reduced sugar and natural ingredients.
- Packaged Juice: Exhibits steady growth, particularly in emerging markets, driven by perceived health benefits and convenient consumption.
- Energy & Sports Drinks: Shows impressive growth, especially among younger demographics and active lifestyle enthusiasts, propelled by product innovation and targeted marketing.
- RTD Tea and Coffee: A rapidly expanding segment, catering to the demand for convenient, on-the-go caffeine solutions and premium flavor profiles.
Alcoholic Beverages: While smaller in overall volume than non-alcoholic options, this segment commands higher per-unit value.
- Beer: Maintains its position as the largest alcoholic beverage category, with craft and premium segments experiencing substantial growth.
- Spirits: Demonstrates robust growth, driven by premiumization trends and the popularity of cocktails and flavored varieties.
- Wine: Exhibits stable demand, with a growing appreciation for organic and sustainable wines.
Distribution Channel Dominance:
Off-trade: This channel holds the dominant market share, accounting for over 70% of total beverage sales.
- Supermarkets/Hypermarkets: Remain the primary off-trade channel due to their extensive product variety and promotional activities.
- Convenience/Grocery Stores: Offer convenience and impulse purchases, particularly for single-serve beverages.
- Online Retail Stores: Experiencing explosive growth, driven by ease of access, subscription models, and the expansion of rapid delivery services. This channel is projected to capture over 15% of the market by 2025.
On-trade: While impacted by global events, the on-trade channel (restaurants, bars, hotels) is recovering and remains crucial for brand building and experiential consumption.
Beverages Market Product Developments
Product innovation in the beverages market is relentless, driven by consumer demand for healthier, more sustainable, and novel offerings. Functional beverages, fortified with vitamins, minerals, and adaptogens for targeted health benefits, are a major trend. Low-sugar and sugar-free alternatives are gaining traction across all categories, from soft drinks to alcoholic beverages. The rise of plant-based beverages, including oat, almond, and soy milk alternatives, continues to expand beyond traditional dairy replacements into new product formulations. RTD (Ready-to-Drink) formats are dominating, offering unparalleled convenience for consumers seeking on-the-go refreshment, with innovations in RTD tea, coffee, and even alcoholic beverages like hard seltzers and canned cocktails. Sustainable packaging solutions, such as biodegradable materials and refillable options, are becoming a key competitive advantage and a significant focus for R&D.
Key Drivers of Beverages Market Growth
The global beverages market is propelled by a confluence of powerful growth drivers. Economic growth and rising disposable incomes, particularly in emerging economies, are empowering consumers to spend more on a wider variety of beverage options. Evolving consumer preferences are a significant catalyst, with a pronounced shift towards health and wellness, leading to increased demand for functional beverages, low-sugar alternatives, and plant-based drinks. Technological advancements in processing, packaging, and e-commerce are enhancing product accessibility, shelf life, and consumer engagement. Urbanization is driving demand for convenient, on-the-go beverage solutions. Furthermore, strategic marketing and branding, coupled with innovative product launches, effectively stimulate consumer interest and drive sales.
Challenges in the Beverages Market Market
Despite robust growth, the beverages market faces several significant challenges. Increasing regulatory scrutiny surrounding sugar content, artificial ingredients, and alcohol advertising poses a continuous hurdle for product formulation and marketing strategies. Volatile raw material prices, including those for coffee, sugar, and fruits, can impact profitability and necessitate price adjustments. Intensifying competition from both global corporations and agile niche players requires constant innovation and effective differentiation. Supply chain disruptions, exacerbated by geopolitical events and climate change, can affect ingredient availability and logistics. Finally, growing consumer awareness regarding health and environmental impacts necessitates a constant adaptation to ethical sourcing, sustainable packaging, and the reduction of unhealthy ingredients, demanding significant investment in research and development.
Emerging Opportunities in Beverages Market
The beverages market is ripe with emerging opportunities for growth and innovation. The burgeoning functional beverage segment, offering health benefits beyond basic hydration, presents substantial potential as consumers seek personalized wellness solutions. The rapid expansion of online retail and direct-to-consumer (DTC) channels offers new avenues for market penetration and direct consumer engagement, particularly for niche and premium products. Sustainable and ethical sourcing is no longer a niche concern but a major market differentiator, creating opportunities for brands that can demonstrably commit to environmental and social responsibility. The growing demand for low- and no-alcohol beverage alternatives presents a significant untapped market. Furthermore, emerging markets in Asia and Africa offer immense potential for growth due to their expanding middle class and increasing beverage consumption.
Leading Players in the Beverages Market Sector
- Anheuser-Busch InBev
- Nestle S.A.
- PepsiCo Inc.
- The Coca-Cola Company
- Heineken N.V.
- Diageo plc
- Constellation Brands Inc.
- Suntory Holdings Limited
- Red Bull GmbH
- Keurig Dr Pepper
Key Milestones in Beverages Market Industry
- March 2023: Red Bull unveiled its Summer Edition product line in the United Kingdom, featuring an exciting new flavor - Juneberry. These Juneberry-flavored energy drinks are now widely accessible, being distributed across major retailers throughout the country. Consumers can enjoy them in both single-serving and multipack options.
- October 2022: VictoriaTM introduced Vicky Chamoy, a unique beer with a Mexican twist. Infused with the distinct flavors of chamoy, this beer offers a delightful blend of sweet, salty, spicy, and sour notes. Imported from Mexico, Vicky Chamoy is available in convenient 24-ounce single-serve cans.
- October 2022: Budweiser APAC opened its state-of-the-art brewery in Putian, China. This strategic move is part of Anheuser-Busch InBev's plan to drive economic growth in China and cater to the evolving preferences of consumers. Situated in the Fujian province, this Budweiser craft brewery stands as the largest of its kind in the Asia-Pacific region.
Strategic Outlook for Beverages Market Market
The strategic outlook for the beverages market remains exceptionally positive, characterized by innovation and adaptation. Key growth accelerators include a continued focus on health and wellness, driving the expansion of functional and low-sugar beverage categories. The increasing adoption of e-commerce and DTC models will reshape distribution strategies, emphasizing personalization and convenience. Sustainability will transition from a trend to a fundamental business imperative, influencing product development, packaging, and supply chain management. Strategic partnerships and acquisitions will continue to be vital for market players seeking to diversify portfolios, expand geographical reach, and access cutting-edge technologies. The exploration of novel ingredients and flavor profiles, coupled with a commitment to ethical sourcing and reduced environmental impact, will be crucial for long-term market leadership.
Beverages Market Segmentation
-
1. Product Type
-
1.1. Alcoholic Beverages
- 1.1.1. Beer
- 1.1.2. Wine
- 1.1.3. Spirits
-
1.2. Non-Alcoholic Beverages
- 1.2.1. Energy & Sports Drink
- 1.2.2. Soft Drinks
- 1.2.3. Bottled Water
- 1.2.4. Packaged Juice
- 1.2.5. RTD Tea and Coffee
- 1.2.6. Other Non-Alcoholic Beverages
-
1.1. Alcoholic Beverages
-
2. Distribution Channel
- 2.1. On-trade
-
2.2. Off-trade
- 2.2.1. Supermarkets/Hypermarkets
- 2.2.2. Convenience/Grocery Stores
- 2.2.3. Online Retail Stores
- 2.2.4. Other Off Trade Channels
Beverages Market Segmentation By Geography
-
1. North America
- 1.1. United States
- 1.2. Canada
- 1.3. Mexico
- 1.4. Rest of North America
-
2. Europe
- 2.1. United Kingdom
- 2.2. Germany
- 2.3. Spain
- 2.4. France
- 2.5. Italy
- 2.6. Russia
- 2.7. Rest of Europe
-
3. Asia Pacific
- 3.1. China
- 3.2. Japan
- 3.3. India
- 3.4. Australia
- 3.5. Rest of Asia Pacific
-
4. South America
- 4.1. Brazil
- 4.2. Argentina
- 4.3. Rest of South America
- 5. Middle East
-
6. Saudi Arabia
- 6.1. South Africa
- 6.2. Rest of Middle East
Beverages Market Regional Market Share
Geographic Coverage of Beverages Market
Beverages Market REPORT HIGHLIGHTS
| Aspects | Details |
|---|---|
| Study Period | 2020-2034 |
| Base Year | 2025 |
| Estimated Year | 2026 |
| Forecast Period | 2026-2034 |
| Historical Period | 2020-2025 |
| Growth Rate | CAGR of 4.7% from 2020-2034 |
| Segmentation |
|
Table of Contents
- 1. Introduction
- 1.1. Research Scope
- 1.2. Market Segmentation
- 1.3. Research Objective
- 1.4. Definitions and Assumptions
- 2. Executive Summary
- 2.1. Market Snapshot
- 3. Market Dynamics
- 3.1. Market Drivers
- 3.2. Market Restrains
- 3.3. Market Trends
- 3.4. Market Opportunities
- 4. Market Factor Analysis
- 4.1. Porters Five Forces
- 4.1.1. Bargaining Power of Suppliers
- 4.1.2. Bargaining Power of Buyers
- 4.1.3. Threat of New Entrants
- 4.1.4. Threat of Substitutes
- 4.1.5. Competitive Rivalry
- 4.2. PESTEL analysis
- 4.3. BCG Analysis
- 4.3.1. Stars (High Growth, High Market Share)
- 4.3.2. Cash Cows (Low Growth, High Market Share)
- 4.3.3. Question Mark (High Growth, Low Market Share)
- 4.3.4. Dogs (Low Growth, Low Market Share)
- 4.4. Ansoff Matrix Analysis
- 4.5. Supply Chain Analysis
- 4.6. Regulatory Landscape
- 4.7. Current Market Potential and Opportunity Assessment (TAM–SAM–SOM Framework)
- 4.8. MDP Analyst Note
- 4.1. Porters Five Forces
- 5. Market Analysis, Insights and Forecast 2021-2033
- 5.1. Market Analysis, Insights and Forecast - by Product Type
- 5.1.1. Alcoholic Beverages
- 5.1.1.1. Beer
- 5.1.1.2. Wine
- 5.1.1.3. Spirits
- 5.1.2. Non-Alcoholic Beverages
- 5.1.2.1. Energy & Sports Drink
- 5.1.2.2. Soft Drinks
- 5.1.2.3. Bottled Water
- 5.1.2.4. Packaged Juice
- 5.1.2.5. RTD Tea and Coffee
- 5.1.2.6. Other Non-Alcoholic Beverages
- 5.1.1. Alcoholic Beverages
- 5.2. Market Analysis, Insights and Forecast - by Distribution Channel
- 5.2.1. On-trade
- 5.2.2. Off-trade
- 5.2.2.1. Supermarkets/Hypermarkets
- 5.2.2.2. Convenience/Grocery Stores
- 5.2.2.3. Online Retail Stores
- 5.2.2.4. Other Off Trade Channels
- 5.3. Market Analysis, Insights and Forecast - by Region
- 5.3.1. North America
- 5.3.2. Europe
- 5.3.3. Asia Pacific
- 5.3.4. South America
- 5.3.5. Middle East
- 5.3.6. Saudi Arabia
- 5.1. Market Analysis, Insights and Forecast - by Product Type
- 6. Global Beverages Market Analysis, Insights and Forecast, 2021-2033
- 6.1. Market Analysis, Insights and Forecast - by Product Type
- 6.1.1. Alcoholic Beverages
- 6.1.1.1. Beer
- 6.1.1.2. Wine
- 6.1.1.3. Spirits
- 6.1.2. Non-Alcoholic Beverages
- 6.1.2.1. Energy & Sports Drink
- 6.1.2.2. Soft Drinks
- 6.1.2.3. Bottled Water
- 6.1.2.4. Packaged Juice
- 6.1.2.5. RTD Tea and Coffee
- 6.1.2.6. Other Non-Alcoholic Beverages
- 6.1.1. Alcoholic Beverages
- 6.2. Market Analysis, Insights and Forecast - by Distribution Channel
- 6.2.1. On-trade
- 6.2.2. Off-trade
- 6.2.2.1. Supermarkets/Hypermarkets
- 6.2.2.2. Convenience/Grocery Stores
- 6.2.2.3. Online Retail Stores
- 6.2.2.4. Other Off Trade Channels
- 6.1. Market Analysis, Insights and Forecast - by Product Type
- 7. North America Beverages Market Analysis, Insights and Forecast, 2020-2032
- 7.1. Market Analysis, Insights and Forecast - by Product Type
- 7.1.1. Alcoholic Beverages
- 7.1.1.1. Beer
- 7.1.1.2. Wine
- 7.1.1.3. Spirits
- 7.1.2. Non-Alcoholic Beverages
- 7.1.2.1. Energy & Sports Drink
- 7.1.2.2. Soft Drinks
- 7.1.2.3. Bottled Water
- 7.1.2.4. Packaged Juice
- 7.1.2.5. RTD Tea and Coffee
- 7.1.2.6. Other Non-Alcoholic Beverages
- 7.1.1. Alcoholic Beverages
- 7.2. Market Analysis, Insights and Forecast - by Distribution Channel
- 7.2.1. On-trade
- 7.2.2. Off-trade
- 7.2.2.1. Supermarkets/Hypermarkets
- 7.2.2.2. Convenience/Grocery Stores
- 7.2.2.3. Online Retail Stores
- 7.2.2.4. Other Off Trade Channels
- 7.1. Market Analysis, Insights and Forecast - by Product Type
- 8. Europe Beverages Market Analysis, Insights and Forecast, 2020-2032
- 8.1. Market Analysis, Insights and Forecast - by Product Type
- 8.1.1. Alcoholic Beverages
- 8.1.1.1. Beer
- 8.1.1.2. Wine
- 8.1.1.3. Spirits
- 8.1.2. Non-Alcoholic Beverages
- 8.1.2.1. Energy & Sports Drink
- 8.1.2.2. Soft Drinks
- 8.1.2.3. Bottled Water
- 8.1.2.4. Packaged Juice
- 8.1.2.5. RTD Tea and Coffee
- 8.1.2.6. Other Non-Alcoholic Beverages
- 8.1.1. Alcoholic Beverages
- 8.2. Market Analysis, Insights and Forecast - by Distribution Channel
- 8.2.1. On-trade
- 8.2.2. Off-trade
- 8.2.2.1. Supermarkets/Hypermarkets
- 8.2.2.2. Convenience/Grocery Stores
- 8.2.2.3. Online Retail Stores
- 8.2.2.4. Other Off Trade Channels
- 8.1. Market Analysis, Insights and Forecast - by Product Type
- 9. Asia Pacific Beverages Market Analysis, Insights and Forecast, 2020-2032
- 9.1. Market Analysis, Insights and Forecast - by Product Type
- 9.1.1. Alcoholic Beverages
- 9.1.1.1. Beer
- 9.1.1.2. Wine
- 9.1.1.3. Spirits
- 9.1.2. Non-Alcoholic Beverages
- 9.1.2.1. Energy & Sports Drink
- 9.1.2.2. Soft Drinks
- 9.1.2.3. Bottled Water
- 9.1.2.4. Packaged Juice
- 9.1.2.5. RTD Tea and Coffee
- 9.1.2.6. Other Non-Alcoholic Beverages
- 9.1.1. Alcoholic Beverages
- 9.2. Market Analysis, Insights and Forecast - by Distribution Channel
- 9.2.1. On-trade
- 9.2.2. Off-trade
- 9.2.2.1. Supermarkets/Hypermarkets
- 9.2.2.2. Convenience/Grocery Stores
- 9.2.2.3. Online Retail Stores
- 9.2.2.4. Other Off Trade Channels
- 9.1. Market Analysis, Insights and Forecast - by Product Type
- 10. South America Beverages Market Analysis, Insights and Forecast, 2020-2032
- 10.1. Market Analysis, Insights and Forecast - by Product Type
- 10.1.1. Alcoholic Beverages
- 10.1.1.1. Beer
- 10.1.1.2. Wine
- 10.1.1.3. Spirits
- 10.1.2. Non-Alcoholic Beverages
- 10.1.2.1. Energy & Sports Drink
- 10.1.2.2. Soft Drinks
- 10.1.2.3. Bottled Water
- 10.1.2.4. Packaged Juice
- 10.1.2.5. RTD Tea and Coffee
- 10.1.2.6. Other Non-Alcoholic Beverages
- 10.1.1. Alcoholic Beverages
- 10.2. Market Analysis, Insights and Forecast - by Distribution Channel
- 10.2.1. On-trade
- 10.2.2. Off-trade
- 10.2.2.1. Supermarkets/Hypermarkets
- 10.2.2.2. Convenience/Grocery Stores
- 10.2.2.3. Online Retail Stores
- 10.2.2.4. Other Off Trade Channels
- 10.1. Market Analysis, Insights and Forecast - by Product Type
- 11. Middle East Beverages Market Analysis, Insights and Forecast, 2020-2032
- 11.1. Market Analysis, Insights and Forecast - by Product Type
- 11.1.1. Alcoholic Beverages
- 11.1.1.1. Beer
- 11.1.1.2. Wine
- 11.1.1.3. Spirits
- 11.1.2. Non-Alcoholic Beverages
- 11.1.2.1. Energy & Sports Drink
- 11.1.2.2. Soft Drinks
- 11.1.2.3. Bottled Water
- 11.1.2.4. Packaged Juice
- 11.1.2.5. RTD Tea and Coffee
- 11.1.2.6. Other Non-Alcoholic Beverages
- 11.1.1. Alcoholic Beverages
- 11.2. Market Analysis, Insights and Forecast - by Distribution Channel
- 11.2.1. On-trade
- 11.2.2. Off-trade
- 11.2.2.1. Supermarkets/Hypermarkets
- 11.2.2.2. Convenience/Grocery Stores
- 11.2.2.3. Online Retail Stores
- 11.2.2.4. Other Off Trade Channels
- 11.1. Market Analysis, Insights and Forecast - by Product Type
- 12. Saudi Arabia Beverages Market Analysis, Insights and Forecast, 2020-2032
- 12.1. Market Analysis, Insights and Forecast - by Product Type
- 12.1.1. Alcoholic Beverages
- 12.1.1.1. Beer
- 12.1.1.2. Wine
- 12.1.1.3. Spirits
- 12.1.2. Non-Alcoholic Beverages
- 12.1.2.1. Energy & Sports Drink
- 12.1.2.2. Soft Drinks
- 12.1.2.3. Bottled Water
- 12.1.2.4. Packaged Juice
- 12.1.2.5. RTD Tea and Coffee
- 12.1.2.6. Other Non-Alcoholic Beverages
- 12.1.1. Alcoholic Beverages
- 12.2. Market Analysis, Insights and Forecast - by Distribution Channel
- 12.2.1. On-trade
- 12.2.2. Off-trade
- 12.2.2.1. Supermarkets/Hypermarkets
- 12.2.2.2. Convenience/Grocery Stores
- 12.2.2.3. Online Retail Stores
- 12.2.2.4. Other Off Trade Channels
- 12.1. Market Analysis, Insights and Forecast - by Product Type
- 13. Competitive Analysis
- 13.1. Company Profiles
- 13.1.1 Anheuser-Busch InBev
- 13.1.1.1. Company Overview
- 13.1.1.2. Products
- 13.1.1.3. Company Financials
- 13.1.1.4. SWOT Analysis
- 13.1.2 Nestle S A
- 13.1.2.1. Company Overview
- 13.1.2.2. Products
- 13.1.2.3. Company Financials
- 13.1.2.4. SWOT Analysis
- 13.1.3 PepsiCo Inc
- 13.1.3.1. Company Overview
- 13.1.3.2. Products
- 13.1.3.3. Company Financials
- 13.1.3.4. SWOT Analysis
- 13.1.4 Heineken N V
- 13.1.4.1. Company Overview
- 13.1.4.2. Products
- 13.1.4.3. Company Financials
- 13.1.4.4. SWOT Analysis
- 13.1.5 Constellation Brands Inc
- 13.1.5.1. Company Overview
- 13.1.5.2. Products
- 13.1.5.3. Company Financials
- 13.1.5.4. SWOT Analysis
- 13.1.6 Suntory Holdings Limited
- 13.1.6.1. Company Overview
- 13.1.6.2. Products
- 13.1.6.3. Company Financials
- 13.1.6.4. SWOT Analysis
- 13.1.7 Red Bull GmbH
- 13.1.7.1. Company Overview
- 13.1.7.2. Products
- 13.1.7.3. Company Financials
- 13.1.7.4. SWOT Analysis
- 13.1.8 Keurig Dr Pepper*List Not Exhaustive
- 13.1.8.1. Company Overview
- 13.1.8.2. Products
- 13.1.8.3. Company Financials
- 13.1.8.4. SWOT Analysis
- 13.1.9 The Coca-Cola Company
- 13.1.9.1. Company Overview
- 13.1.9.2. Products
- 13.1.9.3. Company Financials
- 13.1.9.4. SWOT Analysis
- 13.1.10 Diageo plc
- 13.1.10.1. Company Overview
- 13.1.10.2. Products
- 13.1.10.3. Company Financials
- 13.1.10.4. SWOT Analysis
- 13.1.1 Anheuser-Busch InBev
- 13.2. Market Entropy
- 13.2.1 Company's Key Areas Served
- 13.2.2 Recent Developments
- 13.3. Company Market Share Analysis 2025
- 13.3.1 Top 5 Companies Market Share Analysis
- 13.3.2 Top 3 Companies Market Share Analysis
- 13.4. List of Potential Customers
- 14. Research Methodology
List of Figures
- Figure 1: Global Beverages Market Revenue Breakdown (billion, %) by Region 2025 & 2033
- Figure 2: North America Beverages Market Revenue (billion), by Product Type 2025 & 2033
- Figure 3: North America Beverages Market Revenue Share (%), by Product Type 2025 & 2033
- Figure 4: North America Beverages Market Revenue (billion), by Distribution Channel 2025 & 2033
- Figure 5: North America Beverages Market Revenue Share (%), by Distribution Channel 2025 & 2033
- Figure 6: North America Beverages Market Revenue (billion), by Country 2025 & 2033
- Figure 7: North America Beverages Market Revenue Share (%), by Country 2025 & 2033
- Figure 8: Europe Beverages Market Revenue (billion), by Product Type 2025 & 2033
- Figure 9: Europe Beverages Market Revenue Share (%), by Product Type 2025 & 2033
- Figure 10: Europe Beverages Market Revenue (billion), by Distribution Channel 2025 & 2033
- Figure 11: Europe Beverages Market Revenue Share (%), by Distribution Channel 2025 & 2033
- Figure 12: Europe Beverages Market Revenue (billion), by Country 2025 & 2033
- Figure 13: Europe Beverages Market Revenue Share (%), by Country 2025 & 2033
- Figure 14: Asia Pacific Beverages Market Revenue (billion), by Product Type 2025 & 2033
- Figure 15: Asia Pacific Beverages Market Revenue Share (%), by Product Type 2025 & 2033
- Figure 16: Asia Pacific Beverages Market Revenue (billion), by Distribution Channel 2025 & 2033
- Figure 17: Asia Pacific Beverages Market Revenue Share (%), by Distribution Channel 2025 & 2033
- Figure 18: Asia Pacific Beverages Market Revenue (billion), by Country 2025 & 2033
- Figure 19: Asia Pacific Beverages Market Revenue Share (%), by Country 2025 & 2033
- Figure 20: South America Beverages Market Revenue (billion), by Product Type 2025 & 2033
- Figure 21: South America Beverages Market Revenue Share (%), by Product Type 2025 & 2033
- Figure 22: South America Beverages Market Revenue (billion), by Distribution Channel 2025 & 2033
- Figure 23: South America Beverages Market Revenue Share (%), by Distribution Channel 2025 & 2033
- Figure 24: South America Beverages Market Revenue (billion), by Country 2025 & 2033
- Figure 25: South America Beverages Market Revenue Share (%), by Country 2025 & 2033
- Figure 26: Middle East Beverages Market Revenue (billion), by Product Type 2025 & 2033
- Figure 27: Middle East Beverages Market Revenue Share (%), by Product Type 2025 & 2033
- Figure 28: Middle East Beverages Market Revenue (billion), by Distribution Channel 2025 & 2033
- Figure 29: Middle East Beverages Market Revenue Share (%), by Distribution Channel 2025 & 2033
- Figure 30: Middle East Beverages Market Revenue (billion), by Country 2025 & 2033
- Figure 31: Middle East Beverages Market Revenue Share (%), by Country 2025 & 2033
- Figure 32: Saudi Arabia Beverages Market Revenue (billion), by Product Type 2025 & 2033
- Figure 33: Saudi Arabia Beverages Market Revenue Share (%), by Product Type 2025 & 2033
- Figure 34: Saudi Arabia Beverages Market Revenue (billion), by Distribution Channel 2025 & 2033
- Figure 35: Saudi Arabia Beverages Market Revenue Share (%), by Distribution Channel 2025 & 2033
- Figure 36: Saudi Arabia Beverages Market Revenue (billion), by Country 2025 & 2033
- Figure 37: Saudi Arabia Beverages Market Revenue Share (%), by Country 2025 & 2033
List of Tables
- Table 1: Global Beverages Market Revenue billion Forecast, by Product Type 2020 & 2033
- Table 2: Global Beverages Market Revenue billion Forecast, by Distribution Channel 2020 & 2033
- Table 3: Global Beverages Market Revenue billion Forecast, by Region 2020 & 2033
- Table 4: Global Beverages Market Revenue billion Forecast, by Product Type 2020 & 2033
- Table 5: Global Beverages Market Revenue billion Forecast, by Distribution Channel 2020 & 2033
- Table 6: Global Beverages Market Revenue billion Forecast, by Country 2020 & 2033
- Table 7: United States Beverages Market Revenue (billion) Forecast, by Application 2020 & 2033
- Table 8: Canada Beverages Market Revenue (billion) Forecast, by Application 2020 & 2033
- Table 9: Mexico Beverages Market Revenue (billion) Forecast, by Application 2020 & 2033
- Table 10: Rest of North America Beverages Market Revenue (billion) Forecast, by Application 2020 & 2033
- Table 11: Global Beverages Market Revenue billion Forecast, by Product Type 2020 & 2033
- Table 12: Global Beverages Market Revenue billion Forecast, by Distribution Channel 2020 & 2033
- Table 13: Global Beverages Market Revenue billion Forecast, by Country 2020 & 2033
- Table 14: United Kingdom Beverages Market Revenue (billion) Forecast, by Application 2020 & 2033
- Table 15: Germany Beverages Market Revenue (billion) Forecast, by Application 2020 & 2033
- Table 16: Spain Beverages Market Revenue (billion) Forecast, by Application 2020 & 2033
- Table 17: France Beverages Market Revenue (billion) Forecast, by Application 2020 & 2033
- Table 18: Italy Beverages Market Revenue (billion) Forecast, by Application 2020 & 2033
- Table 19: Russia Beverages Market Revenue (billion) Forecast, by Application 2020 & 2033
- Table 20: Rest of Europe Beverages Market Revenue (billion) Forecast, by Application 2020 & 2033
- Table 21: Global Beverages Market Revenue billion Forecast, by Product Type 2020 & 2033
- Table 22: Global Beverages Market Revenue billion Forecast, by Distribution Channel 2020 & 2033
- Table 23: Global Beverages Market Revenue billion Forecast, by Country 2020 & 2033
- Table 24: China Beverages Market Revenue (billion) Forecast, by Application 2020 & 2033
- Table 25: Japan Beverages Market Revenue (billion) Forecast, by Application 2020 & 2033
- Table 26: India Beverages Market Revenue (billion) Forecast, by Application 2020 & 2033
- Table 27: Australia Beverages Market Revenue (billion) Forecast, by Application 2020 & 2033
- Table 28: Rest of Asia Pacific Beverages Market Revenue (billion) Forecast, by Application 2020 & 2033
- Table 29: Global Beverages Market Revenue billion Forecast, by Product Type 2020 & 2033
- Table 30: Global Beverages Market Revenue billion Forecast, by Distribution Channel 2020 & 2033
- Table 31: Global Beverages Market Revenue billion Forecast, by Country 2020 & 2033
- Table 32: Brazil Beverages Market Revenue (billion) Forecast, by Application 2020 & 2033
- Table 33: Argentina Beverages Market Revenue (billion) Forecast, by Application 2020 & 2033
- Table 34: Rest of South America Beverages Market Revenue (billion) Forecast, by Application 2020 & 2033
- Table 35: Global Beverages Market Revenue billion Forecast, by Product Type 2020 & 2033
- Table 36: Global Beverages Market Revenue billion Forecast, by Distribution Channel 2020 & 2033
- Table 37: Global Beverages Market Revenue billion Forecast, by Country 2020 & 2033
- Table 38: Global Beverages Market Revenue billion Forecast, by Product Type 2020 & 2033
- Table 39: Global Beverages Market Revenue billion Forecast, by Distribution Channel 2020 & 2033
- Table 40: Global Beverages Market Revenue billion Forecast, by Country 2020 & 2033
- Table 41: South Africa Beverages Market Revenue (billion) Forecast, by Application 2020 & 2033
- Table 42: Rest of Middle East Beverages Market Revenue (billion) Forecast, by Application 2020 & 2033
Frequently Asked Questions
1. What is the projected Compound Annual Growth Rate (CAGR) of the Beverages Market?
The projected CAGR is approximately 4.7%.
2. Which companies are prominent players in the Beverages Market?
Key companies in the market include Anheuser-Busch InBev, Nestle S A, PepsiCo Inc, Heineken N V, Constellation Brands Inc, Suntory Holdings Limited, Red Bull GmbH, Keurig Dr Pepper*List Not Exhaustive, The Coca-Cola Company, Diageo plc.
3. What are the main segments of the Beverages Market?
The market segments include Product Type, Distribution Channel.
4. Can you provide details about the market size?
The market size is estimated to be USD 164.7 billion as of 2022.
5. What are some drivers contributing to market growth?
Preference for Plant-based and Clean-label RTD Products; Consumer Inclination Toward Sugar-Free Drinks.
6. What are the notable trends driving market growth?
Consumer Inclination Toward Sugar-Free Drinks.
7. Are there any restraints impacting market growth?
Concerns Over Health Issues Associated With Beverages.
8. Can you provide examples of recent developments in the market?
March 2023: Red Bull unveiled its Summer Edition product line in the United Kingdom, featuring an exciting new flavor - Juneberry. These Juneberry-flavored energy drinks are now widely accessible, being distributed across major retailers throughout the country. Consumers can enjoy them in both single-serving and multipack options.
9. What pricing options are available for accessing the report?
Pricing options include single-user, multi-user, and enterprise licenses priced at USD 4750, USD 5250, and USD 8750 respectively.
10. Is the market size provided in terms of value or volume?
The market size is provided in terms of value, measured in billion.
11. Are there any specific market keywords associated with the report?
Yes, the market keyword associated with the report is "Beverages Market," which aids in identifying and referencing the specific market segment covered.
12. How do I determine which pricing option suits my needs best?
The pricing options vary based on user requirements and access needs. Individual users may opt for single-user licenses, while businesses requiring broader access may choose multi-user or enterprise licenses for cost-effective access to the report.
13. Are there any additional resources or data provided in the Beverages Market report?
While the report offers comprehensive insights, it's advisable to review the specific contents or supplementary materials provided to ascertain if additional resources or data are available.
14. How can I stay updated on further developments or reports in the Beverages Market?
To stay informed about further developments, trends, and reports in the Beverages Market, consider subscribing to industry newsletters, following relevant companies and organizations, or regularly checking reputable industry news sources and publications.
Methodology
Step 1 - Identification of Relevant Samples Size from Population Database


Step 2 - Approaches for Defining Global Market Size (Value, Volume* & Price*)

Note*: In applicable scenarios
Step 3 - Data Sources
Primary Research
- Web Analytics
- Survey Reports
- Research Institute
- Latest Research Reports
- Opinion Leaders
Secondary Research
- Annual Reports
- White Paper
- Latest Press Release
- Industry Association
- Paid Database
- Investor Presentations

Step 4 - Data Triangulation
Involves using different sources of information in order to increase the validity of a study
These sources are likely to be stakeholders in a program - participants, other researchers, program staff, other community members, and so on.
Then we put all data in single framework & apply various statistical tools to find out the dynamic on the market.
During the analysis stage, feedback from the stakeholder groups would be compared to determine areas of agreement as well as areas of divergence