

Key Insights
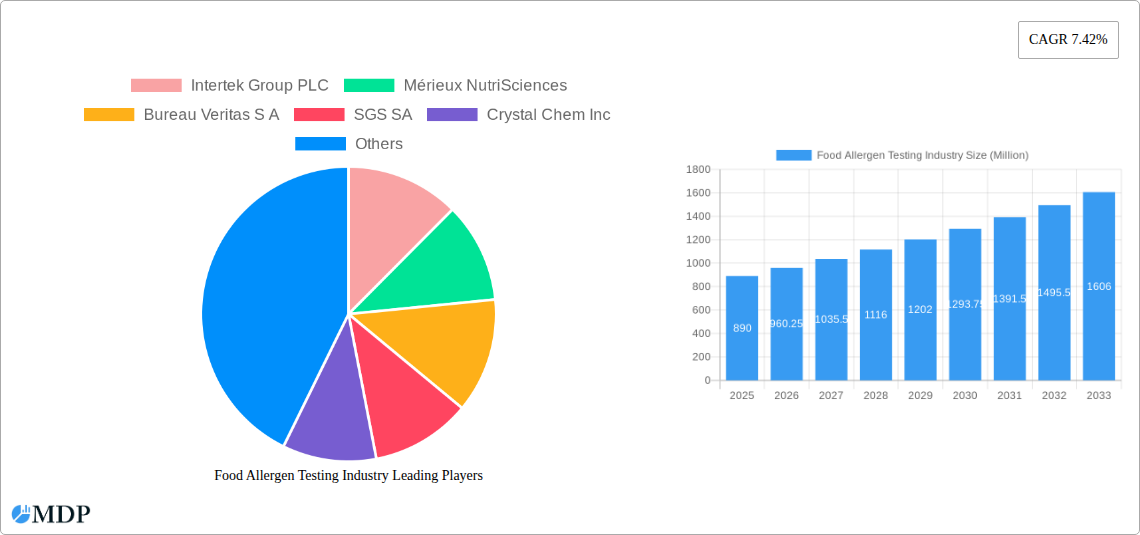
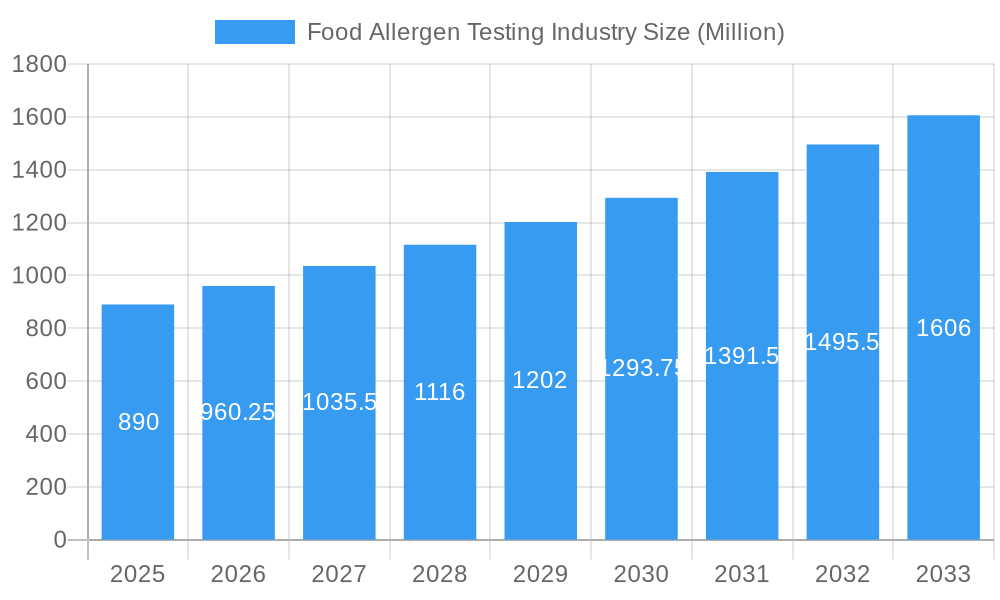
The global Food Allergen Testing market is poised for significant expansion, currently valued at approximately $890 million and projected to reach an estimated $2.7 billion by 2033, exhibiting a robust Compound Annual Growth Rate (CAGR) of 7.42%. This growth is primarily fueled by increasing consumer awareness regarding food allergies, stringent government regulations mandating accurate allergen labeling, and a rising incidence of foodborne illnesses. The demand for comprehensive allergen detection is paramount across various food sectors, with Seafood and Meat Products, Dairy Products, and Baby Food and Infant Formula segments leading the charge due to the critical nature of allergen management in these categories. Technological advancements, particularly in Immunoassay-based and PCR-based testing methods, are enhancing sensitivity, speed, and accuracy, further propelling market adoption. The industry is witnessing a surge in investments from key players like Eurofins Scientific SE, Mérieux NutriSciences, and SGS SA, who are actively expanding their testing capabilities and geographical reach.
Food Allergen Testing Industry Market Size (In Million)
The market's expansion is strategically driven by a growing emphasis on food safety and quality assurance. Heightened consumer demand for transparent food supply chains, coupled with the proactive stance of regulatory bodies worldwide, necessitates sophisticated allergen testing solutions. Emerging economies, particularly in the Asia Pacific region, represent significant growth opportunities owing to the rapid expansion of their food processing industries and increasing disposable incomes. While the market benefits from strong demand drivers, certain restraints such as the high cost of advanced testing equipment and the need for skilled personnel could pose challenges. Nevertheless, ongoing research and development efforts are focused on making these solutions more accessible and cost-effective. The competitive landscape is characterized by strategic collaborations, mergers, and acquisitions aimed at consolidating market presence and enhancing service offerings, ensuring continued innovation and market penetration.
Food Allergen Testing Industry Company Market Share
This in-depth report offers a definitive analysis of the global Food Allergen Testing market, providing crucial insights for industry stakeholders, manufacturers, regulatory bodies, and investors. Covering the historical period from 2019 to 2024 and projecting growth through 2033, with a base and estimated year of 2025, this research delves into market dynamics, emerging trends, leading segments, and the competitive landscape. Discover actionable intelligence to navigate this rapidly evolving sector, driven by increasing consumer awareness, stringent regulations, and technological advancements in food safety. The global market size is projected to reach over 10 Billion by 2033.
Food Allergen Testing Industry Market Dynamics & Concentration
The Food Allergen Testing market exhibits a moderate to high concentration, with key players investing heavily in R&D to maintain a competitive edge. Innovation drivers are primarily fueled by the escalating demand for accurate and rapid allergen detection methods, the need to comply with increasingly stringent global food safety regulations, and a growing consumer preference for allergen-free products. Regulatory frameworks, such as those from the FDA, EFSA, and Codex Alimentarius, play a pivotal role in shaping market demand and dictating testing protocols. Product substitutes, while present, often fall short in terms of specificity, sensitivity, and regulatory acceptance. End-user trends are strongly influenced by consumer demand for transparency, the rise of private labeling for allergen-free goods, and the proactive stance of food manufacturers in preventing cross-contamination. Mergers and acquisitions (M&A) activities are a significant indicator of market consolidation and strategic expansion, with an estimated XX M&A deals recorded during the historical period, bolstering market share for acquiring entities. Leading companies are actively pursuing M&A to broaden their service portfolios and geographical reach.
Food Allergen Testing Industry Industry Trends & Analysis
The Food Allergen Testing industry is on a robust growth trajectory, propelled by a confluence of factors that underscore its critical importance in global food safety. The Compound Annual Growth Rate (CAGR) is estimated to be approximately XX% from 2025 to 2033. Market penetration is steadily increasing as regulatory mandates become more pervasive and food manufacturers prioritize stringent quality control to safeguard consumer health and brand reputation. A significant driver is the escalating prevalence of food allergies and intolerances worldwide, creating a sustained demand for reliable testing solutions. Technological disruptions are at the forefront, with advancements in immunoassay-based (ELISA) and PCR-based methodologies offering enhanced sensitivity, specificity, and faster turnaround times, thereby reducing the risk of costly recalls and reputational damage. Consumer preferences are shifting towards greater transparency regarding ingredients and potential allergens, compelling food producers to adopt comprehensive allergen management strategies, including rigorous testing. Competitive dynamics are characterized by intense innovation, strategic collaborations between testing service providers and equipment manufacturers, and a constant focus on developing cost-effective and user-friendly testing kits. The integration of advanced data analytics and artificial intelligence in interpreting test results further optimizes the food safety ecosystem.
Leading Markets & Segments in Food Allergen Testing Industry
The North America region currently dominates the Food Allergen Testing market, driven by stringent regulatory policies, high consumer awareness regarding food allergies, and a well-established food manufacturing sector. Within North America, the United States spearheads market growth due to its large consumer base, proactive regulatory bodies, and significant investments in food safety research and development.
Technology Dominance:
- Immunoassay-based / ELISA: This technology segment holds a substantial market share due to its established reliability, cost-effectiveness, and suitability for detecting a wide range of allergens. Its widespread adoption across various food matrices and its ability to deliver semi-quantitative results make it a preferred choice for routine testing.
- PCR (Polymerase Chain Reaction)-based: While often more expensive, PCR-based technologies are gaining traction due to their exceptional sensitivity, specificity, and ability to detect DNA, which is crucial for identifying allergenic ingredients, especially in highly processed foods or when traditional protein-based methods might fail. The growing demand for detecting processed allergens and distinguishing between similar ingredients fuels its growth.
- Other Technologies: This segment encompasses emerging technologies like mass spectrometry and biosensors, which offer advanced capabilities in multiplexing and rapid detection. Their growing adoption is attributed to the need for more sophisticated and comprehensive allergen profiling.
Application Dominance:
- Dairy Products: This segment is a significant contributor to the market size due to the high prevalence of dairy allergies, particularly among infants and children. The extensive use of dairy in processed foods necessitates rigorous testing for casein, whey, and lactose.
- Bakery and Confectionery: The widespread use of allergens like gluten, nuts, and dairy in baked goods and confectionery products makes this application segment a major driver of allergen testing demand. Stringent labeling requirements for these categories further boost testing volumes.
- Seafood and Meat Products: With increasing awareness of fish and shellfish allergies, this segment is witnessing consistent demand for accurate testing. The potential for cross-contamination during processing also contributes to the need for robust allergen testing protocols.
- Baby Food and Infant Formula: Given the vulnerability of infants to allergens, this segment is under intense regulatory scrutiny, leading to a high demand for comprehensive and sensitive allergen testing to ensure product safety.
- Beverages: While historically a smaller segment, the increasing use of allergenic ingredients in beverages (e.g., soy, milk, nuts) is driving its growth. The complexity of beverage formulations necessitates thorough allergen checks.
Food Allergen Testing Industry Product Developments
The Food Allergen Testing market is continuously evolving with innovative product developments aimed at enhancing accuracy, speed, and ease of use. Recent advancements include the launch of highly sensitive lateral flow devices, like Gold Standard Diagnostics' SENSIStrip Gluten PowerLine, which offer rapid detection of gluten residues in various food matrices, rinse water, and swabs. These developments focus on simplifying testing protocols for on-site use and improving the detection limits for critical allergens. Furthermore, integrated laboratory services are expanding, with companies like ALS and Mérieux NutriSciences investing in new facilities and expanding their geographical presence to offer comprehensive food analysis solutions, strengthening their competitive advantage by providing end-to-end services that address a broader spectrum of food safety concerns.
Key Drivers of Food Allergen Testing Industry Growth
The growth of the Food Allergen Testing industry is propelled by several interconnected factors. Stringent global food safety regulations, such as those mandated by the FDA and EFSA, necessitate comprehensive allergen testing to protect consumers. The increasing global incidence of food allergies and intolerances directly translates to a higher demand for accurate detection methods. Technological advancements, particularly in immunoassay and PCR techniques, are offering more sensitive, specific, and rapid testing solutions, reducing false positives and negatives. Growing consumer awareness and demand for transparent food labeling are pushing manufacturers to invest more in allergen testing to build trust and brand loyalty. Economic factors, including rising disposable incomes in developing nations, lead to increased consumption of processed foods, which often require more extensive allergen management.
Challenges in the Food Allergen Testing Industry Market
Despite its robust growth, the Food Allergen Testing market faces several challenges. High implementation costs for advanced testing technologies can be a barrier for small and medium-sized enterprises (SMEs). The complexity of food matrices can sometimes lead to challenges in sample preparation and accurate detection. Evolving regulatory landscapes across different regions require continuous adaptation and investment in compliance. Furthermore, the risk of cross-contamination throughout the supply chain, from farm to fork, presents an ongoing operational challenge for food producers and testing laboratories alike. The development of new, often unexpected, allergens or cross-reactive substances also necessitates ongoing research and development in testing methodologies.
Emerging Opportunities in Food Allergen Testing Industry
Emerging opportunities in the Food Allergen Testing industry are driven by several catalysts. The development of multiplex testing platforms, capable of detecting multiple allergens simultaneously, offers significant efficiency gains and cost reductions. Strategic partnerships between testing service providers, technology developers, and food manufacturers are crucial for co-creating innovative solutions tailored to specific industry needs. Expansion into emerging economies with growing food processing sectors and increasing regulatory oversight presents a substantial market expansion opportunity. The growing trend of personalized nutrition and the demand for allergen-free diets also open new avenues for specialized testing services. Furthermore, advancements in digital solutions and AI for data analysis and risk assessment are creating opportunities for more predictive and proactive food safety management.
Leading Players in the Food Allergen Testing Industry Sector
- Intertek Group PLC
- Mérieux NutriSciences
- Bureau Veritas S A
- SGS SA
- Crystal Chem Inc
- Lifeasible
- ALS Limited
- Microbac Laboratories Inc
- Eurofins Scientific SE
- Neogen Corporation
Key Milestones in Food Allergen Testing Industry Industry
- March 2024: Gold Standard Diagnostics launched the SENSIStrip Gluten PowerLine Lateral Flow Device, enhancing gluten detection capabilities.
- March 2024: ALS strategically expanded its European and USA Life Sciences presence through the acquisition of York Analytical Laboratories and Wessling Holding GmbH & Co.
- February 2024: Mérieux NutriSciences inaugurated a new, accredited food analysis laboratory in Maringá, Brazil, reinforcing its commitment to supporting the South American food industry.
Strategic Outlook for Food Allergen Testing Industry Market
The strategic outlook for the Food Allergen Testing market is overwhelmingly positive, fueled by ongoing innovation and increasing global emphasis on food safety. Key growth accelerators include the continuous development of more sensitive, rapid, and cost-effective testing technologies, such as advanced PCR and biosensor applications. Strategic alliances and collaborations between industry players will be crucial for market penetration and to address complex allergen challenges. The expansion of services into developing markets, coupled with the growing demand for allergen-free products driven by consumer awareness and health trends, will further propel market expansion. Embracing digital transformation for data management, analysis, and traceability will also be a critical component of future success, positioning companies to offer comprehensive solutions that go beyond basic testing.
Food Allergen Testing Industry Segmentation
-
1. Technology
- 1.1. Immunoassay-based /ELISA
- 1.2. PCR (Polymerase Chain Reaction)-based
- 1.3. Other Technologies
-
2. Application
- 2.1. Seafood and Meat Products
- 2.2. Dairy Products
- 2.3. Beverages
- 2.4. Bakery and Confectionery
- 2.5. Baby Food and Infant Formula
- 2.6. Other Applications
Food Allergen Testing Industry Segmentation By Geography
-
1. North America
- 1.1. United States
- 1.2. Canada
- 1.3. Mexico
- 1.4. Rest of North America
-
2. Europe
- 2.1. Germany
- 2.2. United Kingdom
- 2.3. France
- 2.4. Russia
- 2.5. Spain
- 2.6. Italy
- 2.7. Rest of Europe
-
3. Asia Pacific
- 3.1. India
- 3.2. China
- 3.3. Japan
- 3.4. Australia
- 3.5. Rest of Asia Pacific
-
4. South America
- 4.1. Brazil
- 4.2. Argentina
- 4.3. Rest of South America
-
5. Middle East and Africa
- 5.1. South Africa
- 5.2. Saudi Arabia
- 5.3. Rest of Middle East and Africa
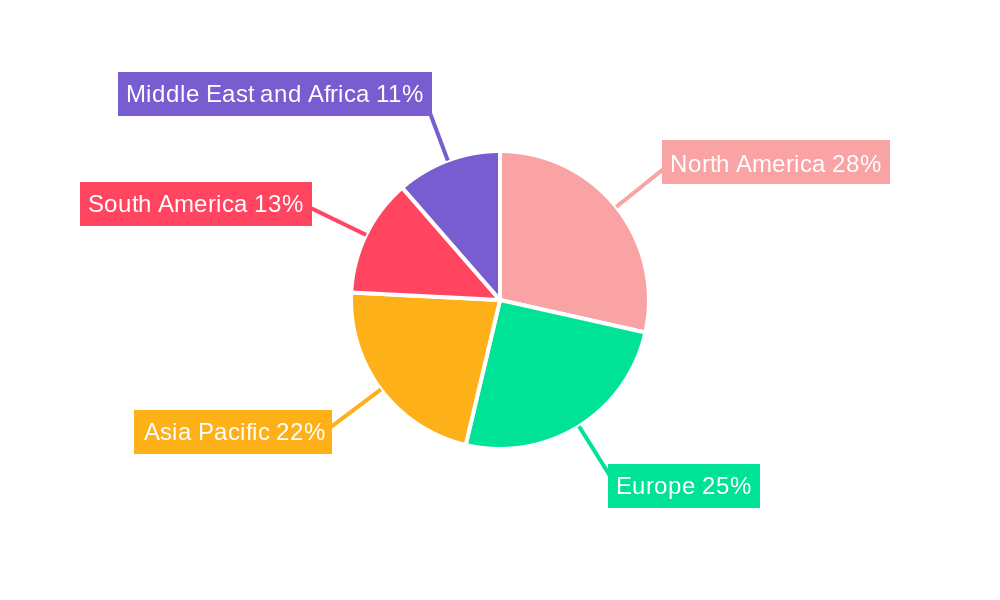
Food Allergen Testing Industry Regional Market Share
Geographic Coverage of Food Allergen Testing Industry
Food Allergen Testing Industry REPORT HIGHLIGHTS
| Aspects | Details |
|---|---|
| Study Period | 2020-2034 |
| Base Year | 2025 |
| Estimated Year | 2026 |
| Forecast Period | 2026-2034 |
| Historical Period | 2020-2025 |
| Growth Rate | CAGR of 7.42% from 2020-2034 |
| Segmentation |
|
Table of Contents
- 1. Introduction
- 1.1. Research Scope
- 1.2. Market Segmentation
- 1.3. Research Objective
- 1.4. Definitions and Assumptions
- 2. Executive Summary
- 2.1. Market Snapshot
- 3. Market Dynamics
- 3.1. Market Drivers
- 3.2. Market Restrains
- 3.3. Market Trends
- 3.4. Market Opportunities
- 4. Market Factor Analysis
- 4.1. Porters Five Forces
- 4.1.1. Bargaining Power of Suppliers
- 4.1.2. Bargaining Power of Buyers
- 4.1.3. Threat of New Entrants
- 4.1.4. Threat of Substitutes
- 4.1.5. Competitive Rivalry
- 4.2. PESTEL analysis
- 4.3. BCG Analysis
- 4.3.1. Stars (High Growth, High Market Share)
- 4.3.2. Cash Cows (Low Growth, High Market Share)
- 4.3.3. Question Mark (High Growth, Low Market Share)
- 4.3.4. Dogs (Low Growth, Low Market Share)
- 4.4. Ansoff Matrix Analysis
- 4.5. Supply Chain Analysis
- 4.6. Regulatory Landscape
- 4.7. Current Market Potential and Opportunity Assessment (TAM–SAM–SOM Framework)
- 4.8. MDP Analyst Note
- 4.1. Porters Five Forces
- 5. Market Analysis, Insights and Forecast 2021-2033
- 5.1. Market Analysis, Insights and Forecast - by Technology
- 5.1.1. Immunoassay-based /ELISA
- 5.1.2. PCR (Polymerase Chain Reaction)-based
- 5.1.3. Other Technologies
- 5.2. Market Analysis, Insights and Forecast - by Application
- 5.2.1. Seafood and Meat Products
- 5.2.2. Dairy Products
- 5.2.3. Beverages
- 5.2.4. Bakery and Confectionery
- 5.2.5. Baby Food and Infant Formula
- 5.2.6. Other Applications
- 5.3. Market Analysis, Insights and Forecast - by Region
- 5.3.1. North America
- 5.3.2. Europe
- 5.3.3. Asia Pacific
- 5.3.4. South America
- 5.3.5. Middle East and Africa
- 5.1. Market Analysis, Insights and Forecast - by Technology
- 6. Global Food Allergen Testing Industry Analysis, Insights and Forecast, 2021-2033
- 6.1. Market Analysis, Insights and Forecast - by Technology
- 6.1.1. Immunoassay-based /ELISA
- 6.1.2. PCR (Polymerase Chain Reaction)-based
- 6.1.3. Other Technologies
- 6.2. Market Analysis, Insights and Forecast - by Application
- 6.2.1. Seafood and Meat Products
- 6.2.2. Dairy Products
- 6.2.3. Beverages
- 6.2.4. Bakery and Confectionery
- 6.2.5. Baby Food and Infant Formula
- 6.2.6. Other Applications
- 6.1. Market Analysis, Insights and Forecast - by Technology
- 7. North America Food Allergen Testing Industry Analysis, Insights and Forecast, 2020-2032
- 7.1. Market Analysis, Insights and Forecast - by Technology
- 7.1.1. Immunoassay-based /ELISA
- 7.1.2. PCR (Polymerase Chain Reaction)-based
- 7.1.3. Other Technologies
- 7.2. Market Analysis, Insights and Forecast - by Application
- 7.2.1. Seafood and Meat Products
- 7.2.2. Dairy Products
- 7.2.3. Beverages
- 7.2.4. Bakery and Confectionery
- 7.2.5. Baby Food and Infant Formula
- 7.2.6. Other Applications
- 7.1. Market Analysis, Insights and Forecast - by Technology
- 8. Europe Food Allergen Testing Industry Analysis, Insights and Forecast, 2020-2032
- 8.1. Market Analysis, Insights and Forecast - by Technology
- 8.1.1. Immunoassay-based /ELISA
- 8.1.2. PCR (Polymerase Chain Reaction)-based
- 8.1.3. Other Technologies
- 8.2. Market Analysis, Insights and Forecast - by Application
- 8.2.1. Seafood and Meat Products
- 8.2.2. Dairy Products
- 8.2.3. Beverages
- 8.2.4. Bakery and Confectionery
- 8.2.5. Baby Food and Infant Formula
- 8.2.6. Other Applications
- 8.1. Market Analysis, Insights and Forecast - by Technology
- 9. Asia Pacific Food Allergen Testing Industry Analysis, Insights and Forecast, 2020-2032
- 9.1. Market Analysis, Insights and Forecast - by Technology
- 9.1.1. Immunoassay-based /ELISA
- 9.1.2. PCR (Polymerase Chain Reaction)-based
- 9.1.3. Other Technologies
- 9.2. Market Analysis, Insights and Forecast - by Application
- 9.2.1. Seafood and Meat Products
- 9.2.2. Dairy Products
- 9.2.3. Beverages
- 9.2.4. Bakery and Confectionery
- 9.2.5. Baby Food and Infant Formula
- 9.2.6. Other Applications
- 9.1. Market Analysis, Insights and Forecast - by Technology
- 10. South America Food Allergen Testing Industry Analysis, Insights and Forecast, 2020-2032
- 10.1. Market Analysis, Insights and Forecast - by Technology
- 10.1.1. Immunoassay-based /ELISA
- 10.1.2. PCR (Polymerase Chain Reaction)-based
- 10.1.3. Other Technologies
- 10.2. Market Analysis, Insights and Forecast - by Application
- 10.2.1. Seafood and Meat Products
- 10.2.2. Dairy Products
- 10.2.3. Beverages
- 10.2.4. Bakery and Confectionery
- 10.2.5. Baby Food and Infant Formula
- 10.2.6. Other Applications
- 10.1. Market Analysis, Insights and Forecast - by Technology
- 11. Middle East and Africa Food Allergen Testing Industry Analysis, Insights and Forecast, 2020-2032
- 11.1. Market Analysis, Insights and Forecast - by Technology
- 11.1.1. Immunoassay-based /ELISA
- 11.1.2. PCR (Polymerase Chain Reaction)-based
- 11.1.3. Other Technologies
- 11.2. Market Analysis, Insights and Forecast - by Application
- 11.2.1. Seafood and Meat Products
- 11.2.2. Dairy Products
- 11.2.3. Beverages
- 11.2.4. Bakery and Confectionery
- 11.2.5. Baby Food and Infant Formula
- 11.2.6. Other Applications
- 11.1. Market Analysis, Insights and Forecast - by Technology
- 12. Competitive Analysis
- 12.1. Company Profiles
- 12.1.1 Intertek Group PLC
- 12.1.1.1. Company Overview
- 12.1.1.2. Products
- 12.1.1.3. Company Financials
- 12.1.1.4. SWOT Analysis
- 12.1.2 Mérieux NutriSciences
- 12.1.2.1. Company Overview
- 12.1.2.2. Products
- 12.1.2.3. Company Financials
- 12.1.2.4. SWOT Analysis
- 12.1.3 Bureau Veritas S A
- 12.1.3.1. Company Overview
- 12.1.3.2. Products
- 12.1.3.3. Company Financials
- 12.1.3.4. SWOT Analysis
- 12.1.4 SGS SA
- 12.1.4.1. Company Overview
- 12.1.4.2. Products
- 12.1.4.3. Company Financials
- 12.1.4.4. SWOT Analysis
- 12.1.5 Crystal Chem Inc
- 12.1.5.1. Company Overview
- 12.1.5.2. Products
- 12.1.5.3. Company Financials
- 12.1.5.4. SWOT Analysis
- 12.1.6 Lifeasible
- 12.1.6.1. Company Overview
- 12.1.6.2. Products
- 12.1.6.3. Company Financials
- 12.1.6.4. SWOT Analysis
- 12.1.7 ALS Limited
- 12.1.7.1. Company Overview
- 12.1.7.2. Products
- 12.1.7.3. Company Financials
- 12.1.7.4. SWOT Analysis
- 12.1.8 Microbac Laboratories Inc
- 12.1.8.1. Company Overview
- 12.1.8.2. Products
- 12.1.8.3. Company Financials
- 12.1.8.4. SWOT Analysis
- 12.1.9 Eurofins Scientific SE
- 12.1.9.1. Company Overview
- 12.1.9.2. Products
- 12.1.9.3. Company Financials
- 12.1.9.4. SWOT Analysis
- 12.1.10 Neogen Corporation
- 12.1.10.1. Company Overview
- 12.1.10.2. Products
- 12.1.10.3. Company Financials
- 12.1.10.4. SWOT Analysis
- 12.1.1 Intertek Group PLC
- 12.2. Market Entropy
- 12.2.1 Company's Key Areas Served
- 12.2.2 Recent Developments
- 12.3. Company Market Share Analysis 2025
- 12.3.1 Top 5 Companies Market Share Analysis
- 12.3.2 Top 3 Companies Market Share Analysis
- 12.4. List of Potential Customers
- 13. Research Methodology
List of Figures
- Figure 1: Global Food Allergen Testing Industry Revenue Breakdown (Million, %) by Region 2025 & 2033
- Figure 2: North America Food Allergen Testing Industry Revenue (Million), by Technology 2025 & 2033
- Figure 3: North America Food Allergen Testing Industry Revenue Share (%), by Technology 2025 & 2033
- Figure 4: North America Food Allergen Testing Industry Revenue (Million), by Application 2025 & 2033
- Figure 5: North America Food Allergen Testing Industry Revenue Share (%), by Application 2025 & 2033
- Figure 6: North America Food Allergen Testing Industry Revenue (Million), by Country 2025 & 2033
- Figure 7: North America Food Allergen Testing Industry Revenue Share (%), by Country 2025 & 2033
- Figure 8: Europe Food Allergen Testing Industry Revenue (Million), by Technology 2025 & 2033
- Figure 9: Europe Food Allergen Testing Industry Revenue Share (%), by Technology 2025 & 2033
- Figure 10: Europe Food Allergen Testing Industry Revenue (Million), by Application 2025 & 2033
- Figure 11: Europe Food Allergen Testing Industry Revenue Share (%), by Application 2025 & 2033
- Figure 12: Europe Food Allergen Testing Industry Revenue (Million), by Country 2025 & 2033
- Figure 13: Europe Food Allergen Testing Industry Revenue Share (%), by Country 2025 & 2033
- Figure 14: Asia Pacific Food Allergen Testing Industry Revenue (Million), by Technology 2025 & 2033
- Figure 15: Asia Pacific Food Allergen Testing Industry Revenue Share (%), by Technology 2025 & 2033
- Figure 16: Asia Pacific Food Allergen Testing Industry Revenue (Million), by Application 2025 & 2033
- Figure 17: Asia Pacific Food Allergen Testing Industry Revenue Share (%), by Application 2025 & 2033
- Figure 18: Asia Pacific Food Allergen Testing Industry Revenue (Million), by Country 2025 & 2033
- Figure 19: Asia Pacific Food Allergen Testing Industry Revenue Share (%), by Country 2025 & 2033
- Figure 20: South America Food Allergen Testing Industry Revenue (Million), by Technology 2025 & 2033
- Figure 21: South America Food Allergen Testing Industry Revenue Share (%), by Technology 2025 & 2033
- Figure 22: South America Food Allergen Testing Industry Revenue (Million), by Application 2025 & 2033
- Figure 23: South America Food Allergen Testing Industry Revenue Share (%), by Application 2025 & 2033
- Figure 24: South America Food Allergen Testing Industry Revenue (Million), by Country 2025 & 2033
- Figure 25: South America Food Allergen Testing Industry Revenue Share (%), by Country 2025 & 2033
- Figure 26: Middle East and Africa Food Allergen Testing Industry Revenue (Million), by Technology 2025 & 2033
- Figure 27: Middle East and Africa Food Allergen Testing Industry Revenue Share (%), by Technology 2025 & 2033
- Figure 28: Middle East and Africa Food Allergen Testing Industry Revenue (Million), by Application 2025 & 2033
- Figure 29: Middle East and Africa Food Allergen Testing Industry Revenue Share (%), by Application 2025 & 2033
- Figure 30: Middle East and Africa Food Allergen Testing Industry Revenue (Million), by Country 2025 & 2033
- Figure 31: Middle East and Africa Food Allergen Testing Industry Revenue Share (%), by Country 2025 & 2033
List of Tables
- Table 1: Global Food Allergen Testing Industry Revenue Million Forecast, by Technology 2020 & 2033
- Table 2: Global Food Allergen Testing Industry Revenue Million Forecast, by Application 2020 & 2033
- Table 3: Global Food Allergen Testing Industry Revenue Million Forecast, by Region 2020 & 2033
- Table 4: Global Food Allergen Testing Industry Revenue Million Forecast, by Technology 2020 & 2033
- Table 5: Global Food Allergen Testing Industry Revenue Million Forecast, by Application 2020 & 2033
- Table 6: Global Food Allergen Testing Industry Revenue Million Forecast, by Country 2020 & 2033
- Table 7: United States Food Allergen Testing Industry Revenue (Million) Forecast, by Application 2020 & 2033
- Table 8: Canada Food Allergen Testing Industry Revenue (Million) Forecast, by Application 2020 & 2033
- Table 9: Mexico Food Allergen Testing Industry Revenue (Million) Forecast, by Application 2020 & 2033
- Table 10: Rest of North America Food Allergen Testing Industry Revenue (Million) Forecast, by Application 2020 & 2033
- Table 11: Global Food Allergen Testing Industry Revenue Million Forecast, by Technology 2020 & 2033
- Table 12: Global Food Allergen Testing Industry Revenue Million Forecast, by Application 2020 & 2033
- Table 13: Global Food Allergen Testing Industry Revenue Million Forecast, by Country 2020 & 2033
- Table 14: Germany Food Allergen Testing Industry Revenue (Million) Forecast, by Application 2020 & 2033
- Table 15: United Kingdom Food Allergen Testing Industry Revenue (Million) Forecast, by Application 2020 & 2033
- Table 16: France Food Allergen Testing Industry Revenue (Million) Forecast, by Application 2020 & 2033
- Table 17: Russia Food Allergen Testing Industry Revenue (Million) Forecast, by Application 2020 & 2033
- Table 18: Spain Food Allergen Testing Industry Revenue (Million) Forecast, by Application 2020 & 2033
- Table 19: Italy Food Allergen Testing Industry Revenue (Million) Forecast, by Application 2020 & 2033
- Table 20: Rest of Europe Food Allergen Testing Industry Revenue (Million) Forecast, by Application 2020 & 2033
- Table 21: Global Food Allergen Testing Industry Revenue Million Forecast, by Technology 2020 & 2033
- Table 22: Global Food Allergen Testing Industry Revenue Million Forecast, by Application 2020 & 2033
- Table 23: Global Food Allergen Testing Industry Revenue Million Forecast, by Country 2020 & 2033
- Table 24: India Food Allergen Testing Industry Revenue (Million) Forecast, by Application 2020 & 2033
- Table 25: China Food Allergen Testing Industry Revenue (Million) Forecast, by Application 2020 & 2033
- Table 26: Japan Food Allergen Testing Industry Revenue (Million) Forecast, by Application 2020 & 2033
- Table 27: Australia Food Allergen Testing Industry Revenue (Million) Forecast, by Application 2020 & 2033
- Table 28: Rest of Asia Pacific Food Allergen Testing Industry Revenue (Million) Forecast, by Application 2020 & 2033
- Table 29: Global Food Allergen Testing Industry Revenue Million Forecast, by Technology 2020 & 2033
- Table 30: Global Food Allergen Testing Industry Revenue Million Forecast, by Application 2020 & 2033
- Table 31: Global Food Allergen Testing Industry Revenue Million Forecast, by Country 2020 & 2033
- Table 32: Brazil Food Allergen Testing Industry Revenue (Million) Forecast, by Application 2020 & 2033
- Table 33: Argentina Food Allergen Testing Industry Revenue (Million) Forecast, by Application 2020 & 2033
- Table 34: Rest of South America Food Allergen Testing Industry Revenue (Million) Forecast, by Application 2020 & 2033
- Table 35: Global Food Allergen Testing Industry Revenue Million Forecast, by Technology 2020 & 2033
- Table 36: Global Food Allergen Testing Industry Revenue Million Forecast, by Application 2020 & 2033
- Table 37: Global Food Allergen Testing Industry Revenue Million Forecast, by Country 2020 & 2033
- Table 38: South Africa Food Allergen Testing Industry Revenue (Million) Forecast, by Application 2020 & 2033
- Table 39: Saudi Arabia Food Allergen Testing Industry Revenue (Million) Forecast, by Application 2020 & 2033
- Table 40: Rest of Middle East and Africa Food Allergen Testing Industry Revenue (Million) Forecast, by Application 2020 & 2033
Frequently Asked Questions
1. What is the projected Compound Annual Growth Rate (CAGR) of the Food Allergen Testing Industry?
The projected CAGR is approximately 7.42%.
2. Which companies are prominent players in the Food Allergen Testing Industry?
Key companies in the market include Intertek Group PLC, Mérieux NutriSciences, Bureau Veritas S A, SGS SA, Crystal Chem Inc , Lifeasible, ALS Limited, Microbac Laboratories Inc, Eurofins Scientific SE, Neogen Corporation.
3. What are the main segments of the Food Allergen Testing Industry?
The market segments include Technology, Application .
4. Can you provide details about the market size?
The market size is estimated to be USD 0.89 Million as of 2022.
5. What are some drivers contributing to market growth?
Increasing Incidences of Food Allergies; Favorable Government Initiatives and Regulations for Food Safety.
6. What are the notable trends driving market growth?
Increasing Prevalence of Food Allergies.
7. Are there any restraints impacting market growth?
Inconsistencies Involved in Food Allergen Declarations.
8. Can you provide examples of recent developments in the market?
March 2024: Gold Standard Diagnostics launched the first product of the new allergen PowerLine tests: the SENSIStrip Gluten PowerLine Lateral Flow Device. The product comprises a sensitive detection system based on a monoclonal antibody and can detect gluten residues in food matrices, rinse water, and swabs.
9. What pricing options are available for accessing the report?
Pricing options include single-user, multi-user, and enterprise licenses priced at USD 4750, USD 5250, and USD 8750 respectively.
10. Is the market size provided in terms of value or volume?
The market size is provided in terms of value, measured in Million.
11. Are there any specific market keywords associated with the report?
Yes, the market keyword associated with the report is "Food Allergen Testing Industry," which aids in identifying and referencing the specific market segment covered.
12. How do I determine which pricing option suits my needs best?
The pricing options vary based on user requirements and access needs. Individual users may opt for single-user licenses, while businesses requiring broader access may choose multi-user or enterprise licenses for cost-effective access to the report.
13. Are there any additional resources or data provided in the Food Allergen Testing Industry report?
While the report offers comprehensive insights, it's advisable to review the specific contents or supplementary materials provided to ascertain if additional resources or data are available.
14. How can I stay updated on further developments or reports in the Food Allergen Testing Industry?
To stay informed about further developments, trends, and reports in the Food Allergen Testing Industry, consider subscribing to industry newsletters, following relevant companies and organizations, or regularly checking reputable industry news sources and publications.
Methodology
Step 1 - Identification of Relevant Samples Size from Population Database


Step 2 - Approaches for Defining Global Market Size (Value, Volume* & Price*)

Note*: In applicable scenarios
Step 3 - Data Sources
Primary Research
- Web Analytics
- Survey Reports
- Research Institute
- Latest Research Reports
- Opinion Leaders
Secondary Research
- Annual Reports
- White Paper
- Latest Press Release
- Industry Association
- Paid Database
- Investor Presentations

Step 4 - Data Triangulation
Involves using different sources of information in order to increase the validity of a study
These sources are likely to be stakeholders in a program - participants, other researchers, program staff, other community members, and so on.
Then we put all data in single framework & apply various statistical tools to find out the dynamic on the market.
During the analysis stage, feedback from the stakeholder groups would be compared to determine areas of agreement as well as areas of divergence