

Key Insights
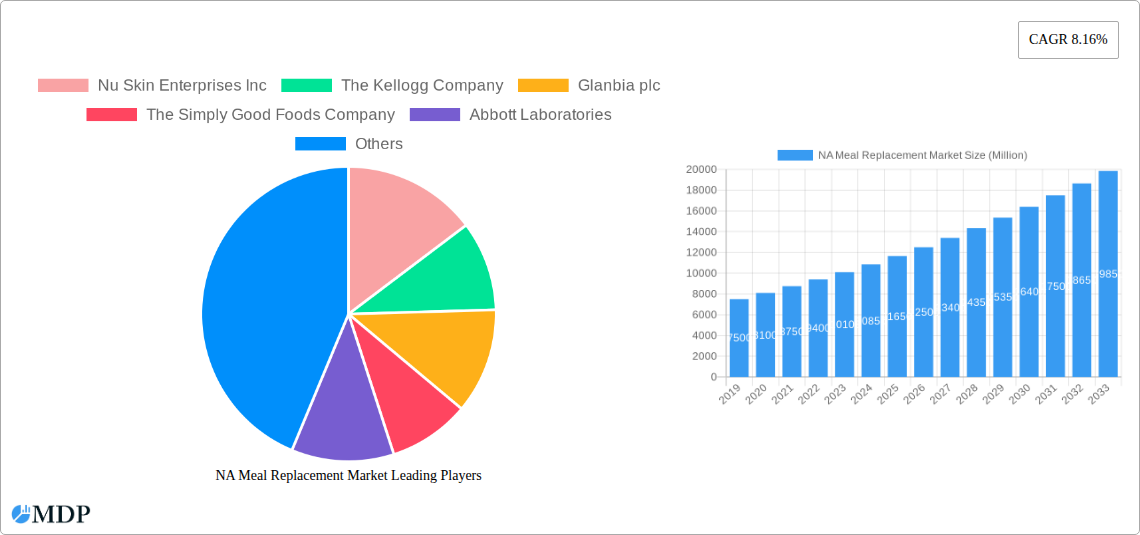
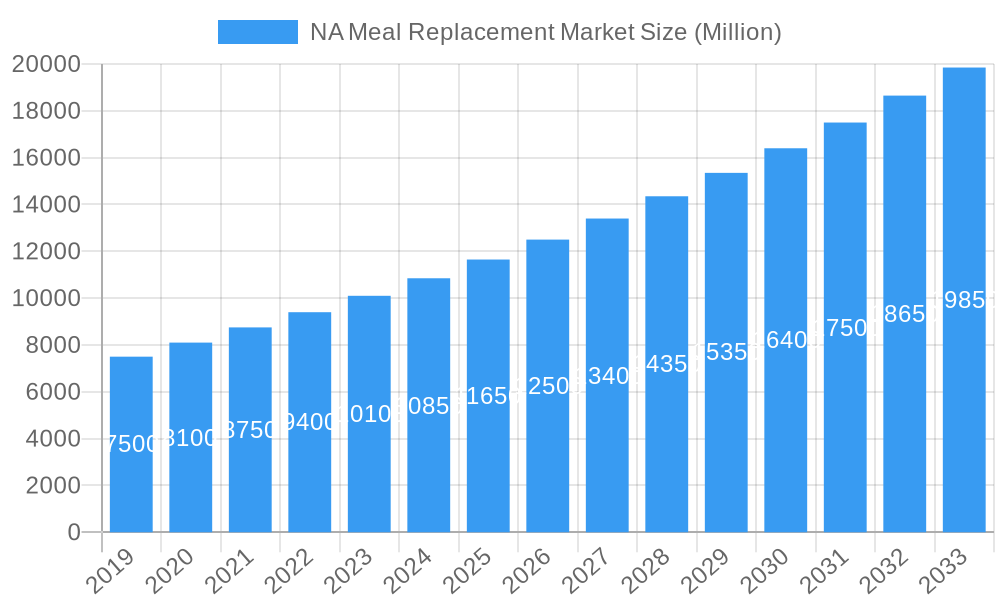
The North American (NA) Meal Replacement Market is poised for significant expansion, projected to reach a market size of approximately USD 10,000 million by 2025, with a robust Compound Annual Growth Rate (CAGR) of 8.16%. This growth trajectory is largely propelled by increasing health consciousness and a growing demand for convenient, nutrient-dense food options among consumers. The fast-paced lifestyles prevalent across North America, particularly in the United States and Canada, have amplified the need for quick yet healthy meal solutions, driving the adoption of meal replacements. Furthermore, rising obesity rates and a proactive approach to managing chronic diseases like diabetes are encouraging consumers to seek controlled calorie intake and balanced nutrition, making meal replacements an attractive choice. The market's expansion is also influenced by a greater understanding of the benefits of personalized nutrition and the availability of a diverse product portfolio catering to various dietary needs and preferences, including keto-friendly, vegan, and plant-based options.
NA Meal Replacement Market Market Size (In Billion)
The NA Meal Replacement Market is characterized by dynamic trends and a competitive landscape. Ready-to-drink (RTD) products and powdered supplements are leading the charge, owing to their convenience and versatility. The proliferation of online retail channels has significantly boosted accessibility, allowing consumers to easily purchase these products from the comfort of their homes. Major players like Abbott Laboratories, Nestle, and The Simply Good Foods Company are continuously innovating, launching new products and expanding their distribution networks to capture market share. However, the market faces certain restraints, including perceived high costs by some consumer segments and the need for further consumer education regarding the long-term benefits and proper integration of meal replacements into a healthy diet. Despite these challenges, the market's underlying drivers—health and wellness trends, convenience, and product innovation—are expected to sustain its upward momentum throughout the forecast period. The market's segmentation by product type, with RTD and powdered supplements holding substantial shares, and by distribution channel, with online stores and supermarkets dominating, provides a clear picture of consumer preferences and market dynamics.
NA Meal Replacement Market Company Market Share
North America Meal Replacement Market: Comprehensive Analysis and Future Outlook (2019-2033)
This in-depth report provides a definitive analysis of the North America Meal Replacement Market, offering actionable insights and strategic recommendations for stakeholders. Covering the historical period from 2019 to 2024, the base year of 2025, and a robust forecast period extending to 2033, this research delves into market dynamics, key trends, leading segments, product innovations, growth drivers, challenges, and emerging opportunities. With a focus on maximizing search visibility through high-traffic keywords such as "meal replacement market," "North America nutrition," "weight management products," and "healthy eating solutions," this report is indispensable for industry leaders, investors, and market strategists.
NA Meal Replacement Market Market Dynamics & Concentration
The North America Meal Replacement Market exhibits a moderate to high concentration, with key players like Abbott Laboratories, Nestle SA, and Herbalife Nutrition holding significant market share, estimated to be around 55% in 2025. Innovation drivers are primarily fueled by increasing consumer demand for convenient, healthy, and personalized nutrition solutions. The regulatory framework, overseen by bodies such as the FDA, ensures product safety and accurate labeling, influencing product development and marketing strategies. Product substitutes, including traditional whole foods and other dietary supplements, present a constant competitive pressure, pushing manufacturers to differentiate through superior nutritional profiles, taste, and convenience. End-user trends are shifting towards plant-based options, low-sugar formulations, and products catering to specific dietary needs like keto and vegan. Mergers and Acquisitions (M&A) activities are present, with an estimated 7-10 significant deals anticipated between 2025 and 2030, primarily focused on acquiring innovative startups or expanding product portfolios and distribution networks.
NA Meal Replacement Market Industry Trends & Analysis
The North America Meal Replacement Market is poised for substantial growth, projected to expand at a Compound Annual Growth Rate (CAGR) of 7.5% from 2025 to 2033. This upward trajectory is driven by a confluence of factors, most notably the escalating global health consciousness and the burgeoning demand for convenient dietary solutions that align with increasingly busy lifestyles. The market penetration of meal replacement products, already significant, is expected to deepen as more consumers recognize their efficacy in weight management, nutritional supplementation, and as quick, healthy alternatives to traditional meals.
Technological disruptions are playing a pivotal role, with advancements in ingredient sourcing, formulation science, and sustainable packaging redefining product offerings. Manufacturers are leveraging cutting-edge research to develop meal replacements that offer complete nutritional profiles, incorporate functional ingredients like probiotics and prebiotics for gut health, and cater to specific dietary preferences and health goals. Personalized nutrition, enabled by data analytics and AI-driven platforms, is emerging as a significant trend, allowing for customized meal replacement formulations tailored to individual caloric needs, macronutrient ratios, and micronutrient deficiencies.
Consumer preferences are a dynamic force shaping the market. There is a discernible shift away from artificial ingredients and towards natural, organic, and ethically sourced components. The demand for clean-label products, free from artificial sweeteners, colors, and preservatives, is at an all-time high. Furthermore, the growing awareness of environmental sustainability is influencing purchasing decisions, leading consumers to favor brands with eco-friendly packaging and responsible supply chain practices. Plant-based protein sources are gaining immense popularity, driving innovation in vegan and vegetarian meal replacement options.
Competitive dynamics within the North American market are characterized by both intense rivalry among established giants and the agile emergence of niche players. Companies are investing heavily in research and development to create differentiated products, while simultaneously focusing on robust marketing campaigns and strategic partnerships to expand their market reach. The rise of e-commerce has democratized access to these products, fostering a more competitive landscape where brand loyalty is increasingly influenced by product quality, perceived health benefits, and brand transparency. The estimated market size for meal replacements in North America is expected to reach $18 Billion in 2025, a testament to its robust growth and consumer acceptance.
Leading Markets & Segments in NA Meal Replacement Market
The North America Meal Replacement Market is characterized by a dynamic interplay of product types and distribution channels, with specific segments demonstrating remarkable dominance. Among the Product Types, Ready-to-drink Products are leading the charge, capturing an estimated 38% of the market share in 2025. This segment's dominance is driven by unparalleled convenience, appealing to consumers seeking on-the-go nutrition solutions that require no preparation. The readily consumable format addresses the time constraints of modern lifestyles, making it a go-to choice for busy professionals, students, and individuals prioritizing efficiency.
Following closely, Powdered Supplements hold a significant 32% market share. This segment's appeal lies in its versatility, allowing consumers to customize their meal replacements by mixing with various liquids or incorporating them into smoothies and recipes. The cost-effectiveness and longer shelf-life of powders also contribute to their widespread adoption. Nutritional Bars represent another substantial segment, accounting for 25% of the market. These are favored for their portability and satisfying nature, often serving as a quick snack or a partial meal replacement.
The Distribution Channel landscape is equally revealing. Online Stores are emerging as the most dominant channel, projected to hold a 40% market share by 2025. The e-commerce surge is fueled by the convenience of home delivery, a wider selection of brands and products, competitive pricing, and the ability to easily compare options. This digital channel provides direct access to consumers, reducing overhead for manufacturers and offering a personalized shopping experience.
Supermarkets/Hypermarkets remain a crucial channel, commanding an estimated 35% market share. Their widespread physical presence and the ability for consumers to see and touch products before purchasing make them a consistent performer. However, their market share is gradually being eroded by the rapid growth of online retail. Specialty Stores, including health food stores and pharmacies, contribute approximately 15% to the market share. These channels cater to a more niche audience seeking specialized nutritional products and expert advice. Convenience Stores, while offering accessibility, represent a smaller portion of the market, estimated at 10%, typically catering to impulse purchases or emergency needs.
Key drivers for the dominance of Ready-to-drink products and Online Stores include consumer convenience, increasing disposable incomes, and advancements in logistics and delivery networks. Economic policies promoting healthy living and rising healthcare costs are also indirectly boosting the demand for preventative nutritional solutions.
NA Meal Replacement Market Product Developments
Product innovations in the North America Meal Replacement Market are rapidly evolving, focusing on enhanced nutritional profiles, functional benefits, and improved taste. Key developments include the increasing incorporation of plant-based proteins like pea, soy, and rice, catering to the vegan and vegetarian consumer base. Functional ingredients such as probiotics, prebiotics, adaptogens, and nootropics are being integrated to offer specific health advantages, from gut health support to cognitive enhancement. Manufacturers are also prioritizing clean labels, reducing sugar content, and eliminating artificial sweeteners and preservatives. Advanced formulation techniques are leading to smoother textures and more appealing flavors, addressing a common consumer concern. The competitive advantage lies in offering personalized nutrition solutions and products that align with emerging dietary trends like keto, paleo, and intermittent fasting.
Key Drivers of NA Meal Replacement Market Growth
Several key factors are propelling the North America Meal Replacement Market forward. The rising prevalence of obesity and lifestyle-related diseases is a primary driver, as consumers actively seek effective weight management solutions. The increasing demand for convenient and healthy food options driven by busy lifestyles and a growing health-conscious population is paramount. Technological advancements in food science and product formulation enable the creation of more palatable, nutritionally complete, and specialized meal replacements. Supportive government initiatives and increasing awareness campaigns promoting healthy eating further bolster market growth. Furthermore, the growing acceptance of meal replacements as a viable dietary tool across various demographics, including athletes and busy professionals, is a significant accelerator.
Challenges in the NA Meal Replacement Market Market
Despite robust growth, the North America Meal Replacement Market faces several challenges. Regulatory hurdles and evolving labeling requirements can increase compliance costs and necessitate product reformulations. Consumer skepticism regarding the long-term health impacts and perceived lack of whole-food benefits remains a barrier for some. Intense competition and price wars among established and emerging players can impact profit margins. Supply chain disruptions and fluctuating raw material costs can affect production and availability. Additionally, negative perceptions associated with processed foods and a desire for more natural alternatives can limit market expansion for certain product categories.
Emerging Opportunities in NA Meal Replacement Market
The North America Meal Replacement Market is ripe with emerging opportunities. The growing demand for personalized nutrition solutions, leveraging data analytics and AI to create customized meal plans and products, presents a significant avenue for growth. Expansion into niche dietary markets, such as gluten-free, dairy-free, and allergen-friendly options, can tap into underserved consumer segments. Strategic partnerships with fitness centers, corporate wellness programs, and healthcare providers can enhance brand visibility and consumer adoption. The development of sustainable and eco-friendly packaging solutions aligns with growing consumer environmental consciousness. Furthermore, the increasing acceptance of plant-based diets opens doors for innovative and appealing vegan meal replacement products.
Leading Players in the NA Meal Replacement Market Sector
- Nu Skin Enterprises Inc
- The Kellogg Company
- Glanbia plc
- The Simply Good Foods Company
- Abbott Laboratories
- Amway Corp (Alticor)
- Herbalife Nutrition
- Nestle SA
Key Milestones in NA Meal Replacement Market Industry
- 2019: Increased focus on plant-based protein sources in meal replacement formulations.
- 2020: Surge in online sales of meal replacements driven by the pandemic, highlighting convenience.
- 2021: Launch of personalized nutrition platforms integrating meal replacement recommendations.
- 2022: Growing emphasis on functional ingredients like probiotics and adaptogens in new product development.
- 2023: Increased M&A activity targeting innovative startups with unique product offerings.
- 2024: Heightened consumer demand for clean-label and low-sugar meal replacement options.
Strategic Outlook for NA Meal Replacement Market Market
The strategic outlook for the North America Meal Replacement Market remains exceptionally positive, driven by the ongoing trend towards health and wellness. Key growth accelerators include continued innovation in product formulation to meet diverse dietary needs and preferences, particularly in the plant-based and personalized nutrition spaces. Leveraging digital channels for direct-to-consumer sales and targeted marketing will be crucial for capturing market share. Strategic partnerships with healthcare and fitness professionals can further legitimize meal replacements as a dietary staple. Focusing on sustainability in sourcing and packaging will resonate with an increasingly eco-conscious consumer base, solidifying long-term market potential.
NA Meal Replacement Market Segmentation
-
1. Product Type
- 1.1. Ready-to-drink Products
- 1.2. Nutritional Bars
- 1.3. Powdered Supplements
- 1.4. Other Product Types
-
2. Distribution Channel
- 2.1. Convenience Stores
- 2.2. Supermarkets/Hypermarkets
- 2.3. Specialty Stores
- 2.4. Online Stores
- 2.5. Other Distribution Channels
NA Meal Replacement Market Segmentation By Geography
-
1. North America
- 1.1. United States
- 1.2. Canada
- 1.3. Mexico
-
2. South America
- 2.1. Brazil
- 2.2. Argentina
- 2.3. Rest of South America
-
3. Europe
- 3.1. United Kingdom
- 3.2. Germany
- 3.3. France
- 3.4. Italy
- 3.5. Spain
- 3.6. Russia
- 3.7. Benelux
- 3.8. Nordics
- 3.9. Rest of Europe
-
4. Middle East & Africa
- 4.1. Turkey
- 4.2. Israel
- 4.3. GCC
- 4.4. North Africa
- 4.5. South Africa
- 4.6. Rest of Middle East & Africa
-
5. Asia Pacific
- 5.1. China
- 5.2. India
- 5.3. Japan
- 5.4. South Korea
- 5.5. ASEAN
- 5.6. Oceania
- 5.7. Rest of Asia Pacific
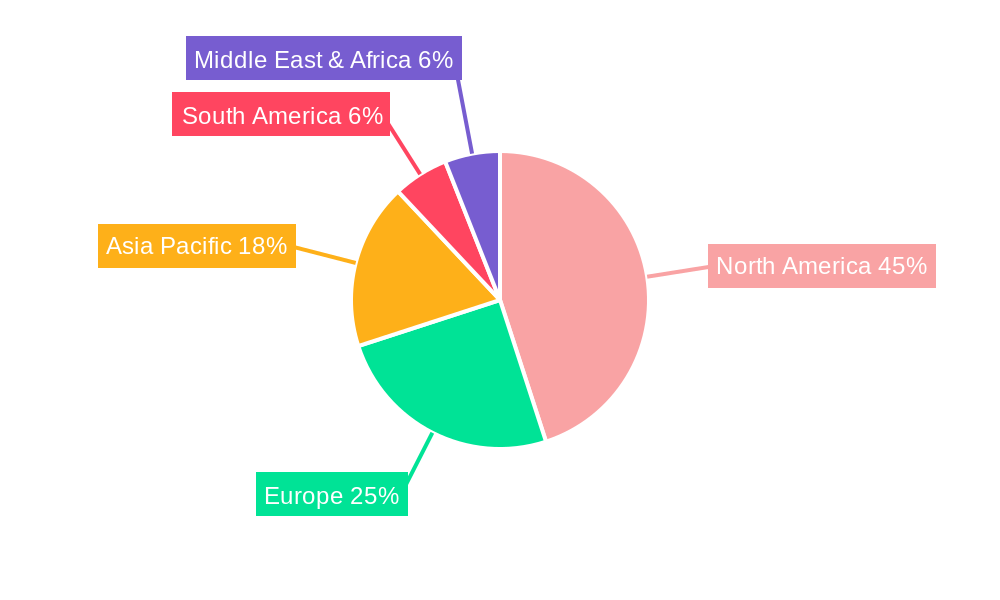
NA Meal Replacement Market Regional Market Share
Geographic Coverage of NA Meal Replacement Market
NA Meal Replacement Market REPORT HIGHLIGHTS
| Aspects | Details |
|---|---|
| Study Period | 2020-2034 |
| Base Year | 2025 |
| Estimated Year | 2026 |
| Forecast Period | 2026-2034 |
| Historical Period | 2020-2025 |
| Growth Rate | CAGR of 8.21% from 2020-2034 |
| Segmentation |
|
Table of Contents
- 1. Introduction
- 1.1. Research Scope
- 1.2. Market Segmentation
- 1.3. Research Objective
- 1.4. Definitions and Assumptions
- 2. Executive Summary
- 2.1. Market Snapshot
- 3. Market Dynamics
- 3.1. Market Drivers
- 3.2. Market Restrains
- 3.3. Market Trends
- 3.4. Market Opportunities
- 4. Market Factor Analysis
- 4.1. Porters Five Forces
- 4.1.1. Bargaining Power of Suppliers
- 4.1.2. Bargaining Power of Buyers
- 4.1.3. Threat of New Entrants
- 4.1.4. Threat of Substitutes
- 4.1.5. Competitive Rivalry
- 4.2. PESTEL analysis
- 4.3. BCG Analysis
- 4.3.1. Stars (High Growth, High Market Share)
- 4.3.2. Cash Cows (Low Growth, High Market Share)
- 4.3.3. Question Mark (High Growth, Low Market Share)
- 4.3.4. Dogs (Low Growth, Low Market Share)
- 4.4. Ansoff Matrix Analysis
- 4.5. Supply Chain Analysis
- 4.6. Regulatory Landscape
- 4.7. Current Market Potential and Opportunity Assessment (TAM–SAM–SOM Framework)
- 4.8. MDP Analyst Note
- 4.1. Porters Five Forces
- 5. Market Analysis, Insights and Forecast 2021-2033
- 5.1. Market Analysis, Insights and Forecast - by Product Type
- 5.1.1. Ready-to-drink Products
- 5.1.2. Nutritional Bars
- 5.1.3. Powdered Supplements
- 5.1.4. Other Product Types
- 5.2. Market Analysis, Insights and Forecast - by Distribution Channel
- 5.2.1. Convenience Stores
- 5.2.2. Supermarkets/Hypermarkets
- 5.2.3. Specialty Stores
- 5.2.4. Online Stores
- 5.2.5. Other Distribution Channels
- 5.3. Market Analysis, Insights and Forecast - by Region
- 5.3.1. North America
- 5.3.2. South America
- 5.3.3. Europe
- 5.3.4. Middle East & Africa
- 5.3.5. Asia Pacific
- 5.1. Market Analysis, Insights and Forecast - by Product Type
- 6. Global NA Meal Replacement Market Analysis, Insights and Forecast, 2021-2033
- 6.1. Market Analysis, Insights and Forecast - by Product Type
- 6.1.1. Ready-to-drink Products
- 6.1.2. Nutritional Bars
- 6.1.3. Powdered Supplements
- 6.1.4. Other Product Types
- 6.2. Market Analysis, Insights and Forecast - by Distribution Channel
- 6.2.1. Convenience Stores
- 6.2.2. Supermarkets/Hypermarkets
- 6.2.3. Specialty Stores
- 6.2.4. Online Stores
- 6.2.5. Other Distribution Channels
- 6.1. Market Analysis, Insights and Forecast - by Product Type
- 7. North America NA Meal Replacement Market Analysis, Insights and Forecast, 2020-2032
- 7.1. Market Analysis, Insights and Forecast - by Product Type
- 7.1.1. Ready-to-drink Products
- 7.1.2. Nutritional Bars
- 7.1.3. Powdered Supplements
- 7.1.4. Other Product Types
- 7.2. Market Analysis, Insights and Forecast - by Distribution Channel
- 7.2.1. Convenience Stores
- 7.2.2. Supermarkets/Hypermarkets
- 7.2.3. Specialty Stores
- 7.2.4. Online Stores
- 7.2.5. Other Distribution Channels
- 7.1. Market Analysis, Insights and Forecast - by Product Type
- 8. South America NA Meal Replacement Market Analysis, Insights and Forecast, 2020-2032
- 8.1. Market Analysis, Insights and Forecast - by Product Type
- 8.1.1. Ready-to-drink Products
- 8.1.2. Nutritional Bars
- 8.1.3. Powdered Supplements
- 8.1.4. Other Product Types
- 8.2. Market Analysis, Insights and Forecast - by Distribution Channel
- 8.2.1. Convenience Stores
- 8.2.2. Supermarkets/Hypermarkets
- 8.2.3. Specialty Stores
- 8.2.4. Online Stores
- 8.2.5. Other Distribution Channels
- 8.1. Market Analysis, Insights and Forecast - by Product Type
- 9. Europe NA Meal Replacement Market Analysis, Insights and Forecast, 2020-2032
- 9.1. Market Analysis, Insights and Forecast - by Product Type
- 9.1.1. Ready-to-drink Products
- 9.1.2. Nutritional Bars
- 9.1.3. Powdered Supplements
- 9.1.4. Other Product Types
- 9.2. Market Analysis, Insights and Forecast - by Distribution Channel
- 9.2.1. Convenience Stores
- 9.2.2. Supermarkets/Hypermarkets
- 9.2.3. Specialty Stores
- 9.2.4. Online Stores
- 9.2.5. Other Distribution Channels
- 9.1. Market Analysis, Insights and Forecast - by Product Type
- 10. Middle East & Africa NA Meal Replacement Market Analysis, Insights and Forecast, 2020-2032
- 10.1. Market Analysis, Insights and Forecast - by Product Type
- 10.1.1. Ready-to-drink Products
- 10.1.2. Nutritional Bars
- 10.1.3. Powdered Supplements
- 10.1.4. Other Product Types
- 10.2. Market Analysis, Insights and Forecast - by Distribution Channel
- 10.2.1. Convenience Stores
- 10.2.2. Supermarkets/Hypermarkets
- 10.2.3. Specialty Stores
- 10.2.4. Online Stores
- 10.2.5. Other Distribution Channels
- 10.1. Market Analysis, Insights and Forecast - by Product Type
- 11. Asia Pacific NA Meal Replacement Market Analysis, Insights and Forecast, 2020-2032
- 11.1. Market Analysis, Insights and Forecast - by Product Type
- 11.1.1. Ready-to-drink Products
- 11.1.2. Nutritional Bars
- 11.1.3. Powdered Supplements
- 11.1.4. Other Product Types
- 11.2. Market Analysis, Insights and Forecast - by Distribution Channel
- 11.2.1. Convenience Stores
- 11.2.2. Supermarkets/Hypermarkets
- 11.2.3. Specialty Stores
- 11.2.4. Online Stores
- 11.2.5. Other Distribution Channels
- 11.1. Market Analysis, Insights and Forecast - by Product Type
- 12. Competitive Analysis
- 12.1. Company Profiles
- 12.1.1 Nu Skin Enterprises Inc
- 12.1.1.1. Company Overview
- 12.1.1.2. Products
- 12.1.1.3. Company Financials
- 12.1.1.4. SWOT Analysis
- 12.1.2 The Kellogg Company
- 12.1.2.1. Company Overview
- 12.1.2.2. Products
- 12.1.2.3. Company Financials
- 12.1.2.4. SWOT Analysis
- 12.1.3 Glanbia plc
- 12.1.3.1. Company Overview
- 12.1.3.2. Products
- 12.1.3.3. Company Financials
- 12.1.3.4. SWOT Analysis
- 12.1.4 The Simply Good Foods Company
- 12.1.4.1. Company Overview
- 12.1.4.2. Products
- 12.1.4.3. Company Financials
- 12.1.4.4. SWOT Analysis
- 12.1.5 Abbott Laboratories
- 12.1.5.1. Company Overview
- 12.1.5.2. Products
- 12.1.5.3. Company Financials
- 12.1.5.4. SWOT Analysis
- 12.1.6 Amway Corp (Alticor)
- 12.1.6.1. Company Overview
- 12.1.6.2. Products
- 12.1.6.3. Company Financials
- 12.1.6.4. SWOT Analysis
- 12.1.7 Herbalife Nutrition
- 12.1.7.1. Company Overview
- 12.1.7.2. Products
- 12.1.7.3. Company Financials
- 12.1.7.4. SWOT Analysis
- 12.1.8 Nestle SA*List Not Exhaustive
- 12.1.8.1. Company Overview
- 12.1.8.2. Products
- 12.1.8.3. Company Financials
- 12.1.8.4. SWOT Analysis
- 12.1.1 Nu Skin Enterprises Inc
- 12.2. Market Entropy
- 12.2.1 Company's Key Areas Served
- 12.2.2 Recent Developments
- 12.3. Company Market Share Analysis 2025
- 12.3.1 Top 5 Companies Market Share Analysis
- 12.3.2 Top 3 Companies Market Share Analysis
- 12.4. List of Potential Customers
- 13. Research Methodology
List of Figures
- Figure 1: Global NA Meal Replacement Market Revenue Breakdown (billion, %) by Region 2025 & 2033
- Figure 2: North America NA Meal Replacement Market Revenue (billion), by Product Type 2025 & 2033
- Figure 3: North America NA Meal Replacement Market Revenue Share (%), by Product Type 2025 & 2033
- Figure 4: North America NA Meal Replacement Market Revenue (billion), by Distribution Channel 2025 & 2033
- Figure 5: North America NA Meal Replacement Market Revenue Share (%), by Distribution Channel 2025 & 2033
- Figure 6: North America NA Meal Replacement Market Revenue (billion), by Country 2025 & 2033
- Figure 7: North America NA Meal Replacement Market Revenue Share (%), by Country 2025 & 2033
- Figure 8: South America NA Meal Replacement Market Revenue (billion), by Product Type 2025 & 2033
- Figure 9: South America NA Meal Replacement Market Revenue Share (%), by Product Type 2025 & 2033
- Figure 10: South America NA Meal Replacement Market Revenue (billion), by Distribution Channel 2025 & 2033
- Figure 11: South America NA Meal Replacement Market Revenue Share (%), by Distribution Channel 2025 & 2033
- Figure 12: South America NA Meal Replacement Market Revenue (billion), by Country 2025 & 2033
- Figure 13: South America NA Meal Replacement Market Revenue Share (%), by Country 2025 & 2033
- Figure 14: Europe NA Meal Replacement Market Revenue (billion), by Product Type 2025 & 2033
- Figure 15: Europe NA Meal Replacement Market Revenue Share (%), by Product Type 2025 & 2033
- Figure 16: Europe NA Meal Replacement Market Revenue (billion), by Distribution Channel 2025 & 2033
- Figure 17: Europe NA Meal Replacement Market Revenue Share (%), by Distribution Channel 2025 & 2033
- Figure 18: Europe NA Meal Replacement Market Revenue (billion), by Country 2025 & 2033
- Figure 19: Europe NA Meal Replacement Market Revenue Share (%), by Country 2025 & 2033
- Figure 20: Middle East & Africa NA Meal Replacement Market Revenue (billion), by Product Type 2025 & 2033
- Figure 21: Middle East & Africa NA Meal Replacement Market Revenue Share (%), by Product Type 2025 & 2033
- Figure 22: Middle East & Africa NA Meal Replacement Market Revenue (billion), by Distribution Channel 2025 & 2033
- Figure 23: Middle East & Africa NA Meal Replacement Market Revenue Share (%), by Distribution Channel 2025 & 2033
- Figure 24: Middle East & Africa NA Meal Replacement Market Revenue (billion), by Country 2025 & 2033
- Figure 25: Middle East & Africa NA Meal Replacement Market Revenue Share (%), by Country 2025 & 2033
- Figure 26: Asia Pacific NA Meal Replacement Market Revenue (billion), by Product Type 2025 & 2033
- Figure 27: Asia Pacific NA Meal Replacement Market Revenue Share (%), by Product Type 2025 & 2033
- Figure 28: Asia Pacific NA Meal Replacement Market Revenue (billion), by Distribution Channel 2025 & 2033
- Figure 29: Asia Pacific NA Meal Replacement Market Revenue Share (%), by Distribution Channel 2025 & 2033
- Figure 30: Asia Pacific NA Meal Replacement Market Revenue (billion), by Country 2025 & 2033
- Figure 31: Asia Pacific NA Meal Replacement Market Revenue Share (%), by Country 2025 & 2033
List of Tables
- Table 1: Global NA Meal Replacement Market Revenue billion Forecast, by Product Type 2020 & 2033
- Table 2: Global NA Meal Replacement Market Revenue billion Forecast, by Distribution Channel 2020 & 2033
- Table 3: Global NA Meal Replacement Market Revenue billion Forecast, by Region 2020 & 2033
- Table 4: Global NA Meal Replacement Market Revenue billion Forecast, by Product Type 2020 & 2033
- Table 5: Global NA Meal Replacement Market Revenue billion Forecast, by Distribution Channel 2020 & 2033
- Table 6: Global NA Meal Replacement Market Revenue billion Forecast, by Country 2020 & 2033
- Table 7: United States NA Meal Replacement Market Revenue (billion) Forecast, by Application 2020 & 2033
- Table 8: Canada NA Meal Replacement Market Revenue (billion) Forecast, by Application 2020 & 2033
- Table 9: Mexico NA Meal Replacement Market Revenue (billion) Forecast, by Application 2020 & 2033
- Table 10: Global NA Meal Replacement Market Revenue billion Forecast, by Product Type 2020 & 2033
- Table 11: Global NA Meal Replacement Market Revenue billion Forecast, by Distribution Channel 2020 & 2033
- Table 12: Global NA Meal Replacement Market Revenue billion Forecast, by Country 2020 & 2033
- Table 13: Brazil NA Meal Replacement Market Revenue (billion) Forecast, by Application 2020 & 2033
- Table 14: Argentina NA Meal Replacement Market Revenue (billion) Forecast, by Application 2020 & 2033
- Table 15: Rest of South America NA Meal Replacement Market Revenue (billion) Forecast, by Application 2020 & 2033
- Table 16: Global NA Meal Replacement Market Revenue billion Forecast, by Product Type 2020 & 2033
- Table 17: Global NA Meal Replacement Market Revenue billion Forecast, by Distribution Channel 2020 & 2033
- Table 18: Global NA Meal Replacement Market Revenue billion Forecast, by Country 2020 & 2033
- Table 19: United Kingdom NA Meal Replacement Market Revenue (billion) Forecast, by Application 2020 & 2033
- Table 20: Germany NA Meal Replacement Market Revenue (billion) Forecast, by Application 2020 & 2033
- Table 21: France NA Meal Replacement Market Revenue (billion) Forecast, by Application 2020 & 2033
- Table 22: Italy NA Meal Replacement Market Revenue (billion) Forecast, by Application 2020 & 2033
- Table 23: Spain NA Meal Replacement Market Revenue (billion) Forecast, by Application 2020 & 2033
- Table 24: Russia NA Meal Replacement Market Revenue (billion) Forecast, by Application 2020 & 2033
- Table 25: Benelux NA Meal Replacement Market Revenue (billion) Forecast, by Application 2020 & 2033
- Table 26: Nordics NA Meal Replacement Market Revenue (billion) Forecast, by Application 2020 & 2033
- Table 27: Rest of Europe NA Meal Replacement Market Revenue (billion) Forecast, by Application 2020 & 2033
- Table 28: Global NA Meal Replacement Market Revenue billion Forecast, by Product Type 2020 & 2033
- Table 29: Global NA Meal Replacement Market Revenue billion Forecast, by Distribution Channel 2020 & 2033
- Table 30: Global NA Meal Replacement Market Revenue billion Forecast, by Country 2020 & 2033
- Table 31: Turkey NA Meal Replacement Market Revenue (billion) Forecast, by Application 2020 & 2033
- Table 32: Israel NA Meal Replacement Market Revenue (billion) Forecast, by Application 2020 & 2033
- Table 33: GCC NA Meal Replacement Market Revenue (billion) Forecast, by Application 2020 & 2033
- Table 34: North Africa NA Meal Replacement Market Revenue (billion) Forecast, by Application 2020 & 2033
- Table 35: South Africa NA Meal Replacement Market Revenue (billion) Forecast, by Application 2020 & 2033
- Table 36: Rest of Middle East & Africa NA Meal Replacement Market Revenue (billion) Forecast, by Application 2020 & 2033
- Table 37: Global NA Meal Replacement Market Revenue billion Forecast, by Product Type 2020 & 2033
- Table 38: Global NA Meal Replacement Market Revenue billion Forecast, by Distribution Channel 2020 & 2033
- Table 39: Global NA Meal Replacement Market Revenue billion Forecast, by Country 2020 & 2033
- Table 40: China NA Meal Replacement Market Revenue (billion) Forecast, by Application 2020 & 2033
- Table 41: India NA Meal Replacement Market Revenue (billion) Forecast, by Application 2020 & 2033
- Table 42: Japan NA Meal Replacement Market Revenue (billion) Forecast, by Application 2020 & 2033
- Table 43: South Korea NA Meal Replacement Market Revenue (billion) Forecast, by Application 2020 & 2033
- Table 44: ASEAN NA Meal Replacement Market Revenue (billion) Forecast, by Application 2020 & 2033
- Table 45: Oceania NA Meal Replacement Market Revenue (billion) Forecast, by Application 2020 & 2033
- Table 46: Rest of Asia Pacific NA Meal Replacement Market Revenue (billion) Forecast, by Application 2020 & 2033
Frequently Asked Questions
1. What is the projected Compound Annual Growth Rate (CAGR) of the NA Meal Replacement Market?
The projected CAGR is approximately 8.21%.
2. Which companies are prominent players in the NA Meal Replacement Market?
Key companies in the market include Nu Skin Enterprises Inc, The Kellogg Company, Glanbia plc, The Simply Good Foods Company, Abbott Laboratories, Amway Corp (Alticor), Herbalife Nutrition, Nestle SA*List Not Exhaustive.
3. What are the main segments of the NA Meal Replacement Market?
The market segments include Product Type, Distribution Channel.
4. Can you provide details about the market size?
The market size is estimated to be USD 20.13 billion as of 2022.
5. What are some drivers contributing to market growth?
Increasing Focus on Maintaining Health and Well-Being; Launching Supplements For Specific Purposes and Targeted Population.
6. What are the notable trends driving market growth?
American Consumers Opting for Special Diets Strive on Meal Replacements.
7. Are there any restraints impacting market growth?
Supplement Consumption and Their Side-effects; Inclination Towards Substitute Products.
8. Can you provide examples of recent developments in the market?
N/A
9. What pricing options are available for accessing the report?
Pricing options include single-user, multi-user, and enterprise licenses priced at USD 4750, USD 5250, and USD 8750 respectively.
10. Is the market size provided in terms of value or volume?
The market size is provided in terms of value, measured in billion.
11. Are there any specific market keywords associated with the report?
Yes, the market keyword associated with the report is "NA Meal Replacement Market," which aids in identifying and referencing the specific market segment covered.
12. How do I determine which pricing option suits my needs best?
The pricing options vary based on user requirements and access needs. Individual users may opt for single-user licenses, while businesses requiring broader access may choose multi-user or enterprise licenses for cost-effective access to the report.
13. Are there any additional resources or data provided in the NA Meal Replacement Market report?
While the report offers comprehensive insights, it's advisable to review the specific contents or supplementary materials provided to ascertain if additional resources or data are available.
14. How can I stay updated on further developments or reports in the NA Meal Replacement Market?
To stay informed about further developments, trends, and reports in the NA Meal Replacement Market, consider subscribing to industry newsletters, following relevant companies and organizations, or regularly checking reputable industry news sources and publications.
Methodology
Step 1 - Identification of Relevant Samples Size from Population Database


Step 2 - Approaches for Defining Global Market Size (Value, Volume* & Price*)

Note*: In applicable scenarios
Step 3 - Data Sources
Primary Research
- Web Analytics
- Survey Reports
- Research Institute
- Latest Research Reports
- Opinion Leaders
Secondary Research
- Annual Reports
- White Paper
- Latest Press Release
- Industry Association
- Paid Database
- Investor Presentations

Step 4 - Data Triangulation
Involves using different sources of information in order to increase the validity of a study
These sources are likely to be stakeholders in a program - participants, other researchers, program staff, other community members, and so on.
Then we put all data in single framework & apply various statistical tools to find out the dynamic on the market.
During the analysis stage, feedback from the stakeholder groups would be compared to determine areas of agreement as well as areas of divergence