

Key Insights
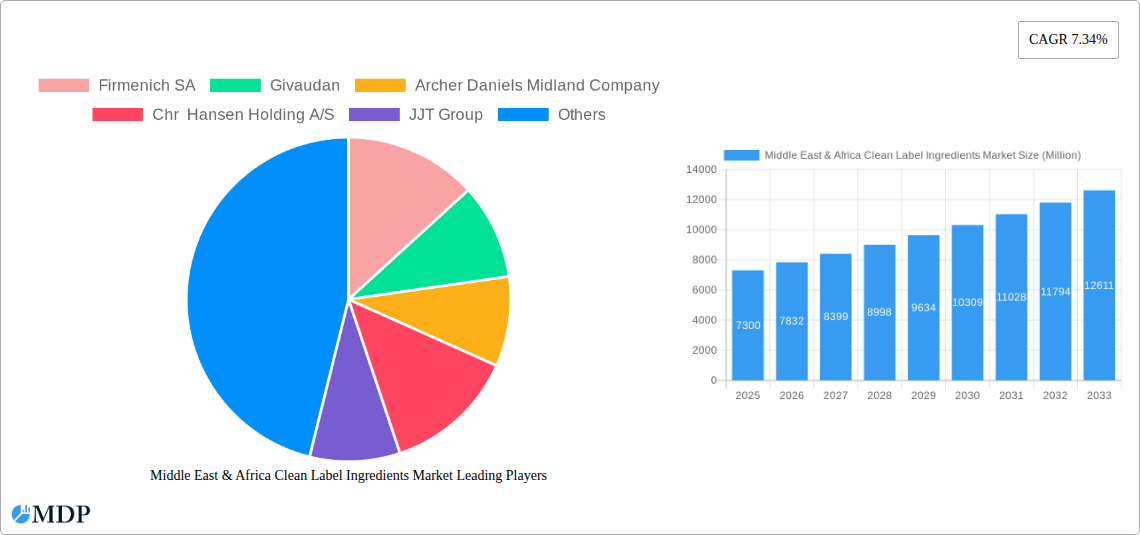
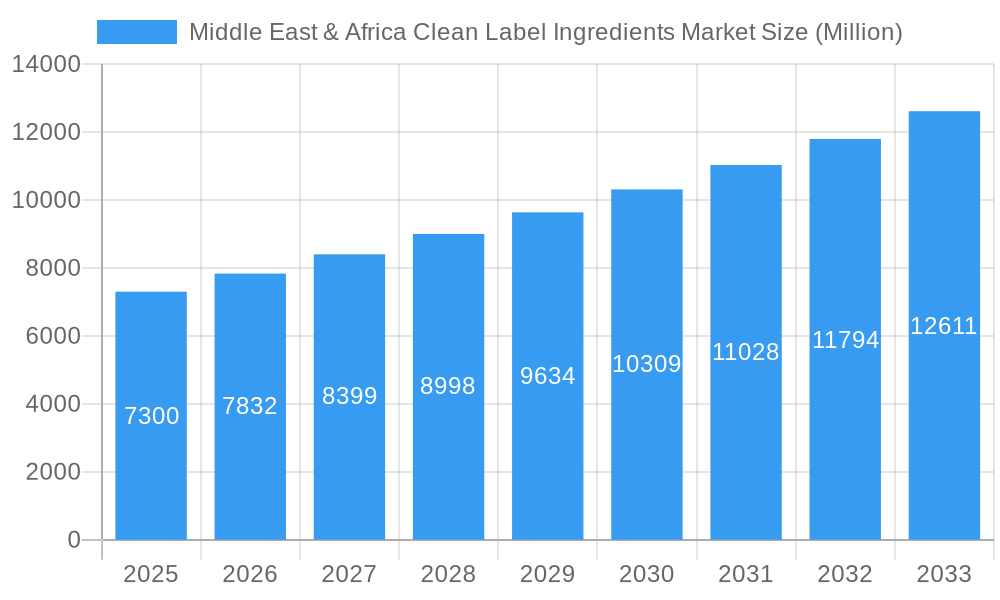
The Middle East & Africa Clean Label Ingredients Market is projected to expand significantly, reaching an estimated $56.59 billion by 2025, with a projected Compound Annual Growth Rate (CAGR) of 7.34% through 2033. This growth is primarily driven by increasing consumer preference for natural, minimally processed, and transparent food and beverage ingredients. Heightened consumer awareness regarding health and wellness compels manufacturers to reformulate products, boosting demand for diverse clean label solutions. Key growth factors include rising disposable incomes, adoption of healthier lifestyles, and demand for transparent food production. Market segments such as Color, Flavor, Starch, and Sweeteners are experiencing strong traction, impacting applications in Beverages, Bakery & Confectionery, and Processed Foods.
Middle East & Africa Clean Label Ingredients Market Market Size (In Billion)
The clean label movement represents a fundamental shift in consumer preferences across Saudi Arabia, South Africa, and the wider Middle East & Africa, creating substantial opportunities for ingredient suppliers offering high-quality, naturally derived solutions. While potential higher costs of natural ingredients and supply chain complexities are noted restraints, technological advancements and strategic sourcing are mitigating these challenges. Leading companies are investing in R&D to expand their clean label portfolios. Continued focus on natural sourcing, sustainability, and product transparency will solidify the clean label ingredients market's importance in the region's food and beverage sector throughout the forecast period.
Middle East & Africa Clean Label Ingredients Market Company Market Share
Middle East & Africa Clean Label Ingredients Market: Comprehensive Analysis & Future Outlook (2019-2033)
The Middle East & Africa clean label ingredients market is experiencing robust growth, driven by increasing consumer demand for natural, recognizable, and ethically sourced food and beverage components. This report provides an in-depth analysis of this dynamic market, covering key segments, leading players, and future growth trajectories. With a study period spanning from 2019 to 2033 and a base year of 2025, this comprehensive report offers actionable insights for stakeholders seeking to capitalize on the burgeoning opportunities in this region.
Middle East & Africa Clean Label Ingredients Market Market Dynamics & Concentration
The Middle East & Africa clean label ingredients market exhibits a moderate to high concentration, with a few key players holding significant market share. Innovation is a critical driver, fueled by continuous research and development in natural extraction techniques and the creation of novel ingredients that meet stringent consumer expectations for transparency and health. Regulatory frameworks across the region are evolving, with many countries increasingly adopting standards that favor clean label practices, impacting product formulations and ingredient sourcing. Product substitutes, primarily synthetic ingredients, pose a challenge, but the growing consumer preference for natural alternatives is diminishing their dominance. End-user trends are strongly skewed towards healthier, minimally processed food and beverages, pushing manufacturers to reformulate their offerings. Mergers and acquisitions (M&A) activities are present, though not as pronounced as in more mature markets, often focused on acquiring specialized clean label ingredient suppliers or expanding regional distribution networks. For instance, a recent M&A deal in Saudi Arabia aimed to bolster a local manufacturer's clean label portfolio, reflecting a strategic push to cater to domestic demand. The market share of leading clean label ingredient types, such as flavors and colors, is estimated to be around 30% and 25% respectively in the base year 2025. The count of significant M&A deals impacting this sector in the MEA region over the historical period (2019-2024) stands at approximately 8-12, indicating growing strategic consolidation.
Middle East & Africa Clean Label Ingredients Market Industry Trends & Analysis
The Middle East & Africa clean label ingredients market is on an upward trajectory, projected to witness a Compound Annual Growth Rate (CAGR) of approximately 7.5% during the forecast period of 2025-2033. This impressive growth is underpinned by a confluence of powerful market drivers. Foremost among these is the escalating consumer consciousness regarding health and wellness. As awareness regarding the potential adverse effects of artificial additives, preservatives, and synthetic colors continues to rise, consumers are actively seeking out food and beverage products that feature recognizable ingredients and are perceived as "healthier." This shift in consumer preference is a significant catalyst, compelling food manufacturers across the MEA region to reformulate their product lines and prioritize clean label solutions. Technological disruptions are also playing a crucial role. Innovations in ingredient processing, such as advanced extraction methods for natural colors from fruits and vegetables, enzymatic modification of starches for natural sweetening, and fermentation techniques for producing natural preservatives, are making clean label ingredients more accessible, cost-effective, and performant. The growing adoption of these advanced technologies by ingredient manufacturers is crucial in meeting the demand for high-quality, functional clean label components. Consumer preferences are increasingly dictating market trends, with a strong emphasis on transparency in ingredient lists. Consumers want to understand what they are consuming, leading to a demand for simple, short ingredient lists free from complex chemical names. This demand for "food as it should be" is a primary driver for the clean label movement. The competitive dynamics within the market are intensifying. Established global ingredient suppliers are vying for market share alongside a growing number of regional players who are capitalizing on local sourcing opportunities and a deep understanding of regional consumer tastes. Strategic partnerships between ingredient manufacturers and food and beverage companies are becoming more common, fostering innovation and facilitating market penetration. The market penetration of clean label ingredients, while still nascent in some sub-regions, is rapidly increasing, particularly in urban centers and among affluent demographics. For instance, the market penetration of natural colors in the beverage segment in South Africa is estimated to reach 45% by 2025, a significant increase from previous years. The influence of social media and health influencers further amplifies consumer demand for clean label products, creating a virtuous cycle of demand and supply. The Middle East & Africa region, with its diverse culinary landscape and growing disposable incomes, presents a fertile ground for the expansion of the clean label ingredients market, making it an area of significant strategic interest for global and regional players.
Leading Markets & Segments in Middle East & Africa Clean Label Ingredients Market
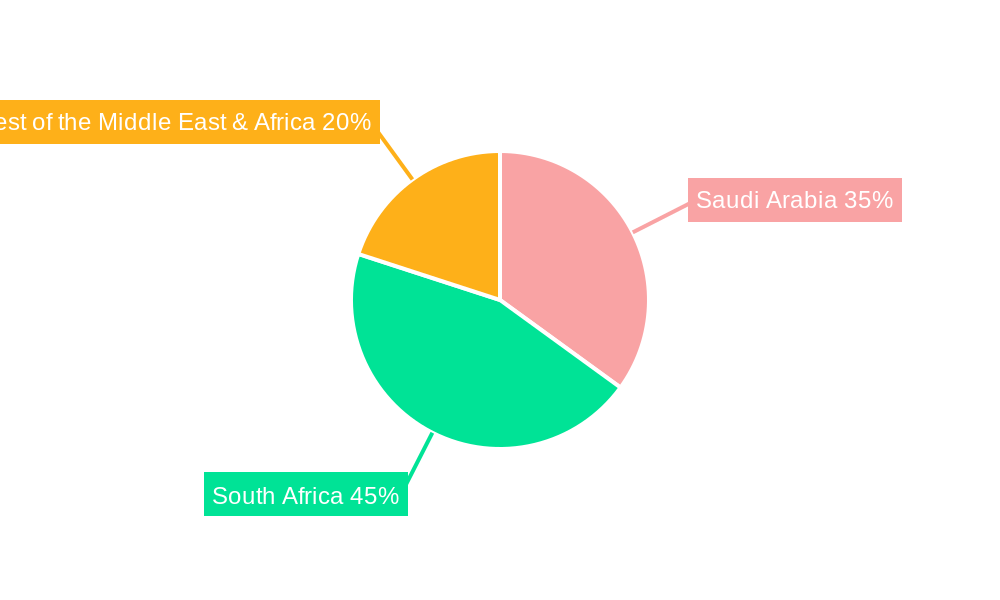
The Middle East & Africa clean label ingredients market is characterized by significant regional variations and segment dominance. In terms of geography, Saudi Arabia is emerging as a leading market, driven by a young, health-conscious population, significant government initiatives promoting food security and local production, and increasing disposable incomes. The country's ambitious Vision 2030 economic diversification plan also indirectly supports the growth of the food and beverage sector, including the demand for cleaner ingredients. Key drivers for Saudi Arabia's dominance include:
- Growing Health & Wellness Consciousness: An increasing awareness of health issues and a desire for natural products.
- Government Support for Food Industry: Policies encouraging local food production and innovation.
- High Disposable Incomes: Enabling consumers to opt for premium, healthier food options.
- Increasing Investment in Food Processing: Manufacturers are investing in modern facilities to meet evolving consumer demands.
Among the segments, Flavor ingredients currently hold the largest market share, estimated at around 35% in the base year 2025. This dominance is attributed to the pervasive use of flavors in a vast array of food and beverage products, and the growing consumer preference for natural and authentic taste profiles. The Beverage application segment also leads, accounting for an estimated 30% of the market share. This is due to the high volume of processed beverages consumed across the region and the continuous innovation in the beverage industry, with a strong push towards healthier and more natural options, including juices, dairy drinks, and functional beverages. The Bakery and Confectionery segment is another significant contributor, driven by the demand for clean label ingredients in cakes, cookies, chocolates, and other popular treats.
Flavor Ingredients: Expected to continue its dominance due to the broad applicability across food categories and the demand for natural and authentic taste experiences.
Color Ingredients: Witnessing strong growth driven by consumer preference for natural food coloration derived from plant sources, addressing concerns about synthetic dyes.
Starch and Sweetener: Growing demand for natural sweeteners and modified starches that offer functional benefits with cleaner labels.
Preservative Ingredients: A steady growth as manufacturers seek natural alternatives to extend shelf life without compromising on consumer perception of health.
Other Types: This segment includes emulsifiers, texturizers, and other functional ingredients that are increasingly being sourced from natural origins.
Beverage Application: Dominant due to high consumption rates and the strong trend towards natural juices, teas, and functional drinks.
Bakery and Confectionery Application: Significant market share driven by indulgent yet increasingly health-conscious consumer choices.
Sauces and Condiments Application: Growing demand for clean label ketchup, mayonnaise, and other condiments with simpler ingredient lists.
Dairy and Frozen Dessert Application: Increasing adoption of natural ingredients in yogurts, ice creams, and cheese products.
Processed Foods Application: A growing segment as manufacturers of ready-to-eat meals and snacks focus on healthier formulations.
Other Applications: This encompasses a wide range of food products where clean label ingredients are being integrated.
The Rest of the Middle East & Africa region, encompassing countries like the UAE, Egypt, Nigeria, and Kenya, collectively represents a substantial and rapidly expanding market. These countries are witnessing increased urbanization, rising disposable incomes, and a growing awareness of health and wellness trends, mirroring the trajectory of Saudi Arabia, albeit at varying paces. The geographical segmentation highlights the overarching trend of increasing demand for natural and transparently labeled food products across the entire MEA landscape.
Middle East & Africa Clean Label Ingredients Market Product Developments
Product development in the Middle East & Africa clean label ingredients market is characterized by a focus on enhancing functionality and consumer appeal while adhering to natural sourcing. Innovations revolve around improved extraction and purification processes for natural colors and flavors, leading to more stable and vibrant options for food and beverage applications. The development of novel natural preservatives derived from plant extracts and fermentation is gaining traction, addressing shelf-life concerns without compromising clean label integrity. Furthermore, advancements in plant-based starches and sweeteners offer manufacturers versatile solutions for texture modification and sweetness enhancement with simplified ingredient lists. The competitive advantage lies in offering ingredients that not only meet stringent regulatory requirements but also deliver superior performance and cost-effectiveness, thereby enabling food manufacturers to seamlessly transition to clean label formulations that resonate with discerning consumers. Technological trends are heavily leaning towards bio-based ingredients and sustainable sourcing practices.
Key Drivers of Middle East & Africa Clean Label Ingredients Market Growth
The Middle East & Africa clean label ingredients market is propelled by several significant growth drivers. The escalating consumer demand for healthier and natural food products is a primary catalyst, fueled by increased health consciousness and a growing awareness of the potential risks associated with artificial additives. Technological advancements in ingredient processing, such as improved extraction methods and fermentation technologies, are making clean label ingredients more accessible and cost-effective. Stringent government regulations and evolving food safety standards across many MEA countries are also encouraging the adoption of clean label practices. Furthermore, rising disposable incomes and urbanization are leading to greater consumer spending on premium, health-oriented food and beverage options. The influence of global food trends and the desire for transparency in food labeling are also contributing to this growth.
Challenges in the Middle East & Africa Clean Label Ingredients Market Market
Despite its strong growth potential, the Middle East & Africa clean label ingredients market faces several challenges. Regulatory fragmentation across different countries can create complexities for ingredient manufacturers and food producers operating regionally. The higher cost of some natural ingredients compared to their synthetic counterparts can be a barrier, particularly for price-sensitive markets. Supply chain disruptions and limited local sourcing capabilities for certain specialized natural ingredients can impact availability and cost-effectiveness. Consumer education and awareness gaps in some sub-regions may slow down the adoption of clean label products. Finally, the competition from established players with strong R&D capabilities and extensive distribution networks presents a hurdle for newer entrants.
Emerging Opportunities in Middle East & Africa Clean Label Ingredients Market
Emerging opportunities in the Middle East & Africa clean label ingredients market are abundant and poised to drive long-term growth. The increasing trend towards plant-based diets presents a significant opportunity for developing and utilizing a wider range of plant-derived clean label ingredients. Strategic partnerships between ingredient suppliers, food manufacturers, and research institutions can accelerate innovation and market penetration. Investments in local manufacturing and sourcing capabilities for key clean label ingredients can reduce reliance on imports and enhance supply chain resilience. The growing e-commerce channels offer new avenues for direct-to-consumer sales of clean label food products, expanding market reach. Furthermore, the demand for clean label solutions in the processed foods and dairy & frozen dessert segments is still relatively untapped, offering substantial growth potential as these sectors mature in their clean label journey.
Leading Players in the Middle East & Africa Clean Label Ingredients Market Sector
- Firmenich SA
- Givaudan
- Archer Daniels Midland Company
- Chr Hansen Holding A/S
- JJT Group
- D D Williamson & Co
- Sensient Colors LLC
- Cargill Inc
- Bell Flavors & Fragrances GmbH
- GNT Group B V
Key Milestones in Middle East & Africa Clean Label Ingredients Market Industry
- 2019: Increased investment by major global ingredient players in understanding regional consumer preferences for natural ingredients across MEA.
- 2020: Launch of several new product lines featuring natural colors and flavors by regional beverage manufacturers in the UAE and Saudi Arabia.
- 2021: Expansion of fermentation-based ingredient production facilities by a key player in South Africa to cater to growing demand for natural preservatives.
- 2022: Several regional food expos across the Middle East highlight clean label ingredients as a key trend, leading to increased buyer-supplier engagements.
- 2023: Announcement of strategic collaborations between Middle Eastern food processors and international clean label ingredient specialists to develop tailored solutions.
- 2024 (early): Growing consumer demand for transparency in ingredient lists leads to greater media attention and advocacy for clean label products in key African markets.
Strategic Outlook for Middle East & Africa Clean Label Ingredients Market Market
The strategic outlook for the Middle East & Africa clean label ingredients market is highly positive, marked by sustained growth and increasing market sophistication. The future hinges on a multi-pronged approach encompassing continued innovation in natural ingredient sourcing and processing, fostering strategic alliances with local food manufacturers, and investing in consumer education to further drive demand. Companies that can offer cost-effective, high-performing clean label solutions tailored to the diverse palates and regulatory landscapes of the MEA region will be best positioned for success. The focus on sustainability and ethical sourcing will become increasingly important differentiators. Expansion into emerging economies within the Rest of the Middle East & Africa will unlock significant untapped market potential, particularly in sectors like processed foods and dairy. The market is expected to witness further consolidation and a rise in regional ingredient production capabilities.
Middle East & Africa Clean Label Ingredients Market Segmentation
-
1. Type
- 1.1. Color
- 1.2. Flavor
- 1.3. Starch and Sweetener
- 1.4. Preservative
- 1.5. Other Types
-
2. Application
- 2.1. Beverage
- 2.2. Bakery and Confectionery
- 2.3. Sauces and Condiments
- 2.4. Dairy and Frozen Dessert
- 2.5. Processed foods
- 2.6. Other Applications
-
3. Geography
- 3.1. Saudi Arabia
- 3.2. South Africa
- 3.3. Rest of the Middle East & Africa
Middle East & Africa Clean Label Ingredients Market Segmentation By Geography
- 1. Saudi Arabia
- 2. South Africa
- 3. Rest of the Middle East
Middle East & Africa Clean Label Ingredients Market Regional Market Share
Geographic Coverage of Middle East & Africa Clean Label Ingredients Market
Middle East & Africa Clean Label Ingredients Market REPORT HIGHLIGHTS
| Aspects | Details |
|---|---|
| Study Period | 2020-2034 |
| Base Year | 2025 |
| Estimated Year | 2026 |
| Forecast Period | 2026-2034 |
| Historical Period | 2020-2025 |
| Growth Rate | CAGR of 7.34% from 2020-2034 |
| Segmentation |
|
Table of Contents
- 1. Introduction
- 1.1. Research Scope
- 1.2. Market Segmentation
- 1.3. Research Methodology
- 1.4. Definitions and Assumptions
- 2. Executive Summary
- 2.1. Introduction
- 3. Market Dynamics
- 3.1. Introduction
- 3.2. Market Drivers
- 3.2.1. Inclination Towards Fitness and Increasing Intake of Plant-based Protein; Increase in Consumer Inclination Towards Meat Substitutes
- 3.3. Market Restrains
- 3.3.1. Gluten-Intolerance Among the Population Hindering the Market
- 3.4. Market Trends
- 3.4.1. Processed Foods are Likely to Foster the Market Growth in the Region
- 4. Market Factor Analysis
- 4.1. Porters Five Forces
- 4.2. Supply/Value Chain
- 4.3. PESTEL analysis
- 4.4. Market Entropy
- 4.5. Patent/Trademark Analysis
- 5. Middle East & Africa Clean Label Ingredients Market Analysis, Insights and Forecast, 2020-2032
- 5.1. Market Analysis, Insights and Forecast - by Type
- 5.1.1. Color
- 5.1.2. Flavor
- 5.1.3. Starch and Sweetener
- 5.1.4. Preservative
- 5.1.5. Other Types
- 5.2. Market Analysis, Insights and Forecast - by Application
- 5.2.1. Beverage
- 5.2.2. Bakery and Confectionery
- 5.2.3. Sauces and Condiments
- 5.2.4. Dairy and Frozen Dessert
- 5.2.5. Processed foods
- 5.2.6. Other Applications
- 5.3. Market Analysis, Insights and Forecast - by Geography
- 5.3.1. Saudi Arabia
- 5.3.2. South Africa
- 5.3.3. Rest of the Middle East & Africa
- 5.4. Market Analysis, Insights and Forecast - by Region
- 5.4.1. Saudi Arabia
- 5.4.2. South Africa
- 5.4.3. Rest of the Middle East
- 5.1. Market Analysis, Insights and Forecast - by Type
- 6. Saudi Arabia Middle East & Africa Clean Label Ingredients Market Analysis, Insights and Forecast, 2020-2032
- 6.1. Market Analysis, Insights and Forecast - by Type
- 6.1.1. Color
- 6.1.2. Flavor
- 6.1.3. Starch and Sweetener
- 6.1.4. Preservative
- 6.1.5. Other Types
- 6.2. Market Analysis, Insights and Forecast - by Application
- 6.2.1. Beverage
- 6.2.2. Bakery and Confectionery
- 6.2.3. Sauces and Condiments
- 6.2.4. Dairy and Frozen Dessert
- 6.2.5. Processed foods
- 6.2.6. Other Applications
- 6.3. Market Analysis, Insights and Forecast - by Geography
- 6.3.1. Saudi Arabia
- 6.3.2. South Africa
- 6.3.3. Rest of the Middle East & Africa
- 6.1. Market Analysis, Insights and Forecast - by Type
- 7. South Africa Middle East & Africa Clean Label Ingredients Market Analysis, Insights and Forecast, 2020-2032
- 7.1. Market Analysis, Insights and Forecast - by Type
- 7.1.1. Color
- 7.1.2. Flavor
- 7.1.3. Starch and Sweetener
- 7.1.4. Preservative
- 7.1.5. Other Types
- 7.2. Market Analysis, Insights and Forecast - by Application
- 7.2.1. Beverage
- 7.2.2. Bakery and Confectionery
- 7.2.3. Sauces and Condiments
- 7.2.4. Dairy and Frozen Dessert
- 7.2.5. Processed foods
- 7.2.6. Other Applications
- 7.3. Market Analysis, Insights and Forecast - by Geography
- 7.3.1. Saudi Arabia
- 7.3.2. South Africa
- 7.3.3. Rest of the Middle East & Africa
- 7.1. Market Analysis, Insights and Forecast - by Type
- 8. Rest of the Middle East Middle East & Africa Clean Label Ingredients Market Analysis, Insights and Forecast, 2020-2032
- 8.1. Market Analysis, Insights and Forecast - by Type
- 8.1.1. Color
- 8.1.2. Flavor
- 8.1.3. Starch and Sweetener
- 8.1.4. Preservative
- 8.1.5. Other Types
- 8.2. Market Analysis, Insights and Forecast - by Application
- 8.2.1. Beverage
- 8.2.2. Bakery and Confectionery
- 8.2.3. Sauces and Condiments
- 8.2.4. Dairy and Frozen Dessert
- 8.2.5. Processed foods
- 8.2.6. Other Applications
- 8.3. Market Analysis, Insights and Forecast - by Geography
- 8.3.1. Saudi Arabia
- 8.3.2. South Africa
- 8.3.3. Rest of the Middle East & Africa
- 8.1. Market Analysis, Insights and Forecast - by Type
- 9. Competitive Analysis
- 9.1. Market Share Analysis 2025
- 9.2. Company Profiles
- 9.2.1 Firmenich SA
- 9.2.1.1. Overview
- 9.2.1.2. Products
- 9.2.1.3. SWOT Analysis
- 9.2.1.4. Recent Developments
- 9.2.1.5. Financials (Based on Availability)
- 9.2.2 Givaudan
- 9.2.2.1. Overview
- 9.2.2.2. Products
- 9.2.2.3. SWOT Analysis
- 9.2.2.4. Recent Developments
- 9.2.2.5. Financials (Based on Availability)
- 9.2.3 Archer Daniels Midland Company
- 9.2.3.1. Overview
- 9.2.3.2. Products
- 9.2.3.3. SWOT Analysis
- 9.2.3.4. Recent Developments
- 9.2.3.5. Financials (Based on Availability)
- 9.2.4 Chr Hansen Holding A/S
- 9.2.4.1. Overview
- 9.2.4.2. Products
- 9.2.4.3. SWOT Analysis
- 9.2.4.4. Recent Developments
- 9.2.4.5. Financials (Based on Availability)
- 9.2.5 JJT Group
- 9.2.5.1. Overview
- 9.2.5.2. Products
- 9.2.5.3. SWOT Analysis
- 9.2.5.4. Recent Developments
- 9.2.5.5. Financials (Based on Availability)
- 9.2.6 D D Williamson & Co
- 9.2.6.1. Overview
- 9.2.6.2. Products
- 9.2.6.3. SWOT Analysis
- 9.2.6.4. Recent Developments
- 9.2.6.5. Financials (Based on Availability)
- 9.2.7 Sensient Colors LLC
- 9.2.7.1. Overview
- 9.2.7.2. Products
- 9.2.7.3. SWOT Analysis
- 9.2.7.4. Recent Developments
- 9.2.7.5. Financials (Based on Availability)
- 9.2.8 Cargill Inc
- 9.2.8.1. Overview
- 9.2.8.2. Products
- 9.2.8.3. SWOT Analysis
- 9.2.8.4. Recent Developments
- 9.2.8.5. Financials (Based on Availability)
- 9.2.9 Bell Flavors & Fragrances GmbH
- 9.2.9.1. Overview
- 9.2.9.2. Products
- 9.2.9.3. SWOT Analysis
- 9.2.9.4. Recent Developments
- 9.2.9.5. Financials (Based on Availability)
- 9.2.10 GNT Group B V *List Not Exhaustive
- 9.2.10.1. Overview
- 9.2.10.2. Products
- 9.2.10.3. SWOT Analysis
- 9.2.10.4. Recent Developments
- 9.2.10.5. Financials (Based on Availability)
- 9.2.1 Firmenich SA
List of Figures
- Figure 1: Middle East & Africa Clean Label Ingredients Market Revenue Breakdown (billion, %) by Product 2025 & 2033
- Figure 2: Middle East & Africa Clean Label Ingredients Market Share (%) by Company 2025
List of Tables
- Table 1: Middle East & Africa Clean Label Ingredients Market Revenue billion Forecast, by Type 2020 & 2033
- Table 2: Middle East & Africa Clean Label Ingredients Market Volume K Tons Forecast, by Type 2020 & 2033
- Table 3: Middle East & Africa Clean Label Ingredients Market Revenue billion Forecast, by Application 2020 & 2033
- Table 4: Middle East & Africa Clean Label Ingredients Market Volume K Tons Forecast, by Application 2020 & 2033
- Table 5: Middle East & Africa Clean Label Ingredients Market Revenue billion Forecast, by Geography 2020 & 2033
- Table 6: Middle East & Africa Clean Label Ingredients Market Volume K Tons Forecast, by Geography 2020 & 2033
- Table 7: Middle East & Africa Clean Label Ingredients Market Revenue billion Forecast, by Region 2020 & 2033
- Table 8: Middle East & Africa Clean Label Ingredients Market Volume K Tons Forecast, by Region 2020 & 2033
- Table 9: Middle East & Africa Clean Label Ingredients Market Revenue billion Forecast, by Type 2020 & 2033
- Table 10: Middle East & Africa Clean Label Ingredients Market Volume K Tons Forecast, by Type 2020 & 2033
- Table 11: Middle East & Africa Clean Label Ingredients Market Revenue billion Forecast, by Application 2020 & 2033
- Table 12: Middle East & Africa Clean Label Ingredients Market Volume K Tons Forecast, by Application 2020 & 2033
- Table 13: Middle East & Africa Clean Label Ingredients Market Revenue billion Forecast, by Geography 2020 & 2033
- Table 14: Middle East & Africa Clean Label Ingredients Market Volume K Tons Forecast, by Geography 2020 & 2033
- Table 15: Middle East & Africa Clean Label Ingredients Market Revenue billion Forecast, by Country 2020 & 2033
- Table 16: Middle East & Africa Clean Label Ingredients Market Volume K Tons Forecast, by Country 2020 & 2033
- Table 17: Middle East & Africa Clean Label Ingredients Market Revenue billion Forecast, by Type 2020 & 2033
- Table 18: Middle East & Africa Clean Label Ingredients Market Volume K Tons Forecast, by Type 2020 & 2033
- Table 19: Middle East & Africa Clean Label Ingredients Market Revenue billion Forecast, by Application 2020 & 2033
- Table 20: Middle East & Africa Clean Label Ingredients Market Volume K Tons Forecast, by Application 2020 & 2033
- Table 21: Middle East & Africa Clean Label Ingredients Market Revenue billion Forecast, by Geography 2020 & 2033
- Table 22: Middle East & Africa Clean Label Ingredients Market Volume K Tons Forecast, by Geography 2020 & 2033
- Table 23: Middle East & Africa Clean Label Ingredients Market Revenue billion Forecast, by Country 2020 & 2033
- Table 24: Middle East & Africa Clean Label Ingredients Market Volume K Tons Forecast, by Country 2020 & 2033
- Table 25: Middle East & Africa Clean Label Ingredients Market Revenue billion Forecast, by Type 2020 & 2033
- Table 26: Middle East & Africa Clean Label Ingredients Market Volume K Tons Forecast, by Type 2020 & 2033
- Table 27: Middle East & Africa Clean Label Ingredients Market Revenue billion Forecast, by Application 2020 & 2033
- Table 28: Middle East & Africa Clean Label Ingredients Market Volume K Tons Forecast, by Application 2020 & 2033
- Table 29: Middle East & Africa Clean Label Ingredients Market Revenue billion Forecast, by Geography 2020 & 2033
- Table 30: Middle East & Africa Clean Label Ingredients Market Volume K Tons Forecast, by Geography 2020 & 2033
- Table 31: Middle East & Africa Clean Label Ingredients Market Revenue billion Forecast, by Country 2020 & 2033
- Table 32: Middle East & Africa Clean Label Ingredients Market Volume K Tons Forecast, by Country 2020 & 2033
Frequently Asked Questions
1. What is the projected Compound Annual Growth Rate (CAGR) of the Middle East & Africa Clean Label Ingredients Market?
The projected CAGR is approximately 7.34%.
2. Which companies are prominent players in the Middle East & Africa Clean Label Ingredients Market?
Key companies in the market include Firmenich SA, Givaudan, Archer Daniels Midland Company, Chr Hansen Holding A/S, JJT Group, D D Williamson & Co, Sensient Colors LLC, Cargill Inc, Bell Flavors & Fragrances GmbH, GNT Group B V *List Not Exhaustive.
3. What are the main segments of the Middle East & Africa Clean Label Ingredients Market?
The market segments include Type, Application, Geography.
4. Can you provide details about the market size?
The market size is estimated to be USD 56.59 billion as of 2022.
5. What are some drivers contributing to market growth?
Inclination Towards Fitness and Increasing Intake of Plant-based Protein; Increase in Consumer Inclination Towards Meat Substitutes.
6. What are the notable trends driving market growth?
Processed Foods are Likely to Foster the Market Growth in the Region.
7. Are there any restraints impacting market growth?
Gluten-Intolerance Among the Population Hindering the Market.
8. Can you provide examples of recent developments in the market?
N/A
9. What pricing options are available for accessing the report?
Pricing options include single-user, multi-user, and enterprise licenses priced at USD 4750, USD 5250, and USD 8750 respectively.
10. Is the market size provided in terms of value or volume?
The market size is provided in terms of value, measured in billion and volume, measured in K Tons.
11. Are there any specific market keywords associated with the report?
Yes, the market keyword associated with the report is "Middle East & Africa Clean Label Ingredients Market," which aids in identifying and referencing the specific market segment covered.
12. How do I determine which pricing option suits my needs best?
The pricing options vary based on user requirements and access needs. Individual users may opt for single-user licenses, while businesses requiring broader access may choose multi-user or enterprise licenses for cost-effective access to the report.
13. Are there any additional resources or data provided in the Middle East & Africa Clean Label Ingredients Market report?
While the report offers comprehensive insights, it's advisable to review the specific contents or supplementary materials provided to ascertain if additional resources or data are available.
14. How can I stay updated on further developments or reports in the Middle East & Africa Clean Label Ingredients Market?
To stay informed about further developments, trends, and reports in the Middle East & Africa Clean Label Ingredients Market, consider subscribing to industry newsletters, following relevant companies and organizations, or regularly checking reputable industry news sources and publications.
Methodology
Step 1 - Identification of Relevant Samples Size from Population Database


Step 2 - Approaches for Defining Global Market Size (Value, Volume* & Price*)

Note*: In applicable scenarios
Step 3 - Data Sources
Primary Research
- Web Analytics
- Survey Reports
- Research Institute
- Latest Research Reports
- Opinion Leaders
Secondary Research
- Annual Reports
- White Paper
- Latest Press Release
- Industry Association
- Paid Database
- Investor Presentations

Step 4 - Data Triangulation
Involves using different sources of information in order to increase the validity of a study
These sources are likely to be stakeholders in a program - participants, other researchers, program staff, other community members, and so on.
Then we put all data in single framework & apply various statistical tools to find out the dynamic on the market.
During the analysis stage, feedback from the stakeholder groups would be compared to determine areas of agreement as well as areas of divergence