

Key Insights
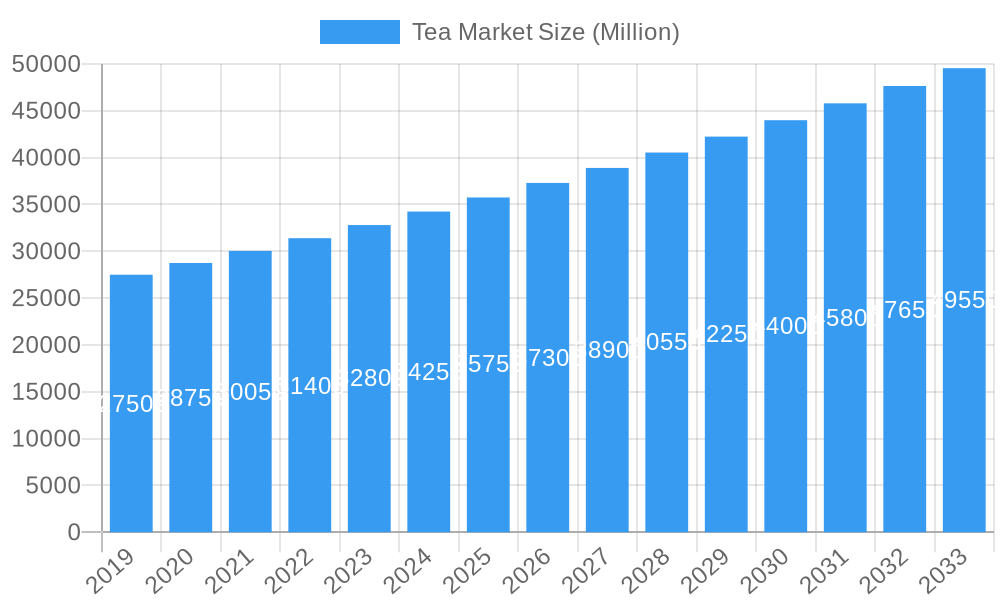
The global tea market is poised for substantial expansion, with a projected market size of $1.54 billion by 2025, exhibiting a robust Compound Annual Growth Rate (CAGR) of 3.7%. This growth is propelled by a confluence of factors, including rising consumer preference for healthier beverage alternatives, the increasing allure of specialty and premium tea varieties, and heightened awareness of the health benefits intrinsic to diverse tea types. Escalating disposable incomes in emerging economies further democratize access to premium tea offerings. Innovations in product development, encompassing flavored teas, convenient ready-to-drink (RTD) options, and functional teas with targeted health advantages, are actively attracting new consumer segments and broadening market penetration. Extensive availability across varied distribution channels, from major retail chains to specialized online platforms, ensures effortless consumer access to a wide array of tea products, reinforcing market dynamism.
Tea Market Market Size (In Billion)
Key market trends include a surging demand for organic and sustainably sourced teas, reflecting growing consumer commitment to environmental and social responsibility. The remarkable rise of herbal and functional teas, fortified with ingredients such as turmeric, ginger, and adaptogens, is another significant growth catalyst, driven by consumer pursuit of wellness-enhancing beverages. While the market demonstrates strong momentum, challenges persist, notably the price fluctuations of raw materials and vigorous competition from other beverage categories like coffee and energy drinks. Nevertheless, strategic market expansion in developing regions, continuous product innovation, and impactful marketing that emphasizes tea's unique qualities are anticipated to facilitate market resilience and sustained growth. The market's inherent diversity, spanning leaf tea, CTC tea, and a broad spectrum of black, green, and herbal infusions, alongside multifaceted distribution networks, underscores its extensive potential and adaptability.
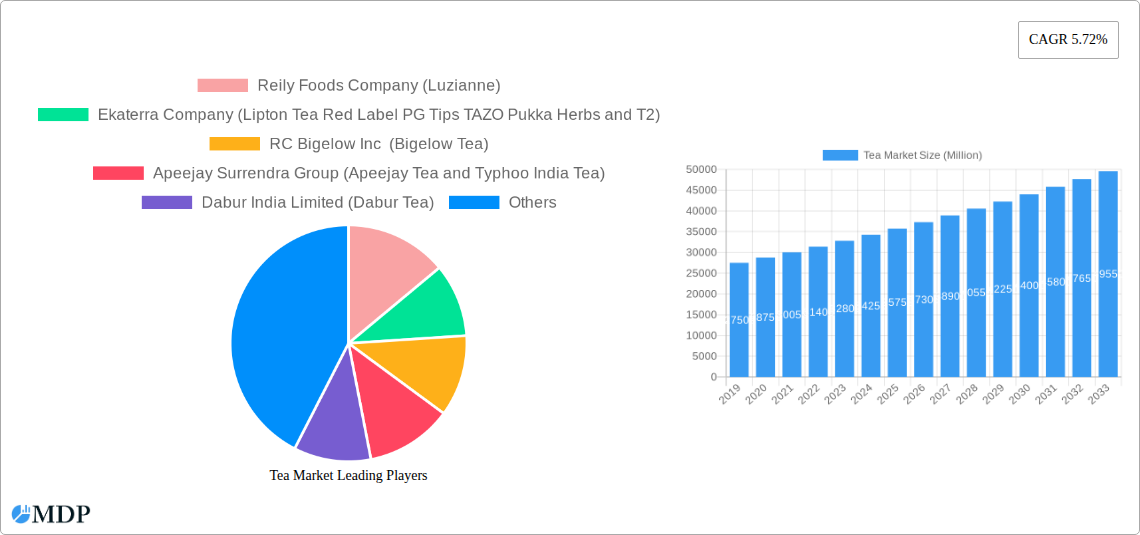
Tea Market Company Market Share
Unveiling the Global Tea Market: Growth, Trends, and Strategic Insights (2019-2033)
This comprehensive report provides an in-depth analysis of the global tea market, encompassing a detailed examination of market dynamics, industry trends, leading segments, product innovations, key growth drivers, challenges, emerging opportunities, and the strategic landscape. Covering the historical period of 2019–2024, the base year of 2025, and an extensive forecast period from 2025 to 2033, this report offers actionable insights for stakeholders seeking to navigate and capitalize on the evolving tea industry. Our analysis delves into crucial segments including leaf tea, CTC tea, other forms, black tea, green tea, herbal tea, other product types, supermarkets/hypermarkets, specialist retailers, convenience stores, and other distribution channels. The report also highlights key developments from prominent companies such as Reily Foods Company (Luzianne), Ekaterra Company (Lipton Tea Red Label PG Tips TAZO Pukka Herbs and T2), RC Bigelow Inc (Bigelow Tea), Apeejay Surrendra Group (Apeejay Tea and Typhoo India Tea), Dabur India Limited (Dabur Tea), Yogi Tea (Yogi Tea), Bettys & Taylors of Harrogate Limited (Taylors of Harrogate Bettys and Yorkshire Tea), Associated British Foods PLC (Twinings), Clipper Tea Company (Clipper Tea), Hain Celestial Group (Celestial Seasonings), and Tata Group (Tata Tea Tetley Good Earth Teapigs Vitax and Joekels). With a focus on high-traffic keywords like tea market size, tea market share, tea market growth, black tea market, green tea market, herbal tea market, and specialty tea, this report is optimized for maximum search visibility.
Tea Market Market Dynamics & Concentration
The global tea market exhibits moderate to high concentration, with a significant portion of market share held by a few dominant players. Innovation drivers are largely centered around product diversification, health and wellness benefits, and sustainable sourcing practices. Regulatory frameworks, while generally supportive of food and beverage industries, can vary by region, influencing product labeling, ingredient standards, and import/export policies. Product substitutes, including coffee, energy drinks, and functional beverages, present a constant competitive pressure. End-user trends increasingly favor premium, organic, and ethically sourced teas, with a growing demand for functional teas offering specific health benefits. Mergers and acquisitions (M&A) activities are a notable aspect of market dynamics, with several significant deals impacting market structure and competitive landscape. For instance, the acquisition of Ekaterra by CVC Capital Partners highlights consolidation efforts. M&A deal counts in recent years have indicated strategic moves to expand product portfolios, geographical reach, and market access within the tea industry. Understanding these dynamics is crucial for forecasting future tea market trends and competitive strategies.
Tea Market Industry Trends & Analysis
The tea market is experiencing robust growth, fueled by a confluence of factors including rising disposable incomes, increasing health consciousness, and the expanding availability of diverse tea varieties. The projected Compound Annual Growth Rate (CAGR) for the tea market is substantial, indicating a dynamic and expanding industry. Market penetration is deepening across both developed and emerging economies, as consumers become more aware of the health benefits associated with tea consumption, particularly green tea and herbal tea. Technological disruptions are evident in advancements in cultivation techniques, processing methods, and innovative packaging solutions that enhance shelf life and consumer appeal. The surge in demand for specialty teas, including single-origin, organic, and artisanal blends, reflects a shift in consumer preferences towards premium and unique experiences. Competitive dynamics are intensifying, with established players continuously innovating their product offerings and marketing strategies to capture market share, while newer entrants are leveraging niche segments and direct-to-consumer models. The tea market size is projected to reach new heights driven by these underlying tea market trends.
Leading Markets & Segments in Tea Market
The tea market is characterized by strong regional dominance, with Asia-Pacific emerging as the largest and fastest-growing market, driven by a deeply ingrained tea culture and a burgeoning middle class. Within product types, black tea continues to hold a significant market share globally, but green tea and herbal tea are experiencing remarkable growth rates due to their perceived health advantages. The leaf tea segment generally commands a premium, while CTC (Crush, Tear, Curl) tea remains dominant in high-volume markets for its consistency and affordability. The distribution channel landscape is evolving, with supermarkets/hypermarkets still holding a substantial share, but specialist retailers and online platforms are gaining traction for premium and niche products.
- Dominant Region: Asia-Pacific's dominance is supported by:
- High per capita tea consumption.
- Significant domestic production capabilities.
- Growing disposable incomes and urbanization.
- Favorable government policies promoting tea cultivation and export.
- Dominant Product Type: While black tea leads, the rapid expansion of green tea and herbal tea is a key tea market trend.
- Green Tea Drivers: Increasing awareness of antioxidants and metabolism-boosting properties, rise in health-conscious consumers.
- Herbal Tea Drivers: Demand for caffeine-free options, therapeutic benefits (e.g., chamomile for relaxation, mint for digestion), growing interest in natural remedies.
- Dominant Form: Leaf tea caters to the premium segment, while CTC tea is vital for mass market consumption.
- Leaf Tea Dominance: Appeals to connoisseurs seeking nuanced flavors and traditional brewing methods.
- CTC Tea Dominance: Cost-effectiveness and suitability for mass production of popular tea blends.
- Dominant Distribution Channel: Supermarkets/Hypermarkets remain the primary channel, but the growth of online sales is significant.
- Supermarket/Hypermarket Advantages: Wide reach, convenience, and the ability to offer a broad range of products.
- Specialist Retailer Growth: Focus on curated selections, premium brands, and personalized customer experiences, contributing to specialty tea market growth.
Tea Market Product Developments
Product development in the tea market is a dynamic arena, driven by consumer demand for novel flavors, functional benefits, and sustainable offerings. Innovations range from the introduction of unique herbal blends and functional teas fortified with vitamins and adaptogens to the development of ready-to-drink (RTD) tea beverages with reduced sugar content. Companies are focusing on premiumization, with a rise in single-origin and artisanal teas that highlight distinct terroir and flavor profiles. The competitive advantage lies in appealing to evolving consumer lifestyles, health aspirations, and ethical consumption patterns. Technological advancements in processing and packaging are also crucial for maintaining product quality and extending shelf life, making these innovative products more accessible to a wider audience. This continuous innovation is a key factor shaping the future tea market growth.
Key Drivers of Tea Market Growth
Several key factors are propelling the tea market growth. The escalating global awareness of tea's health benefits, particularly antioxidants and its potential to reduce the risk of chronic diseases, is a primary driver. Economic factors, including rising disposable incomes in emerging economies, are making premium and specialty teas more accessible. Technological advancements in cultivation, processing, and brewing methods are enhancing product quality and variety. Furthermore, supportive government initiatives in various countries aimed at promoting tea production and consumption, coupled with innovative marketing campaigns by leading tea companies, are significantly contributing to market expansion. The increasing demand for natural and functional beverages further fuels the growth of herbal tea and green tea segments.
Challenges in the Tea Market Market
Despite its growth trajectory, the tea market faces several challenges. Volatile climate conditions and the impact of climate change on tea cultivation can lead to supply chain disruptions and price fluctuations, directly affecting tea market share. Stringent and varying regulatory frameworks across different countries can pose hurdles for international trade and product compliance. Intense competition from other beverage categories, such as coffee, energy drinks, and juices, necessitates continuous innovation and effective marketing to retain consumer loyalty. Furthermore, maintaining consistent quality and ensuring sustainable sourcing practices throughout complex global supply chains can be a significant operational challenge for tea brands.
Emerging Opportunities in Tea Market
The tea market is ripe with emerging opportunities that promise long-term growth. The burgeoning demand for organic and sustainably sourced teas presents a significant avenue for brands committed to ethical practices. The growth of the functional beverage segment offers substantial potential for herbal tea and specialized green tea blends infused with health-boosting ingredients. Technological advancements in direct-to-consumer (DTC) sales models and e-commerce platforms are enabling smaller, niche brands to reach a global audience and build direct relationships with consumers. Strategic partnerships and collaborations between tea producers, ingredient suppliers, and health and wellness organizations can unlock new product categories and market segments, further driving tea market size.
Leading Players in the Tea Market Sector
- Reily Foods Company (Luzianne)
- Ekaterra Company (Lipton Tea Red Label PG Tips TAZO Pukka Herbs and T2)
- RC Bigelow Inc (Bigelow Tea)
- Apeejay Surrendra Group (Apeejay Tea and Typhoo India Tea)
- Dabur India Limited (Dabur Tea)
- Yogi Tea (Yogi Tea)
- Bettys & Taylors of Harrogate Limited (Taylors of Harrogate Bettys and Yorkshire Tea)
- Associated British Foods PLC (Twinings)
- Clipper Tea Company (Clipper Tea)
- Hain Celestial Group (Celestial Seasonings)
- Tata Group (Tata Tea Tetley Good Earth Teapigs Vitax and Joekels)
Key Milestones in Tea Market Industry
- November 2022: Dabur India Limited launched Dabur Vedic Tea, a premium black tea infused with over 30 ayurvedic herbs, emphasizing health benefits and immunity boosting properties. This launch highlights the growing trend of functional teas in the tea market.
- November 2022: Tata Consumer Products expanded its green tea portfolio with the introduction of Tetley Green Tea with tulsi flavor. This move underscores the sustained demand for green tea and its perceived immunity-enhancing qualities.
- July 2022: CVC Capital Partners Fund VIII finalized the acquisition of Ekaterra, the tea business formerly owned by Unilever. This significant M&A transaction, valued at EUR 4.5 billion (USD 4.83 billion), signifies consolidation within the global tea industry.
Strategic Outlook for Tea Market Market
The strategic outlook for the tea market remains exceptionally positive, driven by sustained consumer interest in health and wellness, coupled with an increasing demand for premium and artisanal products. Growth accelerators will include continued innovation in herbal tea and functional beverage segments, expansion into untapped emerging markets, and the leveraging of digital platforms for enhanced consumer engagement and direct sales. Companies that prioritize sustainable sourcing, transparent supply chains, and authentic brand narratives will likely capture a larger tea market share. Furthermore, strategic collaborations and targeted M&A activities will play a crucial role in consolidating market presence and expanding product portfolios to meet evolving consumer preferences, ensuring robust tea market growth in the forecast period.
Tea Market Segmentation
-
1. Form
- 1.1. Leaf Tea
- 1.2. CTC Tea
- 1.3. Other Forms
-
2. Product Type
- 2.1. Black Tea
- 2.2. Green Tea
- 2.3. Herbal Tea
- 2.4. Other Product Types
-
3. Distribution Channel
- 3.1. Supermarkets/Hypermarkets
- 3.2. Specialist Retailers
- 3.3. Convenience Stores
- 3.4. Other Distribution Channels
Tea Market Segmentation By Geography
-
1. North America
- 1.1. United States
- 1.2. Canada
- 1.3. Mexico
- 1.4. Rest of North America
-
2. Europe
- 2.1. United Kingdom
- 2.2. Germany
- 2.3. France
- 2.4. Spain
- 2.5. Italy
- 2.6. Russia
- 2.7. Rest of Europe
-
3. Asia Pacific
- 3.1. China
- 3.2. Japan
- 3.3. India
- 3.4. Australia
- 3.5. Rest of Asia Pacific
-
4. South America
- 4.1. Brazil
- 4.2. Argentina
- 4.3. Rest of South America
-
5. Middle East and Africa
- 5.1. South Africa
- 5.2. United Arab Emirates
- 5.3. Rest of Middle East and Africa
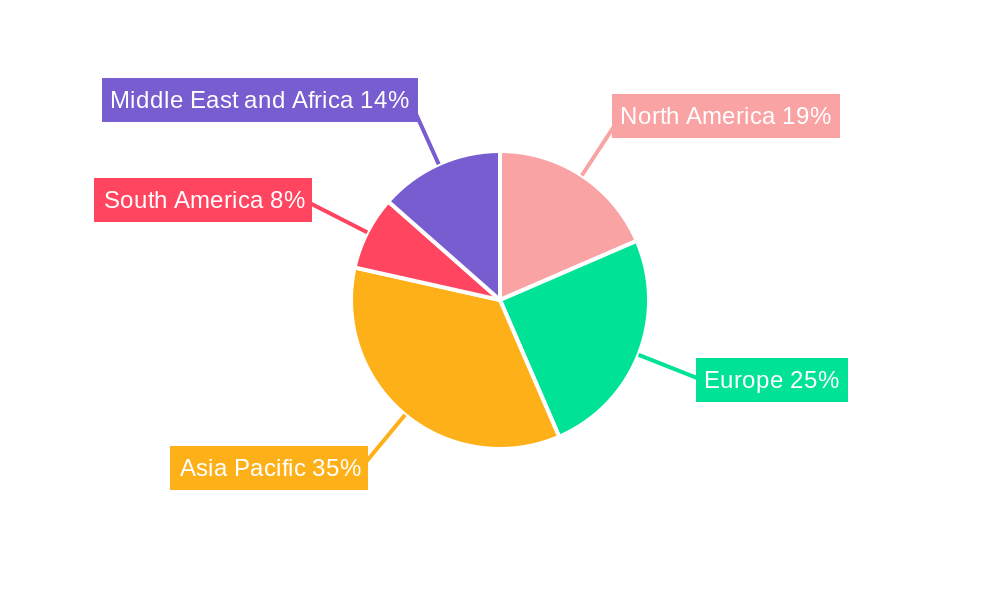
Tea Market Regional Market Share
Geographic Coverage of Tea Market
Tea Market REPORT HIGHLIGHTS
| Aspects | Details |
|---|---|
| Study Period | 2020-2034 |
| Base Year | 2025 |
| Estimated Year | 2026 |
| Forecast Period | 2026-2034 |
| Historical Period | 2020-2025 |
| Growth Rate | CAGR of 3.7% from 2020-2034 |
| Segmentation |
|
Table of Contents
- 1. Introduction
- 1.1. Research Scope
- 1.2. Market Segmentation
- 1.3. Research Objective
- 1.4. Definitions and Assumptions
- 2. Executive Summary
- 2.1. Market Snapshot
- 3. Market Dynamics
- 3.1. Market Drivers
- 3.2. Market Restrains
- 3.3. Market Trends
- 3.4. Market Opportunities
- 4. Market Factor Analysis
- 4.1. Porters Five Forces
- 4.1.1. Bargaining Power of Suppliers
- 4.1.2. Bargaining Power of Buyers
- 4.1.3. Threat of New Entrants
- 4.1.4. Threat of Substitutes
- 4.1.5. Competitive Rivalry
- 4.2. PESTEL analysis
- 4.3. BCG Analysis
- 4.3.1. Stars (High Growth, High Market Share)
- 4.3.2. Cash Cows (Low Growth, High Market Share)
- 4.3.3. Question Mark (High Growth, Low Market Share)
- 4.3.4. Dogs (Low Growth, Low Market Share)
- 4.4. Ansoff Matrix Analysis
- 4.5. Supply Chain Analysis
- 4.6. Regulatory Landscape
- 4.7. Current Market Potential and Opportunity Assessment (TAM–SAM–SOM Framework)
- 4.8. MDP Analyst Note
- 4.1. Porters Five Forces
- 5. Market Analysis, Insights and Forecast 2021-2033
- 5.1. Market Analysis, Insights and Forecast - by Form
- 5.1.1. Leaf Tea
- 5.1.2. CTC Tea
- 5.1.3. Other Forms
- 5.2. Market Analysis, Insights and Forecast - by Product Type
- 5.2.1. Black Tea
- 5.2.2. Green Tea
- 5.2.3. Herbal Tea
- 5.2.4. Other Product Types
- 5.3. Market Analysis, Insights and Forecast - by Distribution Channel
- 5.3.1. Supermarkets/Hypermarkets
- 5.3.2. Specialist Retailers
- 5.3.3. Convenience Stores
- 5.3.4. Other Distribution Channels
- 5.4. Market Analysis, Insights and Forecast - by Region
- 5.4.1. North America
- 5.4.2. Europe
- 5.4.3. Asia Pacific
- 5.4.4. South America
- 5.4.5. Middle East and Africa
- 5.1. Market Analysis, Insights and Forecast - by Form
- 6. Global Tea Market Analysis, Insights and Forecast, 2021-2033
- 6.1. Market Analysis, Insights and Forecast - by Form
- 6.1.1. Leaf Tea
- 6.1.2. CTC Tea
- 6.1.3. Other Forms
- 6.2. Market Analysis, Insights and Forecast - by Product Type
- 6.2.1. Black Tea
- 6.2.2. Green Tea
- 6.2.3. Herbal Tea
- 6.2.4. Other Product Types
- 6.3. Market Analysis, Insights and Forecast - by Distribution Channel
- 6.3.1. Supermarkets/Hypermarkets
- 6.3.2. Specialist Retailers
- 6.3.3. Convenience Stores
- 6.3.4. Other Distribution Channels
- 6.1. Market Analysis, Insights and Forecast - by Form
- 7. North America Tea Market Analysis, Insights and Forecast, 2020-2032
- 7.1. Market Analysis, Insights and Forecast - by Form
- 7.1.1. Leaf Tea
- 7.1.2. CTC Tea
- 7.1.3. Other Forms
- 7.2. Market Analysis, Insights and Forecast - by Product Type
- 7.2.1. Black Tea
- 7.2.2. Green Tea
- 7.2.3. Herbal Tea
- 7.2.4. Other Product Types
- 7.3. Market Analysis, Insights and Forecast - by Distribution Channel
- 7.3.1. Supermarkets/Hypermarkets
- 7.3.2. Specialist Retailers
- 7.3.3. Convenience Stores
- 7.3.4. Other Distribution Channels
- 7.1. Market Analysis, Insights and Forecast - by Form
- 8. Europe Tea Market Analysis, Insights and Forecast, 2020-2032
- 8.1. Market Analysis, Insights and Forecast - by Form
- 8.1.1. Leaf Tea
- 8.1.2. CTC Tea
- 8.1.3. Other Forms
- 8.2. Market Analysis, Insights and Forecast - by Product Type
- 8.2.1. Black Tea
- 8.2.2. Green Tea
- 8.2.3. Herbal Tea
- 8.2.4. Other Product Types
- 8.3. Market Analysis, Insights and Forecast - by Distribution Channel
- 8.3.1. Supermarkets/Hypermarkets
- 8.3.2. Specialist Retailers
- 8.3.3. Convenience Stores
- 8.3.4. Other Distribution Channels
- 8.1. Market Analysis, Insights and Forecast - by Form
- 9. Asia Pacific Tea Market Analysis, Insights and Forecast, 2020-2032
- 9.1. Market Analysis, Insights and Forecast - by Form
- 9.1.1. Leaf Tea
- 9.1.2. CTC Tea
- 9.1.3. Other Forms
- 9.2. Market Analysis, Insights and Forecast - by Product Type
- 9.2.1. Black Tea
- 9.2.2. Green Tea
- 9.2.3. Herbal Tea
- 9.2.4. Other Product Types
- 9.3. Market Analysis, Insights and Forecast - by Distribution Channel
- 9.3.1. Supermarkets/Hypermarkets
- 9.3.2. Specialist Retailers
- 9.3.3. Convenience Stores
- 9.3.4. Other Distribution Channels
- 9.1. Market Analysis, Insights and Forecast - by Form
- 10. South America Tea Market Analysis, Insights and Forecast, 2020-2032
- 10.1. Market Analysis, Insights and Forecast - by Form
- 10.1.1. Leaf Tea
- 10.1.2. CTC Tea
- 10.1.3. Other Forms
- 10.2. Market Analysis, Insights and Forecast - by Product Type
- 10.2.1. Black Tea
- 10.2.2. Green Tea
- 10.2.3. Herbal Tea
- 10.2.4. Other Product Types
- 10.3. Market Analysis, Insights and Forecast - by Distribution Channel
- 10.3.1. Supermarkets/Hypermarkets
- 10.3.2. Specialist Retailers
- 10.3.3. Convenience Stores
- 10.3.4. Other Distribution Channels
- 10.1. Market Analysis, Insights and Forecast - by Form
- 11. Middle East and Africa Tea Market Analysis, Insights and Forecast, 2020-2032
- 11.1. Market Analysis, Insights and Forecast - by Form
- 11.1.1. Leaf Tea
- 11.1.2. CTC Tea
- 11.1.3. Other Forms
- 11.2. Market Analysis, Insights and Forecast - by Product Type
- 11.2.1. Black Tea
- 11.2.2. Green Tea
- 11.2.3. Herbal Tea
- 11.2.4. Other Product Types
- 11.3. Market Analysis, Insights and Forecast - by Distribution Channel
- 11.3.1. Supermarkets/Hypermarkets
- 11.3.2. Specialist Retailers
- 11.3.3. Convenience Stores
- 11.3.4. Other Distribution Channels
- 11.1. Market Analysis, Insights and Forecast - by Form
- 12. Competitive Analysis
- 12.1. Company Profiles
- 12.1.1 Reily Foods Company (Luzianne)
- 12.1.1.1. Company Overview
- 12.1.1.2. Products
- 12.1.1.3. Company Financials
- 12.1.1.4. SWOT Analysis
- 12.1.2 Ekaterra Company (Lipton Tea Red Label PG Tips TAZO Pukka Herbs and T2)
- 12.1.2.1. Company Overview
- 12.1.2.2. Products
- 12.1.2.3. Company Financials
- 12.1.2.4. SWOT Analysis
- 12.1.3 RC Bigelow Inc (Bigelow Tea)
- 12.1.3.1. Company Overview
- 12.1.3.2. Products
- 12.1.3.3. Company Financials
- 12.1.3.4. SWOT Analysis
- 12.1.4 Apeejay Surrendra Group (Apeejay Tea and Typhoo India Tea)
- 12.1.4.1. Company Overview
- 12.1.4.2. Products
- 12.1.4.3. Company Financials
- 12.1.4.4. SWOT Analysis
- 12.1.5 Dabur India Limited (Dabur Tea)
- 12.1.5.1. Company Overview
- 12.1.5.2. Products
- 12.1.5.3. Company Financials
- 12.1.5.4. SWOT Analysis
- 12.1.6 Yogi Tea (Yogi Tea)
- 12.1.6.1. Company Overview
- 12.1.6.2. Products
- 12.1.6.3. Company Financials
- 12.1.6.4. SWOT Analysis
- 12.1.7 Bettys & Taylors of Harrogate Limited (Taylors of Harrogate Bettys and Yorkshire Tea)
- 12.1.7.1. Company Overview
- 12.1.7.2. Products
- 12.1.7.3. Company Financials
- 12.1.7.4. SWOT Analysis
- 12.1.8 Associated British Foods PLC (Twinings)
- 12.1.8.1. Company Overview
- 12.1.8.2. Products
- 12.1.8.3. Company Financials
- 12.1.8.4. SWOT Analysis
- 12.1.9 Clipper Tea Company (Clipper Tea)
- 12.1.9.1. Company Overview
- 12.1.9.2. Products
- 12.1.9.3. Company Financials
- 12.1.9.4. SWOT Analysis
- 12.1.10 Hain Celestial Group (Celestial Seasonings)
- 12.1.10.1. Company Overview
- 12.1.10.2. Products
- 12.1.10.3. Company Financials
- 12.1.10.4. SWOT Analysis
- 12.1.11 Tata Group (Tata Tea Tetley Good Earth Teapigs Vitax and Joekels)
- 12.1.11.1. Company Overview
- 12.1.11.2. Products
- 12.1.11.3. Company Financials
- 12.1.11.4. SWOT Analysis
- 12.1.1 Reily Foods Company (Luzianne)
- 12.2. Market Entropy
- 12.2.1 Company's Key Areas Served
- 12.2.2 Recent Developments
- 12.3. Company Market Share Analysis 2025
- 12.3.1 Top 5 Companies Market Share Analysis
- 12.3.2 Top 3 Companies Market Share Analysis
- 12.4. List of Potential Customers
- 13. Research Methodology
List of Figures
- Figure 1: Global Tea Market Revenue Breakdown (billion, %) by Region 2025 & 2033
- Figure 2: Global Tea Market Volume Breakdown (K Tons, %) by Region 2025 & 2033
- Figure 3: North America Tea Market Revenue (billion), by Form 2025 & 2033
- Figure 4: North America Tea Market Volume (K Tons), by Form 2025 & 2033
- Figure 5: North America Tea Market Revenue Share (%), by Form 2025 & 2033
- Figure 6: North America Tea Market Volume Share (%), by Form 2025 & 2033
- Figure 7: North America Tea Market Revenue (billion), by Product Type 2025 & 2033
- Figure 8: North America Tea Market Volume (K Tons), by Product Type 2025 & 2033
- Figure 9: North America Tea Market Revenue Share (%), by Product Type 2025 & 2033
- Figure 10: North America Tea Market Volume Share (%), by Product Type 2025 & 2033
- Figure 11: North America Tea Market Revenue (billion), by Distribution Channel 2025 & 2033
- Figure 12: North America Tea Market Volume (K Tons), by Distribution Channel 2025 & 2033
- Figure 13: North America Tea Market Revenue Share (%), by Distribution Channel 2025 & 2033
- Figure 14: North America Tea Market Volume Share (%), by Distribution Channel 2025 & 2033
- Figure 15: North America Tea Market Revenue (billion), by Country 2025 & 2033
- Figure 16: North America Tea Market Volume (K Tons), by Country 2025 & 2033
- Figure 17: North America Tea Market Revenue Share (%), by Country 2025 & 2033
- Figure 18: North America Tea Market Volume Share (%), by Country 2025 & 2033
- Figure 19: Europe Tea Market Revenue (billion), by Form 2025 & 2033
- Figure 20: Europe Tea Market Volume (K Tons), by Form 2025 & 2033
- Figure 21: Europe Tea Market Revenue Share (%), by Form 2025 & 2033
- Figure 22: Europe Tea Market Volume Share (%), by Form 2025 & 2033
- Figure 23: Europe Tea Market Revenue (billion), by Product Type 2025 & 2033
- Figure 24: Europe Tea Market Volume (K Tons), by Product Type 2025 & 2033
- Figure 25: Europe Tea Market Revenue Share (%), by Product Type 2025 & 2033
- Figure 26: Europe Tea Market Volume Share (%), by Product Type 2025 & 2033
- Figure 27: Europe Tea Market Revenue (billion), by Distribution Channel 2025 & 2033
- Figure 28: Europe Tea Market Volume (K Tons), by Distribution Channel 2025 & 2033
- Figure 29: Europe Tea Market Revenue Share (%), by Distribution Channel 2025 & 2033
- Figure 30: Europe Tea Market Volume Share (%), by Distribution Channel 2025 & 2033
- Figure 31: Europe Tea Market Revenue (billion), by Country 2025 & 2033
- Figure 32: Europe Tea Market Volume (K Tons), by Country 2025 & 2033
- Figure 33: Europe Tea Market Revenue Share (%), by Country 2025 & 2033
- Figure 34: Europe Tea Market Volume Share (%), by Country 2025 & 2033
- Figure 35: Asia Pacific Tea Market Revenue (billion), by Form 2025 & 2033
- Figure 36: Asia Pacific Tea Market Volume (K Tons), by Form 2025 & 2033
- Figure 37: Asia Pacific Tea Market Revenue Share (%), by Form 2025 & 2033
- Figure 38: Asia Pacific Tea Market Volume Share (%), by Form 2025 & 2033
- Figure 39: Asia Pacific Tea Market Revenue (billion), by Product Type 2025 & 2033
- Figure 40: Asia Pacific Tea Market Volume (K Tons), by Product Type 2025 & 2033
- Figure 41: Asia Pacific Tea Market Revenue Share (%), by Product Type 2025 & 2033
- Figure 42: Asia Pacific Tea Market Volume Share (%), by Product Type 2025 & 2033
- Figure 43: Asia Pacific Tea Market Revenue (billion), by Distribution Channel 2025 & 2033
- Figure 44: Asia Pacific Tea Market Volume (K Tons), by Distribution Channel 2025 & 2033
- Figure 45: Asia Pacific Tea Market Revenue Share (%), by Distribution Channel 2025 & 2033
- Figure 46: Asia Pacific Tea Market Volume Share (%), by Distribution Channel 2025 & 2033
- Figure 47: Asia Pacific Tea Market Revenue (billion), by Country 2025 & 2033
- Figure 48: Asia Pacific Tea Market Volume (K Tons), by Country 2025 & 2033
- Figure 49: Asia Pacific Tea Market Revenue Share (%), by Country 2025 & 2033
- Figure 50: Asia Pacific Tea Market Volume Share (%), by Country 2025 & 2033
- Figure 51: South America Tea Market Revenue (billion), by Form 2025 & 2033
- Figure 52: South America Tea Market Volume (K Tons), by Form 2025 & 2033
- Figure 53: South America Tea Market Revenue Share (%), by Form 2025 & 2033
- Figure 54: South America Tea Market Volume Share (%), by Form 2025 & 2033
- Figure 55: South America Tea Market Revenue (billion), by Product Type 2025 & 2033
- Figure 56: South America Tea Market Volume (K Tons), by Product Type 2025 & 2033
- Figure 57: South America Tea Market Revenue Share (%), by Product Type 2025 & 2033
- Figure 58: South America Tea Market Volume Share (%), by Product Type 2025 & 2033
- Figure 59: South America Tea Market Revenue (billion), by Distribution Channel 2025 & 2033
- Figure 60: South America Tea Market Volume (K Tons), by Distribution Channel 2025 & 2033
- Figure 61: South America Tea Market Revenue Share (%), by Distribution Channel 2025 & 2033
- Figure 62: South America Tea Market Volume Share (%), by Distribution Channel 2025 & 2033
- Figure 63: South America Tea Market Revenue (billion), by Country 2025 & 2033
- Figure 64: South America Tea Market Volume (K Tons), by Country 2025 & 2033
- Figure 65: South America Tea Market Revenue Share (%), by Country 2025 & 2033
- Figure 66: South America Tea Market Volume Share (%), by Country 2025 & 2033
- Figure 67: Middle East and Africa Tea Market Revenue (billion), by Form 2025 & 2033
- Figure 68: Middle East and Africa Tea Market Volume (K Tons), by Form 2025 & 2033
- Figure 69: Middle East and Africa Tea Market Revenue Share (%), by Form 2025 & 2033
- Figure 70: Middle East and Africa Tea Market Volume Share (%), by Form 2025 & 2033
- Figure 71: Middle East and Africa Tea Market Revenue (billion), by Product Type 2025 & 2033
- Figure 72: Middle East and Africa Tea Market Volume (K Tons), by Product Type 2025 & 2033
- Figure 73: Middle East and Africa Tea Market Revenue Share (%), by Product Type 2025 & 2033
- Figure 74: Middle East and Africa Tea Market Volume Share (%), by Product Type 2025 & 2033
- Figure 75: Middle East and Africa Tea Market Revenue (billion), by Distribution Channel 2025 & 2033
- Figure 76: Middle East and Africa Tea Market Volume (K Tons), by Distribution Channel 2025 & 2033
- Figure 77: Middle East and Africa Tea Market Revenue Share (%), by Distribution Channel 2025 & 2033
- Figure 78: Middle East and Africa Tea Market Volume Share (%), by Distribution Channel 2025 & 2033
- Figure 79: Middle East and Africa Tea Market Revenue (billion), by Country 2025 & 2033
- Figure 80: Middle East and Africa Tea Market Volume (K Tons), by Country 2025 & 2033
- Figure 81: Middle East and Africa Tea Market Revenue Share (%), by Country 2025 & 2033
- Figure 82: Middle East and Africa Tea Market Volume Share (%), by Country 2025 & 2033
List of Tables
- Table 1: Global Tea Market Revenue billion Forecast, by Form 2020 & 2033
- Table 2: Global Tea Market Volume K Tons Forecast, by Form 2020 & 2033
- Table 3: Global Tea Market Revenue billion Forecast, by Product Type 2020 & 2033
- Table 4: Global Tea Market Volume K Tons Forecast, by Product Type 2020 & 2033
- Table 5: Global Tea Market Revenue billion Forecast, by Distribution Channel 2020 & 2033
- Table 6: Global Tea Market Volume K Tons Forecast, by Distribution Channel 2020 & 2033
- Table 7: Global Tea Market Revenue billion Forecast, by Region 2020 & 2033
- Table 8: Global Tea Market Volume K Tons Forecast, by Region 2020 & 2033
- Table 9: Global Tea Market Revenue billion Forecast, by Form 2020 & 2033
- Table 10: Global Tea Market Volume K Tons Forecast, by Form 2020 & 2033
- Table 11: Global Tea Market Revenue billion Forecast, by Product Type 2020 & 2033
- Table 12: Global Tea Market Volume K Tons Forecast, by Product Type 2020 & 2033
- Table 13: Global Tea Market Revenue billion Forecast, by Distribution Channel 2020 & 2033
- Table 14: Global Tea Market Volume K Tons Forecast, by Distribution Channel 2020 & 2033
- Table 15: Global Tea Market Revenue billion Forecast, by Country 2020 & 2033
- Table 16: Global Tea Market Volume K Tons Forecast, by Country 2020 & 2033
- Table 17: United States Tea Market Revenue (billion) Forecast, by Application 2020 & 2033
- Table 18: United States Tea Market Volume (K Tons) Forecast, by Application 2020 & 2033
- Table 19: Canada Tea Market Revenue (billion) Forecast, by Application 2020 & 2033
- Table 20: Canada Tea Market Volume (K Tons) Forecast, by Application 2020 & 2033
- Table 21: Mexico Tea Market Revenue (billion) Forecast, by Application 2020 & 2033
- Table 22: Mexico Tea Market Volume (K Tons) Forecast, by Application 2020 & 2033
- Table 23: Rest of North America Tea Market Revenue (billion) Forecast, by Application 2020 & 2033
- Table 24: Rest of North America Tea Market Volume (K Tons) Forecast, by Application 2020 & 2033
- Table 25: Global Tea Market Revenue billion Forecast, by Form 2020 & 2033
- Table 26: Global Tea Market Volume K Tons Forecast, by Form 2020 & 2033
- Table 27: Global Tea Market Revenue billion Forecast, by Product Type 2020 & 2033
- Table 28: Global Tea Market Volume K Tons Forecast, by Product Type 2020 & 2033
- Table 29: Global Tea Market Revenue billion Forecast, by Distribution Channel 2020 & 2033
- Table 30: Global Tea Market Volume K Tons Forecast, by Distribution Channel 2020 & 2033
- Table 31: Global Tea Market Revenue billion Forecast, by Country 2020 & 2033
- Table 32: Global Tea Market Volume K Tons Forecast, by Country 2020 & 2033
- Table 33: United Kingdom Tea Market Revenue (billion) Forecast, by Application 2020 & 2033
- Table 34: United Kingdom Tea Market Volume (K Tons) Forecast, by Application 2020 & 2033
- Table 35: Germany Tea Market Revenue (billion) Forecast, by Application 2020 & 2033
- Table 36: Germany Tea Market Volume (K Tons) Forecast, by Application 2020 & 2033
- Table 37: France Tea Market Revenue (billion) Forecast, by Application 2020 & 2033
- Table 38: France Tea Market Volume (K Tons) Forecast, by Application 2020 & 2033
- Table 39: Spain Tea Market Revenue (billion) Forecast, by Application 2020 & 2033
- Table 40: Spain Tea Market Volume (K Tons) Forecast, by Application 2020 & 2033
- Table 41: Italy Tea Market Revenue (billion) Forecast, by Application 2020 & 2033
- Table 42: Italy Tea Market Volume (K Tons) Forecast, by Application 2020 & 2033
- Table 43: Russia Tea Market Revenue (billion) Forecast, by Application 2020 & 2033
- Table 44: Russia Tea Market Volume (K Tons) Forecast, by Application 2020 & 2033
- Table 45: Rest of Europe Tea Market Revenue (billion) Forecast, by Application 2020 & 2033
- Table 46: Rest of Europe Tea Market Volume (K Tons) Forecast, by Application 2020 & 2033
- Table 47: Global Tea Market Revenue billion Forecast, by Form 2020 & 2033
- Table 48: Global Tea Market Volume K Tons Forecast, by Form 2020 & 2033
- Table 49: Global Tea Market Revenue billion Forecast, by Product Type 2020 & 2033
- Table 50: Global Tea Market Volume K Tons Forecast, by Product Type 2020 & 2033
- Table 51: Global Tea Market Revenue billion Forecast, by Distribution Channel 2020 & 2033
- Table 52: Global Tea Market Volume K Tons Forecast, by Distribution Channel 2020 & 2033
- Table 53: Global Tea Market Revenue billion Forecast, by Country 2020 & 2033
- Table 54: Global Tea Market Volume K Tons Forecast, by Country 2020 & 2033
- Table 55: China Tea Market Revenue (billion) Forecast, by Application 2020 & 2033
- Table 56: China Tea Market Volume (K Tons) Forecast, by Application 2020 & 2033
- Table 57: Japan Tea Market Revenue (billion) Forecast, by Application 2020 & 2033
- Table 58: Japan Tea Market Volume (K Tons) Forecast, by Application 2020 & 2033
- Table 59: India Tea Market Revenue (billion) Forecast, by Application 2020 & 2033
- Table 60: India Tea Market Volume (K Tons) Forecast, by Application 2020 & 2033
- Table 61: Australia Tea Market Revenue (billion) Forecast, by Application 2020 & 2033
- Table 62: Australia Tea Market Volume (K Tons) Forecast, by Application 2020 & 2033
- Table 63: Rest of Asia Pacific Tea Market Revenue (billion) Forecast, by Application 2020 & 2033
- Table 64: Rest of Asia Pacific Tea Market Volume (K Tons) Forecast, by Application 2020 & 2033
- Table 65: Global Tea Market Revenue billion Forecast, by Form 2020 & 2033
- Table 66: Global Tea Market Volume K Tons Forecast, by Form 2020 & 2033
- Table 67: Global Tea Market Revenue billion Forecast, by Product Type 2020 & 2033
- Table 68: Global Tea Market Volume K Tons Forecast, by Product Type 2020 & 2033
- Table 69: Global Tea Market Revenue billion Forecast, by Distribution Channel 2020 & 2033
- Table 70: Global Tea Market Volume K Tons Forecast, by Distribution Channel 2020 & 2033
- Table 71: Global Tea Market Revenue billion Forecast, by Country 2020 & 2033
- Table 72: Global Tea Market Volume K Tons Forecast, by Country 2020 & 2033
- Table 73: Brazil Tea Market Revenue (billion) Forecast, by Application 2020 & 2033
- Table 74: Brazil Tea Market Volume (K Tons) Forecast, by Application 2020 & 2033
- Table 75: Argentina Tea Market Revenue (billion) Forecast, by Application 2020 & 2033
- Table 76: Argentina Tea Market Volume (K Tons) Forecast, by Application 2020 & 2033
- Table 77: Rest of South America Tea Market Revenue (billion) Forecast, by Application 2020 & 2033
- Table 78: Rest of South America Tea Market Volume (K Tons) Forecast, by Application 2020 & 2033
- Table 79: Global Tea Market Revenue billion Forecast, by Form 2020 & 2033
- Table 80: Global Tea Market Volume K Tons Forecast, by Form 2020 & 2033
- Table 81: Global Tea Market Revenue billion Forecast, by Product Type 2020 & 2033
- Table 82: Global Tea Market Volume K Tons Forecast, by Product Type 2020 & 2033
- Table 83: Global Tea Market Revenue billion Forecast, by Distribution Channel 2020 & 2033
- Table 84: Global Tea Market Volume K Tons Forecast, by Distribution Channel 2020 & 2033
- Table 85: Global Tea Market Revenue billion Forecast, by Country 2020 & 2033
- Table 86: Global Tea Market Volume K Tons Forecast, by Country 2020 & 2033
- Table 87: South Africa Tea Market Revenue (billion) Forecast, by Application 2020 & 2033
- Table 88: South Africa Tea Market Volume (K Tons) Forecast, by Application 2020 & 2033
- Table 89: United Arab Emirates Tea Market Revenue (billion) Forecast, by Application 2020 & 2033
- Table 90: United Arab Emirates Tea Market Volume (K Tons) Forecast, by Application 2020 & 2033
- Table 91: Rest of Middle East and Africa Tea Market Revenue (billion) Forecast, by Application 2020 & 2033
- Table 92: Rest of Middle East and Africa Tea Market Volume (K Tons) Forecast, by Application 2020 & 2033
Frequently Asked Questions
1. What is the projected Compound Annual Growth Rate (CAGR) of the Tea Market?
The projected CAGR is approximately 3.7%.
2. Which companies are prominent players in the Tea Market?
Key companies in the market include Reily Foods Company (Luzianne), Ekaterra Company (Lipton Tea Red Label PG Tips TAZO Pukka Herbs and T2), RC Bigelow Inc (Bigelow Tea), Apeejay Surrendra Group (Apeejay Tea and Typhoo India Tea), Dabur India Limited (Dabur Tea), Yogi Tea (Yogi Tea), Bettys & Taylors of Harrogate Limited (Taylors of Harrogate Bettys and Yorkshire Tea), Associated British Foods PLC (Twinings), Clipper Tea Company (Clipper Tea), Hain Celestial Group (Celestial Seasonings), Tata Group (Tata Tea Tetley Good Earth Teapigs Vitax and Joekels).
3. What are the main segments of the Tea Market?
The market segments include Form, Product Type, Distribution Channel.
4. Can you provide details about the market size?
The market size is estimated to be USD 1.54 billion as of 2022.
5. What are some drivers contributing to market growth?
Increasing Demand for Herbal Teas; Increasing Consumer Awareness about Health Benefits of Tea.
6. What are the notable trends driving market growth?
Health Benefits of Tea is Propelling the Market Growth.
7. Are there any restraints impacting market growth?
High Cost of Production of Green Tea.
8. Can you provide examples of recent developments in the market?
November 2022: Dabur India Limited launched Dabur Vedic Tea, a premium black tea that contains 30+ ayurvedic herbs that provide health benefits and boosts immunity. The product contains herbs like Tulsi, Ginger, Cardamom, and others.
9. What pricing options are available for accessing the report?
Pricing options include single-user, multi-user, and enterprise licenses priced at USD 4750, USD 5250, and USD 8750 respectively.
10. Is the market size provided in terms of value or volume?
The market size is provided in terms of value, measured in billion and volume, measured in K Tons.
11. Are there any specific market keywords associated with the report?
Yes, the market keyword associated with the report is "Tea Market," which aids in identifying and referencing the specific market segment covered.
12. How do I determine which pricing option suits my needs best?
The pricing options vary based on user requirements and access needs. Individual users may opt for single-user licenses, while businesses requiring broader access may choose multi-user or enterprise licenses for cost-effective access to the report.
13. Are there any additional resources or data provided in the Tea Market report?
While the report offers comprehensive insights, it's advisable to review the specific contents or supplementary materials provided to ascertain if additional resources or data are available.
14. How can I stay updated on further developments or reports in the Tea Market?
To stay informed about further developments, trends, and reports in the Tea Market, consider subscribing to industry newsletters, following relevant companies and organizations, or regularly checking reputable industry news sources and publications.
Methodology
Step 1 - Identification of Relevant Samples Size from Population Database


Step 2 - Approaches for Defining Global Market Size (Value, Volume* & Price*)

Note*: In applicable scenarios
Step 3 - Data Sources
Primary Research
- Web Analytics
- Survey Reports
- Research Institute
- Latest Research Reports
- Opinion Leaders
Secondary Research
- Annual Reports
- White Paper
- Latest Press Release
- Industry Association
- Paid Database
- Investor Presentations

Step 4 - Data Triangulation
Involves using different sources of information in order to increase the validity of a study
These sources are likely to be stakeholders in a program - participants, other researchers, program staff, other community members, and so on.
Then we put all data in single framework & apply various statistical tools to find out the dynamic on the market.
During the analysis stage, feedback from the stakeholder groups would be compared to determine areas of agreement as well as areas of divergence