

Key Insights
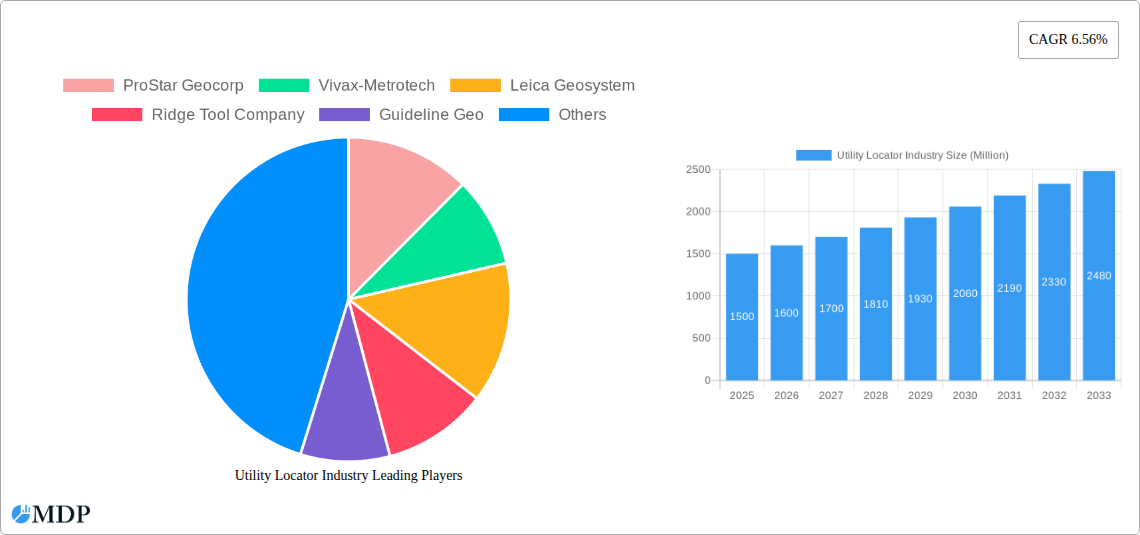
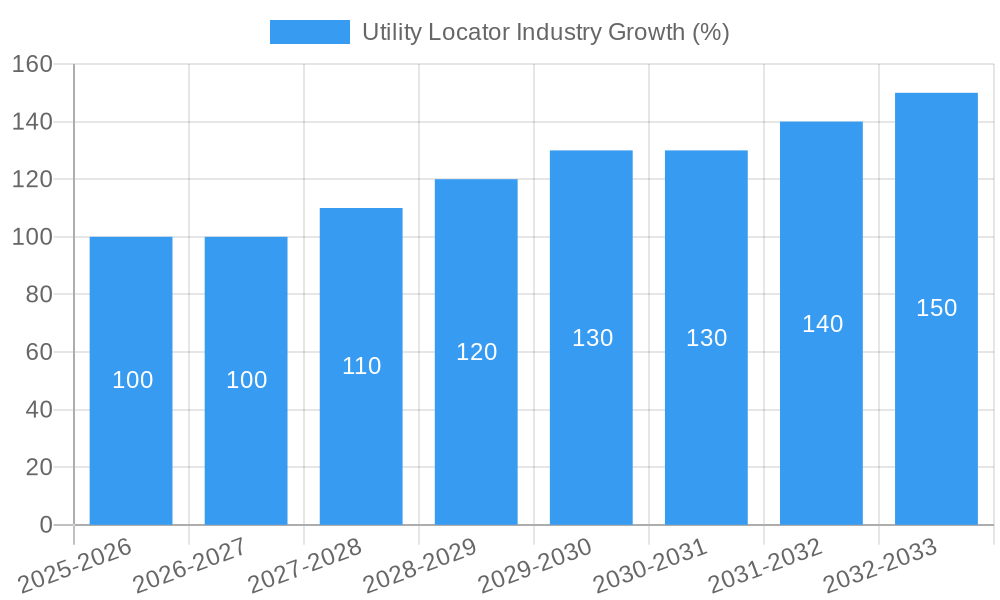
The utility locator industry, valued at approximately $XX million in 2025, is experiencing robust growth, projected at a CAGR of 6.56% from 2025 to 2033. This expansion is driven by several key factors. Increasing urbanization and infrastructure development necessitate precise and efficient utility location to prevent costly damages during excavation projects. Stringent safety regulations and rising awareness of the risks associated with accidental damage to underground utilities are further boosting demand for sophisticated location technologies. The growing adoption of non-destructive techniques, such as electromagnetic field and ground penetrating radar, minimizes disruption and improves accuracy, contributing significantly to market growth. Furthermore, the industry is witnessing a shift towards advanced technologies, including GPS integration and data analytics, enhancing the efficiency and reliability of utility mapping and location services. Segment-wise, the metallic utilities segment likely holds a larger market share due to the greater risk of damage associated with metallic pipelines and cables. Within applications, oil & gas and electricity sectors are major contributors, followed by transportation and water & sewage infrastructure. The equipment segment, comprising advanced sensors and locators, dominates the offering segment, although the services segment (including utility mapping and training) is experiencing considerable growth as businesses increasingly outsource specialized location services. Competitive intensity is moderate, with established players like Leica Geosystems, Vivax-Metrotech, and others coexisting with smaller specialized firms and emerging technology providers. The Asia-Pacific region is anticipated to showcase significant growth potential due to rapid infrastructure development and increasing investments in utility projects.
Despite the positive outlook, the industry faces certain challenges. High initial investment costs associated with acquiring advanced equipment can be a barrier for smaller companies. The accuracy of utility location techniques can be influenced by environmental factors and the complexity of underground infrastructure. Moreover, the need for skilled technicians and ongoing training presents a hurdle for consistent operational efficiency. Nevertheless, the long-term outlook remains positive, propelled by ongoing infrastructure projects globally, stringent safety standards, and the ongoing development of more accurate and efficient utility location technologies. The market is expected to see continued consolidation, with larger companies acquiring smaller firms to expand their service offerings and geographical reach. This will drive further innovation and efficiency improvements within the industry.
Utility Locator Industry Market Report: 2019-2033
This comprehensive report provides an in-depth analysis of the Utility Locator Industry, offering invaluable insights for stakeholders, investors, and industry professionals. With a detailed forecast spanning from 2019 to 2033 (Base Year: 2025, Forecast Period: 2025-2033), this report meticulously examines market dynamics, trends, leading players, and emerging opportunities. The study covers a market valued at $XX Million in 2025, projected to reach $XX Million by 2033, exhibiting a CAGR of XX%.
Utility Locator Industry Market Dynamics & Concentration
The Utility Locator industry is characterized by a moderately consolidated market structure, with a handful of major players holding significant market share. The market is driven by increasing infrastructure development globally, stringent safety regulations aimed at preventing damage to underground utilities, and the growing adoption of advanced technologies like GPR and electromagnetic field techniques. Regulatory frameworks vary across regions, influencing market dynamics and technological adoption. Product substitution is limited, given the specialized nature of utility location equipment and services. End-user trends are shifting towards increased demand for precise and efficient location services, driving innovation in data analytics and software solutions. The industry has witnessed notable M&A activity in recent years, with approximately XX M&A deals recorded between 2019 and 2024, further consolidating the market. Key players are focusing on strategic acquisitions to expand their product portfolios and geographic reach.
- Market Share: Top 5 players hold approximately XX% of the global market share in 2025.
- M&A Activity: An average of XX M&A deals per year were observed during the historical period (2019-2024).
- Innovation Drivers: Technological advancements, stringent safety regulations, and increasing demand for precise location services.
- Regulatory Frameworks: Vary across regions, impacting market access and technology adoption.
Utility Locator Industry Industry Trends & Analysis
The Utility Locator industry is experiencing robust growth, fueled by several key trends. The increasing urbanization and infrastructure development worldwide are driving the demand for efficient and accurate utility location services. Technological advancements, such as the integration of GPS, GIS, and advanced sensor technologies, are enhancing the precision and efficiency of utility location techniques. The rising adoption of non-metallic utilities (e.g., fiber optics) is creating new opportunities for specialized location technologies. Consumer preferences are shifting towards faster, more reliable, and data-driven solutions. Competitive dynamics are marked by innovation, strategic partnerships, and increasing penetration of advanced technologies. The market exhibits a strong competitive landscape with companies focusing on product differentiation and service excellence. The market growth is estimated at a CAGR of XX% during the forecast period (2025-2033), with significant market penetration in developed and developing economies.
Leading Markets & Segments in Utility Locator Industry
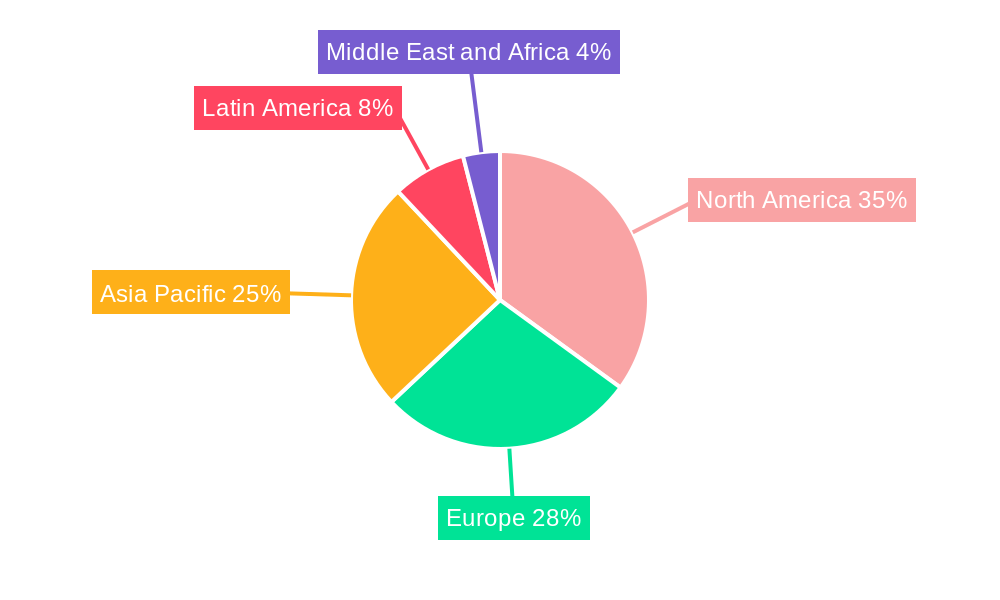
The Utility Locator industry demonstrates strong growth across various segments and regions. The electricity sector represents the largest application segment, driven by extensive power grid infrastructure and maintenance needs. The North American and European markets dominate, followed by rapidly expanding Asia-Pacific region.
Key Drivers:
- By Target: Metallic utilities maintain a larger market share due to the prevalence of metal pipes and cables. However, Non-Metallic utilities are exhibiting faster growth due to increased deployment of fiber optic cables and plastic pipelines.
- By Technique: Electromagnetic field techniques continue to dominate due to cost-effectiveness and wide applicability, while ground penetrating radar (GPR) is gaining traction for its high-resolution capabilities.
- By Application: Electricity, Oil & Gas, and Telecommunications are leading application segments, driven by expanding infrastructure and maintenance requirements.
- By Offering: Services represent a significant segment, driven by the increasing demand for professional utility location services. Equipment sales are also strong, with a significant market for advanced detection technologies.
Dominance Analysis:
North America and Europe currently hold the largest market share due to established infrastructure, stringent safety regulations, and high adoption of advanced technologies. However, the Asia-Pacific region is exhibiting the fastest growth rate driven by rapid urbanization, infrastructure development, and increasing investments in utility networks.
Utility Locator Industry Product Developments
Recent product innovations focus on improving accuracy, efficiency, and data integration. New equipment incorporates advanced sensors, improved processing algorithms, and enhanced data visualization capabilities. Software solutions integrate seamlessly with GIS systems, offering data-driven insights for utility management. This improves workflow efficiency and minimizes risks, offering a strong competitive advantage in the market. The trend is toward more user-friendly interfaces and robust data analysis tools.
Key Drivers of Utility Locator Industry Growth
Several key factors propel the growth of the utility locator industry:
- Technological Advancements: The development of advanced sensors, sophisticated algorithms, and improved data processing techniques.
- Stringent Safety Regulations: Governments worldwide are implementing stricter safety regulations to prevent damage to underground utilities.
- Infrastructure Development: The ongoing expansion of utility networks globally, particularly in developing economies.
Challenges in the Utility Locator Industry Market
The utility locator industry faces certain challenges including:
- Regulatory Hurdles: Varying regulatory landscapes across different regions can create complexities and barriers to market entry.
- Supply Chain Issues: Disruptions in the global supply chain can impact the availability of raw materials and components.
- Competitive Pressures: The market is characterized by intense competition among established players and emerging entrants. This leads to pricing pressure and the need for continuous innovation.
Emerging Opportunities in Utility Locator Industry
The utility locator industry presents several exciting long-term opportunities:
The integration of artificial intelligence (AI) and machine learning (ML) in utility location systems promises increased automation, precision, and efficiency. Strategic partnerships between technology providers and utility companies can foster innovation and market expansion. Expanding into new markets, particularly in developing countries with rapidly growing infrastructure, presents significant growth potential.
Leading Players in the Utility Locator Industry Sector
- ProStar Geocorp
- Vivax-Metrotech
- Leica Geosystems
- Ridge Tool Company
- Guideline Geo
- Irth Solutions
- Sensors & Software Inc
- Subsite Electronics (Charles Machine Works)
- Emerson Electric
- Geophysical Survey Systems Inc
- Radiodetection Ltd
- Honeywell International Inc
- List Not Exhaustive
Key Milestones in Utility Locator Industry Industry
- September 2022: 2M partnered with Prostar Holdings Inc. to adopt Prostar's PointMan mobile application solution, enhancing utility mapping operations and providing value-added services.
- July 2022: Honeywell expanded its smart energy offerings, introducing underground utility locating and data-capturing services with GNSS data, enabling the creation of precise digital maps for efficient utility line location.
- February 2022: Irth Solutions collaborated with Lightbox, increasing location awareness and accuracy while reducing ticket management costs for the underground utility industry through the UtiliSphere platform.
Strategic Outlook for Utility Locator Industry Market
The Utility Locator industry is poised for continued growth, driven by technological advancements, increasing infrastructure development, and stringent safety regulations. Strategic opportunities lie in developing innovative solutions integrating AI, expanding into emerging markets, and forging strategic partnerships. The focus on data analytics and improved data integration will be critical in enhancing efficiency and minimizing risks. The market is expected to experience significant growth in the coming years, presenting attractive prospects for companies with a strong focus on innovation and market adaptation.
Utility Locator Industry Segmentation
-
1. Offering
- 1.1. Equipment
- 1.2. Services
-
2. Target
- 2.1. Metallic Utilities
- 2.2. Non-Metallic Utilities
-
3. Technique
- 3.1. Electromagnetic Field
- 3.2. Ground Penetrating Radar
- 3.3. Other Techniques
-
4. Application
- 4.1. Oil & Gas
- 4.2. Electricity
- 4.3. Transportation
- 4.4. Water and Sewage
- 4.5. Telecommunications
- 4.6. Other Applications
Utility Locator Industry Segmentation By Geography
- 1. North America
- 2. Europe
- 3. Asia
- 4. Australia and New Zealand
- 5. Latin America
- 6. Middle East and Africa
Utility Locator Industry REPORT HIGHLIGHTS
| Aspects | Details |
|---|---|
| Study Period | 2019-2033 |
| Base Year | 2024 |
| Estimated Year | 2025 |
| Forecast Period | 2025-2033 |
| Historical Period | 2019-2024 |
| Growth Rate | CAGR of 6.56% from 2019-2033 |
| Segmentation |
|
Table of Contents
- 1. Introduction
- 1.1. Research Scope
- 1.2. Market Segmentation
- 1.3. Research Methodology
- 1.4. Definitions and Assumptions
- 2. Executive Summary
- 2.1. Introduction
- 3. Market Dynamics
- 3.1. Introduction
- 3.2. Market Drivers
- 3.2.1. Rising Demand for Real-Time Detection Tools for Underground Utilities; Increase Investment for Inspection of Deteriorating Infrastructure
- 3.3. Market Restrains
- 3.3.1. Combining Data from Multiple Data Sources
- 3.4. Market Trends
- 3.4.1. Transportation Sector to Hold Significant Market Share
- 4. Market Factor Analysis
- 4.1. Porters Five Forces
- 4.2. Supply/Value Chain
- 4.3. PESTEL analysis
- 4.4. Market Entropy
- 4.5. Patent/Trademark Analysis
- 5. Global Utility Locator Industry Analysis, Insights and Forecast, 2019-2031
- 5.1. Market Analysis, Insights and Forecast - by Offering
- 5.1.1. Equipment
- 5.1.2. Services
- 5.2. Market Analysis, Insights and Forecast - by Target
- 5.2.1. Metallic Utilities
- 5.2.2. Non-Metallic Utilities
- 5.3. Market Analysis, Insights and Forecast - by Technique
- 5.3.1. Electromagnetic Field
- 5.3.2. Ground Penetrating Radar
- 5.3.3. Other Techniques
- 5.4. Market Analysis, Insights and Forecast - by Application
- 5.4.1. Oil & Gas
- 5.4.2. Electricity
- 5.4.3. Transportation
- 5.4.4. Water and Sewage
- 5.4.5. Telecommunications
- 5.4.6. Other Applications
- 5.5. Market Analysis, Insights and Forecast - by Region
- 5.5.1. North America
- 5.5.2. Europe
- 5.5.3. Asia
- 5.5.4. Australia and New Zealand
- 5.5.5. Latin America
- 5.5.6. Middle East and Africa
- 5.1. Market Analysis, Insights and Forecast - by Offering
- 6. North America Utility Locator Industry Analysis, Insights and Forecast, 2019-2031
- 6.1. Market Analysis, Insights and Forecast - by Offering
- 6.1.1. Equipment
- 6.1.2. Services
- 6.2. Market Analysis, Insights and Forecast - by Target
- 6.2.1. Metallic Utilities
- 6.2.2. Non-Metallic Utilities
- 6.3. Market Analysis, Insights and Forecast - by Technique
- 6.3.1. Electromagnetic Field
- 6.3.2. Ground Penetrating Radar
- 6.3.3. Other Techniques
- 6.4. Market Analysis, Insights and Forecast - by Application
- 6.4.1. Oil & Gas
- 6.4.2. Electricity
- 6.4.3. Transportation
- 6.4.4. Water and Sewage
- 6.4.5. Telecommunications
- 6.4.6. Other Applications
- 6.1. Market Analysis, Insights and Forecast - by Offering
- 7. Europe Utility Locator Industry Analysis, Insights and Forecast, 2019-2031
- 7.1. Market Analysis, Insights and Forecast - by Offering
- 7.1.1. Equipment
- 7.1.2. Services
- 7.2. Market Analysis, Insights and Forecast - by Target
- 7.2.1. Metallic Utilities
- 7.2.2. Non-Metallic Utilities
- 7.3. Market Analysis, Insights and Forecast - by Technique
- 7.3.1. Electromagnetic Field
- 7.3.2. Ground Penetrating Radar
- 7.3.3. Other Techniques
- 7.4. Market Analysis, Insights and Forecast - by Application
- 7.4.1. Oil & Gas
- 7.4.2. Electricity
- 7.4.3. Transportation
- 7.4.4. Water and Sewage
- 7.4.5. Telecommunications
- 7.4.6. Other Applications
- 7.1. Market Analysis, Insights and Forecast - by Offering
- 8. Asia Utility Locator Industry Analysis, Insights and Forecast, 2019-2031
- 8.1. Market Analysis, Insights and Forecast - by Offering
- 8.1.1. Equipment
- 8.1.2. Services
- 8.2. Market Analysis, Insights and Forecast - by Target
- 8.2.1. Metallic Utilities
- 8.2.2. Non-Metallic Utilities
- 8.3. Market Analysis, Insights and Forecast - by Technique
- 8.3.1. Electromagnetic Field
- 8.3.2. Ground Penetrating Radar
- 8.3.3. Other Techniques
- 8.4. Market Analysis, Insights and Forecast - by Application
- 8.4.1. Oil & Gas
- 8.4.2. Electricity
- 8.4.3. Transportation
- 8.4.4. Water and Sewage
- 8.4.5. Telecommunications
- 8.4.6. Other Applications
- 8.1. Market Analysis, Insights and Forecast - by Offering
- 9. Australia and New Zealand Utility Locator Industry Analysis, Insights and Forecast, 2019-2031
- 9.1. Market Analysis, Insights and Forecast - by Offering
- 9.1.1. Equipment
- 9.1.2. Services
- 9.2. Market Analysis, Insights and Forecast - by Target
- 9.2.1. Metallic Utilities
- 9.2.2. Non-Metallic Utilities
- 9.3. Market Analysis, Insights and Forecast - by Technique
- 9.3.1. Electromagnetic Field
- 9.3.2. Ground Penetrating Radar
- 9.3.3. Other Techniques
- 9.4. Market Analysis, Insights and Forecast - by Application
- 9.4.1. Oil & Gas
- 9.4.2. Electricity
- 9.4.3. Transportation
- 9.4.4. Water and Sewage
- 9.4.5. Telecommunications
- 9.4.6. Other Applications
- 9.1. Market Analysis, Insights and Forecast - by Offering
- 10. Latin America Utility Locator Industry Analysis, Insights and Forecast, 2019-2031
- 10.1. Market Analysis, Insights and Forecast - by Offering
- 10.1.1. Equipment
- 10.1.2. Services
- 10.2. Market Analysis, Insights and Forecast - by Target
- 10.2.1. Metallic Utilities
- 10.2.2. Non-Metallic Utilities
- 10.3. Market Analysis, Insights and Forecast - by Technique
- 10.3.1. Electromagnetic Field
- 10.3.2. Ground Penetrating Radar
- 10.3.3. Other Techniques
- 10.4. Market Analysis, Insights and Forecast - by Application
- 10.4.1. Oil & Gas
- 10.4.2. Electricity
- 10.4.3. Transportation
- 10.4.4. Water and Sewage
- 10.4.5. Telecommunications
- 10.4.6. Other Applications
- 10.1. Market Analysis, Insights and Forecast - by Offering
- 11. Middle East and Africa Utility Locator Industry Analysis, Insights and Forecast, 2019-2031
- 11.1. Market Analysis, Insights and Forecast - by Offering
- 11.1.1. Equipment
- 11.1.2. Services
- 11.2. Market Analysis, Insights and Forecast - by Target
- 11.2.1. Metallic Utilities
- 11.2.2. Non-Metallic Utilities
- 11.3. Market Analysis, Insights and Forecast - by Technique
- 11.3.1. Electromagnetic Field
- 11.3.2. Ground Penetrating Radar
- 11.3.3. Other Techniques
- 11.4. Market Analysis, Insights and Forecast - by Application
- 11.4.1. Oil & Gas
- 11.4.2. Electricity
- 11.4.3. Transportation
- 11.4.4. Water and Sewage
- 11.4.5. Telecommunications
- 11.4.6. Other Applications
- 11.1. Market Analysis, Insights and Forecast - by Offering
- 12. North America Utility Locator Industry Analysis, Insights and Forecast, 2019-2031
- 12.1. Market Analysis, Insights and Forecast - By Country/Sub-region
- 12.1.1.
- 13. Europe Utility Locator Industry Analysis, Insights and Forecast, 2019-2031
- 13.1. Market Analysis, Insights and Forecast - By Country/Sub-region
- 13.1.1.
- 14. Asia Pacific Utility Locator Industry Analysis, Insights and Forecast, 2019-2031
- 14.1. Market Analysis, Insights and Forecast - By Country/Sub-region
- 14.1.1.
- 15. Latin America Utility Locator Industry Analysis, Insights and Forecast, 2019-2031
- 15.1. Market Analysis, Insights and Forecast - By Country/Sub-region
- 15.1.1.
- 16. Middle East and Africa Utility Locator Industry Analysis, Insights and Forecast, 2019-2031
- 16.1. Market Analysis, Insights and Forecast - By Country/Sub-region
- 16.1.1.
- 17. Competitive Analysis
- 17.1. Global Market Share Analysis 2024
- 17.2. Company Profiles
- 17.2.1 ProStar Geocorp
- 17.2.1.1. Overview
- 17.2.1.2. Products
- 17.2.1.3. SWOT Analysis
- 17.2.1.4. Recent Developments
- 17.2.1.5. Financials (Based on Availability)
- 17.2.2 Vivax-Metrotech
- 17.2.2.1. Overview
- 17.2.2.2. Products
- 17.2.2.3. SWOT Analysis
- 17.2.2.4. Recent Developments
- 17.2.2.5. Financials (Based on Availability)
- 17.2.3 Leica Geosystem
- 17.2.3.1. Overview
- 17.2.3.2. Products
- 17.2.3.3. SWOT Analysis
- 17.2.3.4. Recent Developments
- 17.2.3.5. Financials (Based on Availability)
- 17.2.4 Ridge Tool Company
- 17.2.4.1. Overview
- 17.2.4.2. Products
- 17.2.4.3. SWOT Analysis
- 17.2.4.4. Recent Developments
- 17.2.4.5. Financials (Based on Availability)
- 17.2.5 Guideline Geo
- 17.2.5.1. Overview
- 17.2.5.2. Products
- 17.2.5.3. SWOT Analysis
- 17.2.5.4. Recent Developments
- 17.2.5.5. Financials (Based on Availability)
- 17.2.6 Irth Solutions
- 17.2.6.1. Overview
- 17.2.6.2. Products
- 17.2.6.3. SWOT Analysis
- 17.2.6.4. Recent Developments
- 17.2.6.5. Financials (Based on Availability)
- 17.2.7 Sensors & Software Inc
- 17.2.7.1. Overview
- 17.2.7.2. Products
- 17.2.7.3. SWOT Analysis
- 17.2.7.4. Recent Developments
- 17.2.7.5. Financials (Based on Availability)
- 17.2.8 Subsite Electronics (Charles Machine Works)
- 17.2.8.1. Overview
- 17.2.8.2. Products
- 17.2.8.3. SWOT Analysis
- 17.2.8.4. Recent Developments
- 17.2.8.5. Financials (Based on Availability)
- 17.2.9 Emerson Electric
- 17.2.9.1. Overview
- 17.2.9.2. Products
- 17.2.9.3. SWOT Analysis
- 17.2.9.4. Recent Developments
- 17.2.9.5. Financials (Based on Availability)
- 17.2.10 Geophysical Survey Systems Inc
- 17.2.10.1. Overview
- 17.2.10.2. Products
- 17.2.10.3. SWOT Analysis
- 17.2.10.4. Recent Developments
- 17.2.10.5. Financials (Based on Availability)
- 17.2.11 Radiodetection Ltd
- 17.2.11.1. Overview
- 17.2.11.2. Products
- 17.2.11.3. SWOT Analysis
- 17.2.11.4. Recent Developments
- 17.2.11.5. Financials (Based on Availability)
- 17.2.12 Honeywell International Inc *List Not Exhaustive
- 17.2.12.1. Overview
- 17.2.12.2. Products
- 17.2.12.3. SWOT Analysis
- 17.2.12.4. Recent Developments
- 17.2.12.5. Financials (Based on Availability)
- 17.2.1 ProStar Geocorp
List of Figures
- Figure 1: Global Utility Locator Industry Revenue Breakdown (Million, %) by Region 2024 & 2032
- Figure 2: North America Utility Locator Industry Revenue (Million), by Country 2024 & 2032
- Figure 3: North America Utility Locator Industry Revenue Share (%), by Country 2024 & 2032
- Figure 4: Europe Utility Locator Industry Revenue (Million), by Country 2024 & 2032
- Figure 5: Europe Utility Locator Industry Revenue Share (%), by Country 2024 & 2032
- Figure 6: Asia Pacific Utility Locator Industry Revenue (Million), by Country 2024 & 2032
- Figure 7: Asia Pacific Utility Locator Industry Revenue Share (%), by Country 2024 & 2032
- Figure 8: Latin America Utility Locator Industry Revenue (Million), by Country 2024 & 2032
- Figure 9: Latin America Utility Locator Industry Revenue Share (%), by Country 2024 & 2032
- Figure 10: Middle East and Africa Utility Locator Industry Revenue (Million), by Country 2024 & 2032
- Figure 11: Middle East and Africa Utility Locator Industry Revenue Share (%), by Country 2024 & 2032
- Figure 12: North America Utility Locator Industry Revenue (Million), by Offering 2024 & 2032
- Figure 13: North America Utility Locator Industry Revenue Share (%), by Offering 2024 & 2032
- Figure 14: North America Utility Locator Industry Revenue (Million), by Target 2024 & 2032
- Figure 15: North America Utility Locator Industry Revenue Share (%), by Target 2024 & 2032
- Figure 16: North America Utility Locator Industry Revenue (Million), by Technique 2024 & 2032
- Figure 17: North America Utility Locator Industry Revenue Share (%), by Technique 2024 & 2032
- Figure 18: North America Utility Locator Industry Revenue (Million), by Application 2024 & 2032
- Figure 19: North America Utility Locator Industry Revenue Share (%), by Application 2024 & 2032
- Figure 20: North America Utility Locator Industry Revenue (Million), by Country 2024 & 2032
- Figure 21: North America Utility Locator Industry Revenue Share (%), by Country 2024 & 2032
- Figure 22: Europe Utility Locator Industry Revenue (Million), by Offering 2024 & 2032
- Figure 23: Europe Utility Locator Industry Revenue Share (%), by Offering 2024 & 2032
- Figure 24: Europe Utility Locator Industry Revenue (Million), by Target 2024 & 2032
- Figure 25: Europe Utility Locator Industry Revenue Share (%), by Target 2024 & 2032
- Figure 26: Europe Utility Locator Industry Revenue (Million), by Technique 2024 & 2032
- Figure 27: Europe Utility Locator Industry Revenue Share (%), by Technique 2024 & 2032
- Figure 28: Europe Utility Locator Industry Revenue (Million), by Application 2024 & 2032
- Figure 29: Europe Utility Locator Industry Revenue Share (%), by Application 2024 & 2032
- Figure 30: Europe Utility Locator Industry Revenue (Million), by Country 2024 & 2032
- Figure 31: Europe Utility Locator Industry Revenue Share (%), by Country 2024 & 2032
- Figure 32: Asia Utility Locator Industry Revenue (Million), by Offering 2024 & 2032
- Figure 33: Asia Utility Locator Industry Revenue Share (%), by Offering 2024 & 2032
- Figure 34: Asia Utility Locator Industry Revenue (Million), by Target 2024 & 2032
- Figure 35: Asia Utility Locator Industry Revenue Share (%), by Target 2024 & 2032
- Figure 36: Asia Utility Locator Industry Revenue (Million), by Technique 2024 & 2032
- Figure 37: Asia Utility Locator Industry Revenue Share (%), by Technique 2024 & 2032
- Figure 38: Asia Utility Locator Industry Revenue (Million), by Application 2024 & 2032
- Figure 39: Asia Utility Locator Industry Revenue Share (%), by Application 2024 & 2032
- Figure 40: Asia Utility Locator Industry Revenue (Million), by Country 2024 & 2032
- Figure 41: Asia Utility Locator Industry Revenue Share (%), by Country 2024 & 2032
- Figure 42: Australia and New Zealand Utility Locator Industry Revenue (Million), by Offering 2024 & 2032
- Figure 43: Australia and New Zealand Utility Locator Industry Revenue Share (%), by Offering 2024 & 2032
- Figure 44: Australia and New Zealand Utility Locator Industry Revenue (Million), by Target 2024 & 2032
- Figure 45: Australia and New Zealand Utility Locator Industry Revenue Share (%), by Target 2024 & 2032
- Figure 46: Australia and New Zealand Utility Locator Industry Revenue (Million), by Technique 2024 & 2032
- Figure 47: Australia and New Zealand Utility Locator Industry Revenue Share (%), by Technique 2024 & 2032
- Figure 48: Australia and New Zealand Utility Locator Industry Revenue (Million), by Application 2024 & 2032
- Figure 49: Australia and New Zealand Utility Locator Industry Revenue Share (%), by Application 2024 & 2032
- Figure 50: Australia and New Zealand Utility Locator Industry Revenue (Million), by Country 2024 & 2032
- Figure 51: Australia and New Zealand Utility Locator Industry Revenue Share (%), by Country 2024 & 2032
- Figure 52: Latin America Utility Locator Industry Revenue (Million), by Offering 2024 & 2032
- Figure 53: Latin America Utility Locator Industry Revenue Share (%), by Offering 2024 & 2032
- Figure 54: Latin America Utility Locator Industry Revenue (Million), by Target 2024 & 2032
- Figure 55: Latin America Utility Locator Industry Revenue Share (%), by Target 2024 & 2032
- Figure 56: Latin America Utility Locator Industry Revenue (Million), by Technique 2024 & 2032
- Figure 57: Latin America Utility Locator Industry Revenue Share (%), by Technique 2024 & 2032
- Figure 58: Latin America Utility Locator Industry Revenue (Million), by Application 2024 & 2032
- Figure 59: Latin America Utility Locator Industry Revenue Share (%), by Application 2024 & 2032
- Figure 60: Latin America Utility Locator Industry Revenue (Million), by Country 2024 & 2032
- Figure 61: Latin America Utility Locator Industry Revenue Share (%), by Country 2024 & 2032
- Figure 62: Middle East and Africa Utility Locator Industry Revenue (Million), by Offering 2024 & 2032
- Figure 63: Middle East and Africa Utility Locator Industry Revenue Share (%), by Offering 2024 & 2032
- Figure 64: Middle East and Africa Utility Locator Industry Revenue (Million), by Target 2024 & 2032
- Figure 65: Middle East and Africa Utility Locator Industry Revenue Share (%), by Target 2024 & 2032
- Figure 66: Middle East and Africa Utility Locator Industry Revenue (Million), by Technique 2024 & 2032
- Figure 67: Middle East and Africa Utility Locator Industry Revenue Share (%), by Technique 2024 & 2032
- Figure 68: Middle East and Africa Utility Locator Industry Revenue (Million), by Application 2024 & 2032
- Figure 69: Middle East and Africa Utility Locator Industry Revenue Share (%), by Application 2024 & 2032
- Figure 70: Middle East and Africa Utility Locator Industry Revenue (Million), by Country 2024 & 2032
- Figure 71: Middle East and Africa Utility Locator Industry Revenue Share (%), by Country 2024 & 2032
List of Tables
- Table 1: Global Utility Locator Industry Revenue Million Forecast, by Region 2019 & 2032
- Table 2: Global Utility Locator Industry Revenue Million Forecast, by Offering 2019 & 2032
- Table 3: Global Utility Locator Industry Revenue Million Forecast, by Target 2019 & 2032
- Table 4: Global Utility Locator Industry Revenue Million Forecast, by Technique 2019 & 2032
- Table 5: Global Utility Locator Industry Revenue Million Forecast, by Application 2019 & 2032
- Table 6: Global Utility Locator Industry Revenue Million Forecast, by Region 2019 & 2032
- Table 7: Global Utility Locator Industry Revenue Million Forecast, by Country 2019 & 2032
- Table 8: Utility Locator Industry Revenue (Million) Forecast, by Application 2019 & 2032
- Table 9: Global Utility Locator Industry Revenue Million Forecast, by Country 2019 & 2032
- Table 10: Utility Locator Industry Revenue (Million) Forecast, by Application 2019 & 2032
- Table 11: Global Utility Locator Industry Revenue Million Forecast, by Country 2019 & 2032
- Table 12: Utility Locator Industry Revenue (Million) Forecast, by Application 2019 & 2032
- Table 13: Global Utility Locator Industry Revenue Million Forecast, by Country 2019 & 2032
- Table 14: Utility Locator Industry Revenue (Million) Forecast, by Application 2019 & 2032
- Table 15: Global Utility Locator Industry Revenue Million Forecast, by Country 2019 & 2032
- Table 16: Utility Locator Industry Revenue (Million) Forecast, by Application 2019 & 2032
- Table 17: Global Utility Locator Industry Revenue Million Forecast, by Offering 2019 & 2032
- Table 18: Global Utility Locator Industry Revenue Million Forecast, by Target 2019 & 2032
- Table 19: Global Utility Locator Industry Revenue Million Forecast, by Technique 2019 & 2032
- Table 20: Global Utility Locator Industry Revenue Million Forecast, by Application 2019 & 2032
- Table 21: Global Utility Locator Industry Revenue Million Forecast, by Country 2019 & 2032
- Table 22: Global Utility Locator Industry Revenue Million Forecast, by Offering 2019 & 2032
- Table 23: Global Utility Locator Industry Revenue Million Forecast, by Target 2019 & 2032
- Table 24: Global Utility Locator Industry Revenue Million Forecast, by Technique 2019 & 2032
- Table 25: Global Utility Locator Industry Revenue Million Forecast, by Application 2019 & 2032
- Table 26: Global Utility Locator Industry Revenue Million Forecast, by Country 2019 & 2032
- Table 27: Global Utility Locator Industry Revenue Million Forecast, by Offering 2019 & 2032
- Table 28: Global Utility Locator Industry Revenue Million Forecast, by Target 2019 & 2032
- Table 29: Global Utility Locator Industry Revenue Million Forecast, by Technique 2019 & 2032
- Table 30: Global Utility Locator Industry Revenue Million Forecast, by Application 2019 & 2032
- Table 31: Global Utility Locator Industry Revenue Million Forecast, by Country 2019 & 2032
- Table 32: Global Utility Locator Industry Revenue Million Forecast, by Offering 2019 & 2032
- Table 33: Global Utility Locator Industry Revenue Million Forecast, by Target 2019 & 2032
- Table 34: Global Utility Locator Industry Revenue Million Forecast, by Technique 2019 & 2032
- Table 35: Global Utility Locator Industry Revenue Million Forecast, by Application 2019 & 2032
- Table 36: Global Utility Locator Industry Revenue Million Forecast, by Country 2019 & 2032
- Table 37: Global Utility Locator Industry Revenue Million Forecast, by Offering 2019 & 2032
- Table 38: Global Utility Locator Industry Revenue Million Forecast, by Target 2019 & 2032
- Table 39: Global Utility Locator Industry Revenue Million Forecast, by Technique 2019 & 2032
- Table 40: Global Utility Locator Industry Revenue Million Forecast, by Application 2019 & 2032
- Table 41: Global Utility Locator Industry Revenue Million Forecast, by Country 2019 & 2032
- Table 42: Global Utility Locator Industry Revenue Million Forecast, by Offering 2019 & 2032
- Table 43: Global Utility Locator Industry Revenue Million Forecast, by Target 2019 & 2032
- Table 44: Global Utility Locator Industry Revenue Million Forecast, by Technique 2019 & 2032
- Table 45: Global Utility Locator Industry Revenue Million Forecast, by Application 2019 & 2032
- Table 46: Global Utility Locator Industry Revenue Million Forecast, by Country 2019 & 2032
Frequently Asked Questions
1. What is the projected Compound Annual Growth Rate (CAGR) of the Utility Locator Industry?
The projected CAGR is approximately 6.56%.
2. Which companies are prominent players in the Utility Locator Industry?
Key companies in the market include ProStar Geocorp, Vivax-Metrotech, Leica Geosystem, Ridge Tool Company, Guideline Geo, Irth Solutions, Sensors & Software Inc, Subsite Electronics (Charles Machine Works), Emerson Electric, Geophysical Survey Systems Inc, Radiodetection Ltd, Honeywell International Inc *List Not Exhaustive.
3. What are the main segments of the Utility Locator Industry?
The market segments include Offering, Target, Technique, Application.
4. Can you provide details about the market size?
The market size is estimated to be USD XX Million as of 2022.
5. What are some drivers contributing to market growth?
Rising Demand for Real-Time Detection Tools for Underground Utilities; Increase Investment for Inspection of Deteriorating Infrastructure.
6. What are the notable trends driving market growth?
Transportation Sector to Hold Significant Market Share.
7. Are there any restraints impacting market growth?
Combining Data from Multiple Data Sources.
8. Can you provide examples of recent developments in the market?
September 2022: 2M partnered with Prostar Holdings Inc. to adopt Prostar's PointMan mobile application solution to enhance their utility mapping operations. Realizing lives depended on knowing where utilities are buried, 2M is committed to finding utilities with attention to detail on every project. PointMan proved to be a key differentiator in the market and continues to help companies like 2M provide value-added services to their clients.
9. What pricing options are available for accessing the report?
Pricing options include single-user, multi-user, and enterprise licenses priced at USD 4750, USD 5250, and USD 8750 respectively.
10. Is the market size provided in terms of value or volume?
The market size is provided in terms of value, measured in Million.
11. Are there any specific market keywords associated with the report?
Yes, the market keyword associated with the report is "Utility Locator Industry," which aids in identifying and referencing the specific market segment covered.
12. How do I determine which pricing option suits my needs best?
The pricing options vary based on user requirements and access needs. Individual users may opt for single-user licenses, while businesses requiring broader access may choose multi-user or enterprise licenses for cost-effective access to the report.
13. Are there any additional resources or data provided in the Utility Locator Industry report?
While the report offers comprehensive insights, it's advisable to review the specific contents or supplementary materials provided to ascertain if additional resources or data are available.
14. How can I stay updated on further developments or reports in the Utility Locator Industry?
To stay informed about further developments, trends, and reports in the Utility Locator Industry, consider subscribing to industry newsletters, following relevant companies and organizations, or regularly checking reputable industry news sources and publications.
Methodology
Step 1 - Identification of Relevant Samples Size from Population Database


Step 2 - Approaches for Defining Global Market Size (Value, Volume* & Price*)

Note*: In applicable scenarios
Step 3 - Data Sources
Primary Research
- Web Analytics
- Survey Reports
- Research Institute
- Latest Research Reports
- Opinion Leaders
Secondary Research
- Annual Reports
- White Paper
- Latest Press Release
- Industry Association
- Paid Database
- Investor Presentations

Step 4 - Data Triangulation
Involves using different sources of information in order to increase the validity of a study
These sources are likely to be stakeholders in a program - participants, other researchers, program staff, other community members, and so on.
Then we put all data in single framework & apply various statistical tools to find out the dynamic on the market.
During the analysis stage, feedback from the stakeholder groups would be compared to determine areas of agreement as well as areas of divergence
