

Key Insights
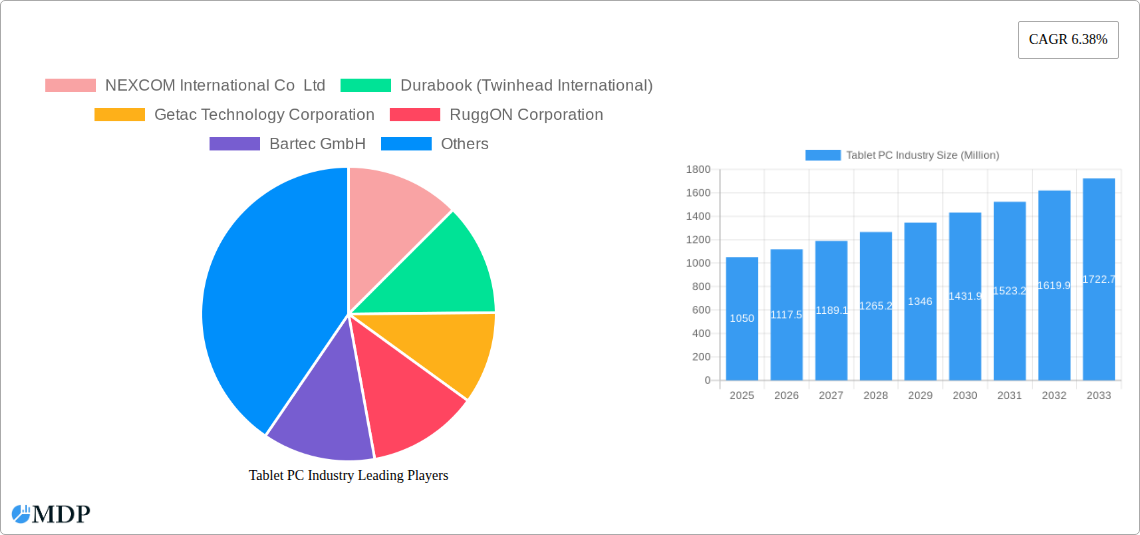
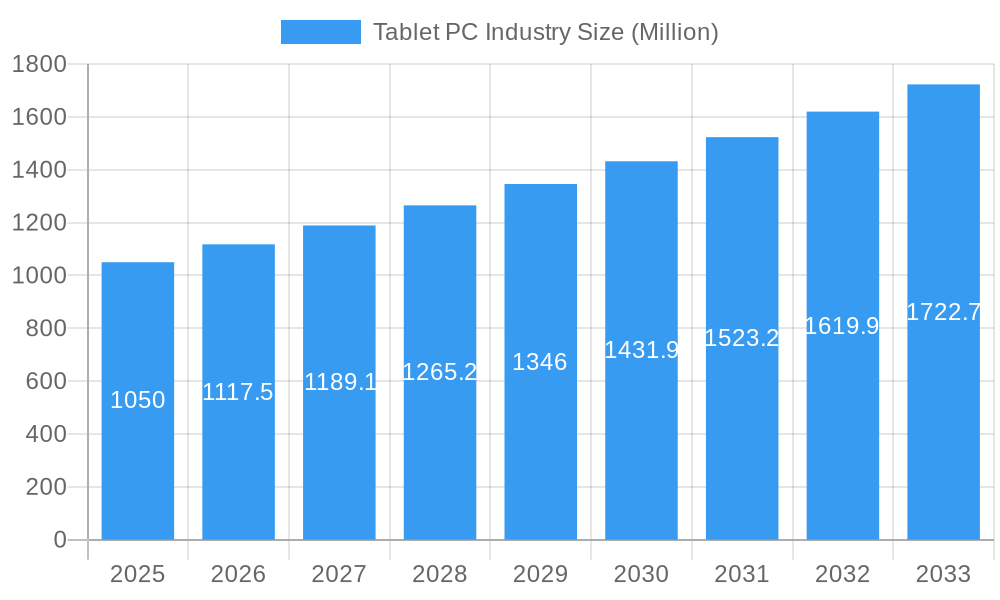
The rugged tablet PC market is poised for robust expansion, projected to reach a substantial valuation driven by a Compound Annual Growth Rate (CAGR) of 6.38%. This impressive growth trajectory highlights the increasing demand for durable computing solutions across a multitude of demanding industries. The market size, estimated at $1.05 billion in the base year of 2025, is expected to see significant value unit growth through the forecast period of 2025-2033. Key drivers fueling this surge include the escalating need for real-time data access and processing in field operations, enhanced worker productivity through mobile computing, and the stringent requirements for devices that can withstand harsh environmental conditions. Industries such as manufacturing, energy and power, oil and gas, transportation and logistics, automotive, and agriculture are at the forefront of adopting these rugged devices, recognizing their superior resilience and reliability compared to standard consumer-grade tablets. The continuous innovation in device durability, battery life, and connectivity further strengthens the market's potential.
Tablet PC Industry Market Size (In Billion)
The rugged tablet PC market segmentation reveals a dynamic landscape with distinct segments catering to varied operational needs. In terms of ruggedness, the Fully Rugged segment is anticipated to capture a significant market share due to its unparalleled ability to withstand extreme temperatures, drops, shocks, and water ingress. The Semi-Rugged and Ultra Rugged segments also contribute to the market's diversity, offering tailored protection levels. Operating system-wise, both Windows and Android platforms will continue to coexist, each serving specific user preferences and application ecosystems. Windows offers robust enterprise-level features and compatibility, while Android provides flexibility and a wide range of app support. Geographically, North America and Europe are expected to remain dominant markets, owing to the early adoption of advanced technologies and strong industrial bases. However, the Asia Pacific region is demonstrating rapid growth, driven by industrialization, infrastructure development, and increasing adoption of IoT solutions. Restraints such as the higher initial cost of rugged devices compared to their consumer counterparts and the ongoing advancements in standard consumer tablet durability are factors the industry will need to navigate. Nevertheless, the inherent advantages of rugged tablets in mission-critical environments are expected to outweigh these challenges, ensuring sustained market expansion.
Tablet PC Industry Company Market Share
Unlocking the Future of Rugged Computing: Tablet PC Industry Market Analysis & Forecast 2019–2033
This comprehensive report delves into the dynamic Tablet PC Industry, providing an in-depth analysis of market trends, growth drivers, and competitive landscapes. Spanning from 2019 to 2033, with a base year of 2025 and a robust forecast period from 2025–2033, this study offers invaluable insights for industry stakeholders, investors, and strategists seeking to capitalize on the evolving demands for rugged tablets and enterprise tablets. Explore critical segments including Fully Rugged Tablets, Semi-Rugged Tablets, and Ultra Rugged Tablets, alongside operating systems like Windows Tablets and Android Tablets, and key end-user industries such as Manufacturing Tablets, Energy and Power Tablets, Oil and Gas Tablets, Transportation and Logistics Tablets, Automotive Tablets, and Agriculture Tablets.
Tablet PC Industry Market Dynamics & Concentration
The Tablet PC Industry is characterized by moderate to high concentration, driven by significant technological innovation and stringent industry standards, particularly within the rugged tablet market. Key innovation drivers include the demand for enhanced durability, extended battery life, powerful processing capabilities, and seamless connectivity for field-based operations. Regulatory frameworks, especially concerning data security and industry-specific certifications for devices used in hazardous environments, play a crucial role in shaping market entry and product development. While direct product substitutes are limited for highly specialized fully rugged tablets, advancements in smartphone technology and traditional laptops present indirect competition in certain use cases. End-user trends are heavily influenced by digital transformation initiatives across sectors like manufacturing, energy, and logistics, pushing the adoption of mobile computing solutions that can withstand harsh conditions. Merger and acquisition (M&A) activities, while not consistently high in deal count, are strategic in nature, often focusing on acquiring specific technological expertise or expanding market reach in niche segments. For instance, the acquisition of a specialized component manufacturer or a company with a strong distribution network in a key vertical can significantly alter market share for leading players. Market share is often segmented by ruggedness levels and industry focus, with specialized vendors dominating the ultra-rugged segment while broader tech giants compete in semi-rugged and industrial-grade offerings.
Tablet PC Industry Industry Trends & Analysis
The Tablet PC Industry is experiencing sustained growth, fueled by the accelerating digital transformation across a multitude of industries and the increasing demand for robust, mobile computing solutions. The projected Compound Annual Growth Rate (CAGR) for the forecast period (2025–2033) is estimated at approximately 7.5%, indicating a healthy expansion of the global market. This growth is predominantly driven by the escalating need for devices capable of withstanding extreme environmental conditions, vibrations, dust, and water ingress, making rugged tablets indispensable in sectors like manufacturing, oil and gas, construction, and emergency services. Technological disruptions are at the forefront of this evolution, with manufacturers continuously integrating more powerful processors, advanced connectivity options (including 5G), longer-lasting battery technologies, and improved display resolutions that are sunlight-readable. The integration of AI and machine learning capabilities into these devices is also a burgeoning trend, enabling predictive maintenance, real-time data analysis, and enhanced worker productivity in the field. Consumer preferences are shifting towards devices that offer a balance of ruggedness and user-friendliness, with an increasing demand for sleeker designs in semi-rugged and industrial-grade tablets without compromising on durability. Competitive dynamics are intensifying, with established players constantly innovating and new entrants emerging to capture specific market niches. For example, the growing adoption of Android in ruggedized form factors is challenging the dominance of Windows in certain enterprise applications. Market penetration is steadily increasing across all end-user industries, as organizations recognize the return on investment from deploying durable and reliable mobile computing devices that minimize downtime and enhance operational efficiency. The continued evolution of device form factors, from traditional slate designs to convertible and detachable models, further broadens the applicability of tablet PCs across diverse work environments.
Leading Markets & Segments in Tablet PC Industry
The Tablet PC Industry is witnessing robust growth across various regions and segments, with North America and Europe currently leading the market due to significant investments in digital transformation and the presence of major industrial sectors. However, the Asia-Pacific region is exhibiting the fastest growth rate, driven by increasing industrialization, infrastructure development, and a burgeoning adoption of mobile technologies in manufacturing and logistics.
Dominant Segments:
Type:
- Fully Rugged Tablets: These devices are paramount in industries demanding extreme durability. Their dominance is fueled by applications in oil and gas exploration, mining, construction, and defense, where operational continuity in harsh environments is non-negotiable. Key drivers include stringent safety regulations and the high cost of equipment failure.
- Semi-Rugged Tablets: Occupying a significant market share, these offer a balance between durability and portability, making them popular in field service, transportation, and warehousing. Economic policies encouraging mobile workforce solutions and the need for reliable data capture in less extreme but still demanding conditions support their growth.
- Ultra Rugged Tablets: While a niche segment, ultra-rugged devices cater to the most extreme conditions, such as deep-sea exploration or military operations, where resilience against water, dust, shock, and extreme temperatures is critical.
Operating System:
- Windows Tablets: Continue to hold a strong position, especially in enterprise environments where compatibility with existing software infrastructure and legacy applications is crucial. The development of Windows 11 for rugged devices further solidifies its presence, driven by the need for comprehensive data management and security.
- Android Tablets: Gaining significant traction, particularly in logistics, retail, and healthcare, due to their user-friendly interface, extensive app ecosystem, and cost-effectiveness. Government initiatives promoting digital data collection and citizen services are also accelerating Android adoption.
End-User Industry:
- Manufacturing: A primary driver, demanding tablets for quality control, inventory management, shop floor automation, and maintenance. Government incentives for Industry 4.0 adoption and the need for real-time data access on the factory floor are key economic factors.
- Energy and Power / Oil and Gas: These sectors rely heavily on rugged tablets for asset management, inspection, data logging, and safety monitoring in remote and hazardous locations. Strict regulatory compliance and the high cost of downtime make these devices essential.
- Transportation and Logistics: The booming e-commerce sector and the need for efficient supply chain management are propelling the demand for tablets for route optimization, proof of delivery, inventory tracking, and driver management.
- Automotive: Tablets are increasingly used in automotive manufacturing for assembly line guidance, quality checks, and in service centers for diagnostics and customer management.
- Agriculture and Farming: Precision agriculture is driving the adoption of rugged tablets for farm management software, GPS-guided operations, sensor data monitoring, and yield analysis, supported by initiatives for agricultural modernization.
Tablet PC Industry Product Developments
Recent product developments in the Tablet PC Industry highlight a clear trend towards enhanced performance, ruggedness, and specialized functionalities. Companies are focusing on integrating the latest generation processors, such as 12th-generation Intel Core, to deliver superior computing power for demanding field applications, as exemplified by Durabook's R8 tablet. Innovations also include larger, sunlight-readable displays and improved battery life to ensure continuous operation in challenging environments. The integration of Windows 11 and advanced customization options, as seen with Juniper Systems' Mesa Pro, caters to diverse end-user needs, from field service to specialized industrial tasks. These advancements provide competitive advantages by enabling users to perform complex tasks, access critical data, and maintain productivity irrespective of their work location or environmental conditions, thereby directly addressing the growing demands across manufacturing, transportation, and energy sectors.
Key Drivers of Tablet PC Industry Growth
The Tablet PC Industry's growth is propelled by several interconnected factors. Firstly, the relentless march of digital transformation across sectors like manufacturing, energy, and logistics mandates the use of robust mobile devices for data acquisition, analysis, and communication in challenging environments. Secondly, technological advancements, including the integration of powerful processors, 5G connectivity, and improved battery technology, are enhancing device performance and utility. Thirdly, stringent industry regulations and safety standards in fields like oil and gas and construction necessitate the adoption of rugged tablets that can withstand extreme conditions, thereby minimizing operational risks and downtime. Furthermore, the increasing need for real-time data accessibility and worker productivity in remote and harsh locations is a significant economic driver. Initiatives promoting smart cities and IoT integration also contribute, requiring connected and durable computing solutions.
Challenges in the Tablet PC Industry Market
The Tablet PC Industry faces several persistent challenges that can impede its growth trajectory. Supply chain disruptions, particularly for critical components like semiconductors, can lead to production delays and increased costs, impacting the availability of devices. Intense competition from both established players and emerging manufacturers leads to price pressures, particularly in the semi-rugged and industrial-grade segments. Furthermore, the rapid pace of technological evolution requires continuous R&D investment to remain competitive, posing a financial challenge for smaller enterprises. The need for specialized certifications and adherence to diverse industry-specific regulations can also be a barrier to entry and increase product development costs. Evolving cybersecurity threats necessitate ongoing investment in robust security features, adding to the overall cost of devices.
Emerging Opportunities in Tablet PC Industry
Emerging opportunities within the Tablet PC Industry are abundant and driven by evolving technological landscapes and expanding market demands. The widespread adoption of the Internet of Things (IoT) is creating significant opportunities for rugged tablets to serve as central control and data aggregation points in smart factories, smart grids, and connected logistics networks. The increasing focus on predictive maintenance and AI-driven analytics in industrial sectors opens avenues for tablets equipped with advanced sensors and processing power to support these applications. Furthermore, government initiatives aimed at modernizing infrastructure, enhancing public safety, and promoting digital agriculture are creating new demand centers for ruggedized mobile solutions. Strategic partnerships between tablet manufacturers and software developers specializing in industry-specific applications can unlock new markets and offer integrated solutions, thereby driving long-term growth and market expansion.
Leading Players in the Tablet PC Industry Sector
- NEXCOM International Co Ltd
- Durabook (Twinhead International)
- Getac Technology Corporation
- RuggON Corporation
- Bartec GmbH
- Mobile Worxs
- Samsung Electronics Co Ltd
- Siemens AG
- Mobile Demand LLC
- Winmate Inc
- Zebra Technologies Corp
- Advantech Corporation
- AAEON Technology Inc
- ARBOR Technology Corp Ltd
- Panasonic Corporation
- Dell Technologies
Key Milestones in Tablet PC Industry Industry
- September 2022: Durabook, a Twinhead International Corporation brand, launched its R8, an 8" fully rugged tablet featuring 12th-gen Intel Core processors. This launch targets demanding field service workers in manufacturing, transportation, logistics, utilities, and law enforcement.
- August 2022: Juniper Systems introduced the Mesa Pro Rugged Tablet, expanding its 10-inch rugged tablet offerings. It features 11th-gen Intel Core processors, Windows 11, extensive customization, and a sunlight-readable display, signaling an enhanced competitive presence in the rugged market.
Strategic Outlook for Tablet PC Industry Market
The strategic outlook for the Tablet PC Industry remains exceptionally positive, driven by the undeniable need for durable, reliable, and powerful mobile computing solutions across a widening array of industries. Growth accelerators include the continued global push towards industrial automation (Industry 4.0), the expansion of 5G networks enabling real-time data transfer and remote operations, and the increasing demand for precision agriculture and smart city technologies. The sector is poised for further innovation in areas such as enhanced AI integration for predictive analytics, improved battery longevity for extended field use, and the development of more ergonomic and user-friendly designs for rugged devices. Strategic collaborations and market expansion into emerging economies will be critical for sustained revenue growth. As businesses prioritize operational resilience and workforce efficiency, the demand for specialized rugged and industrial tablets is expected to outpace the broader tablet market, presenting significant long-term opportunities for leading players and innovative newcomers alike.
Tablet PC Industry Segmentation
-
1. Type
- 1.1. Fully Rugged
- 1.2. Semi-Rugged
- 1.3. Ultra Rugged
-
2. Operating System
- 2.1. Windows
- 2.2. Android
-
3. End-User Industry
- 3.1. Manufacturing
- 3.2. Energy and Power
- 3.3. Oil and Gas
- 3.4. Transportation and Logistics
- 3.5. Automotive
- 3.6. Agriculture and Farming
- 3.7. Other End-User Industries
Tablet PC Industry Segmentation By Geography
- 1. North America
- 2. Europe
- 3. Asia Pacific
- 4. Latin America
- 5. Middle East and Africa
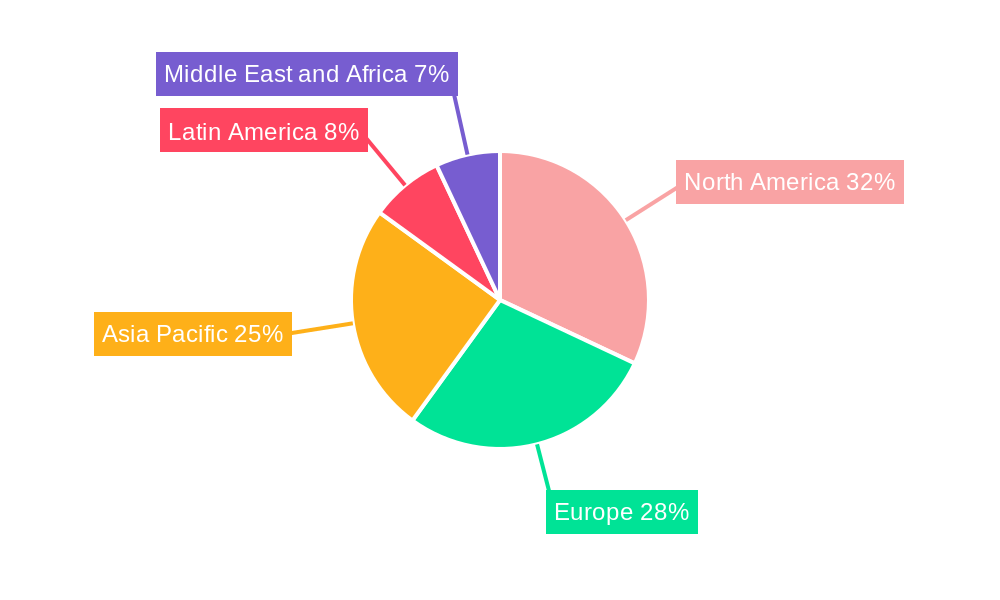
Tablet PC Industry Regional Market Share
Geographic Coverage of Tablet PC Industry
Tablet PC Industry REPORT HIGHLIGHTS
| Aspects | Details |
|---|---|
| Study Period | 2020-2034 |
| Base Year | 2025 |
| Estimated Year | 2026 |
| Forecast Period | 2026-2034 |
| Historical Period | 2020-2025 |
| Growth Rate | CAGR of 6.38% from 2020-2034 |
| Segmentation |
|
Table of Contents
- 1. Introduction
- 1.1. Research Scope
- 1.2. Market Segmentation
- 1.3. Research Methodology
- 1.4. Definitions and Assumptions
- 2. Executive Summary
- 2.1. Introduction
- 3. Market Dynamics
- 3.1. Introduction
- 3.2. Market Drivers
- 3.2.1. Increased Demand for Rugged Industrial Handheld Computing Devices in Manufacturing Sector; Product Innovation and Design Robustness
- 3.3. Market Restrains
- 3.3.1. Shorter Operating Range of WiGig Products
- 3.4. Market Trends
- 3.4.1. Transport & Logistics Holds Significant Share in Industrial Tablet PC Market
- 4. Market Factor Analysis
- 4.1. Porters Five Forces
- 4.2. Supply/Value Chain
- 4.3. PESTEL analysis
- 4.4. Market Entropy
- 4.5. Patent/Trademark Analysis
- 5. Global Tablet PC Industry Analysis, Insights and Forecast, 2020-2032
- 5.1. Market Analysis, Insights and Forecast - by Type
- 5.1.1. Fully Rugged
- 5.1.2. Semi-Rugged
- 5.1.3. Ultra Rugged
- 5.2. Market Analysis, Insights and Forecast - by Operating System
- 5.2.1. Windows
- 5.2.2. Android
- 5.3. Market Analysis, Insights and Forecast - by End-User Industry
- 5.3.1. Manufacturing
- 5.3.2. Energy and Power
- 5.3.3. Oil and Gas
- 5.3.4. Transportation and Logistics
- 5.3.5. Automotive
- 5.3.6. Agriculture and Farming
- 5.3.7. Other End-User Industries
- 5.4. Market Analysis, Insights and Forecast - by Region
- 5.4.1. North America
- 5.4.2. Europe
- 5.4.3. Asia Pacific
- 5.4.4. Latin America
- 5.4.5. Middle East and Africa
- 5.1. Market Analysis, Insights and Forecast - by Type
- 6. North America Tablet PC Industry Analysis, Insights and Forecast, 2020-2032
- 6.1. Market Analysis, Insights and Forecast - by Type
- 6.1.1. Fully Rugged
- 6.1.2. Semi-Rugged
- 6.1.3. Ultra Rugged
- 6.2. Market Analysis, Insights and Forecast - by Operating System
- 6.2.1. Windows
- 6.2.2. Android
- 6.3. Market Analysis, Insights and Forecast - by End-User Industry
- 6.3.1. Manufacturing
- 6.3.2. Energy and Power
- 6.3.3. Oil and Gas
- 6.3.4. Transportation and Logistics
- 6.3.5. Automotive
- 6.3.6. Agriculture and Farming
- 6.3.7. Other End-User Industries
- 6.1. Market Analysis, Insights and Forecast - by Type
- 7. Europe Tablet PC Industry Analysis, Insights and Forecast, 2020-2032
- 7.1. Market Analysis, Insights and Forecast - by Type
- 7.1.1. Fully Rugged
- 7.1.2. Semi-Rugged
- 7.1.3. Ultra Rugged
- 7.2. Market Analysis, Insights and Forecast - by Operating System
- 7.2.1. Windows
- 7.2.2. Android
- 7.3. Market Analysis, Insights and Forecast - by End-User Industry
- 7.3.1. Manufacturing
- 7.3.2. Energy and Power
- 7.3.3. Oil and Gas
- 7.3.4. Transportation and Logistics
- 7.3.5. Automotive
- 7.3.6. Agriculture and Farming
- 7.3.7. Other End-User Industries
- 7.1. Market Analysis, Insights and Forecast - by Type
- 8. Asia Pacific Tablet PC Industry Analysis, Insights and Forecast, 2020-2032
- 8.1. Market Analysis, Insights and Forecast - by Type
- 8.1.1. Fully Rugged
- 8.1.2. Semi-Rugged
- 8.1.3. Ultra Rugged
- 8.2. Market Analysis, Insights and Forecast - by Operating System
- 8.2.1. Windows
- 8.2.2. Android
- 8.3. Market Analysis, Insights and Forecast - by End-User Industry
- 8.3.1. Manufacturing
- 8.3.2. Energy and Power
- 8.3.3. Oil and Gas
- 8.3.4. Transportation and Logistics
- 8.3.5. Automotive
- 8.3.6. Agriculture and Farming
- 8.3.7. Other End-User Industries
- 8.1. Market Analysis, Insights and Forecast - by Type
- 9. Latin America Tablet PC Industry Analysis, Insights and Forecast, 2020-2032
- 9.1. Market Analysis, Insights and Forecast - by Type
- 9.1.1. Fully Rugged
- 9.1.2. Semi-Rugged
- 9.1.3. Ultra Rugged
- 9.2. Market Analysis, Insights and Forecast - by Operating System
- 9.2.1. Windows
- 9.2.2. Android
- 9.3. Market Analysis, Insights and Forecast - by End-User Industry
- 9.3.1. Manufacturing
- 9.3.2. Energy and Power
- 9.3.3. Oil and Gas
- 9.3.4. Transportation and Logistics
- 9.3.5. Automotive
- 9.3.6. Agriculture and Farming
- 9.3.7. Other End-User Industries
- 9.1. Market Analysis, Insights and Forecast - by Type
- 10. Middle East and Africa Tablet PC Industry Analysis, Insights and Forecast, 2020-2032
- 10.1. Market Analysis, Insights and Forecast - by Type
- 10.1.1. Fully Rugged
- 10.1.2. Semi-Rugged
- 10.1.3. Ultra Rugged
- 10.2. Market Analysis, Insights and Forecast - by Operating System
- 10.2.1. Windows
- 10.2.2. Android
- 10.3. Market Analysis, Insights and Forecast - by End-User Industry
- 10.3.1. Manufacturing
- 10.3.2. Energy and Power
- 10.3.3. Oil and Gas
- 10.3.4. Transportation and Logistics
- 10.3.5. Automotive
- 10.3.6. Agriculture and Farming
- 10.3.7. Other End-User Industries
- 10.1. Market Analysis, Insights and Forecast - by Type
- 11. Competitive Analysis
- 11.1. Global Market Share Analysis 2025
- 11.2. Company Profiles
- 11.2.1 NEXCOM International Co Ltd
- 11.2.1.1. Overview
- 11.2.1.2. Products
- 11.2.1.3. SWOT Analysis
- 11.2.1.4. Recent Developments
- 11.2.1.5. Financials (Based on Availability)
- 11.2.2 Durabook (Twinhead International)
- 11.2.2.1. Overview
- 11.2.2.2. Products
- 11.2.2.3. SWOT Analysis
- 11.2.2.4. Recent Developments
- 11.2.2.5. Financials (Based on Availability)
- 11.2.3 Getac Technology Corporation
- 11.2.3.1. Overview
- 11.2.3.2. Products
- 11.2.3.3. SWOT Analysis
- 11.2.3.4. Recent Developments
- 11.2.3.5. Financials (Based on Availability)
- 11.2.4 RuggON Corporation
- 11.2.4.1. Overview
- 11.2.4.2. Products
- 11.2.4.3. SWOT Analysis
- 11.2.4.4. Recent Developments
- 11.2.4.5. Financials (Based on Availability)
- 11.2.5 Bartec GmbH
- 11.2.5.1. Overview
- 11.2.5.2. Products
- 11.2.5.3. SWOT Analysis
- 11.2.5.4. Recent Developments
- 11.2.5.5. Financials (Based on Availability)
- 11.2.6 Mobile Worxs*List Not Exhaustive
- 11.2.6.1. Overview
- 11.2.6.2. Products
- 11.2.6.3. SWOT Analysis
- 11.2.6.4. Recent Developments
- 11.2.6.5. Financials (Based on Availability)
- 11.2.7 Samsung Electronics Co Ltd
- 11.2.7.1. Overview
- 11.2.7.2. Products
- 11.2.7.3. SWOT Analysis
- 11.2.7.4. Recent Developments
- 11.2.7.5. Financials (Based on Availability)
- 11.2.8 Siemens AG
- 11.2.8.1. Overview
- 11.2.8.2. Products
- 11.2.8.3. SWOT Analysis
- 11.2.8.4. Recent Developments
- 11.2.8.5. Financials (Based on Availability)
- 11.2.9 Mobile Demand LLC
- 11.2.9.1. Overview
- 11.2.9.2. Products
- 11.2.9.3. SWOT Analysis
- 11.2.9.4. Recent Developments
- 11.2.9.5. Financials (Based on Availability)
- 11.2.10 Winmate Inc
- 11.2.10.1. Overview
- 11.2.10.2. Products
- 11.2.10.3. SWOT Analysis
- 11.2.10.4. Recent Developments
- 11.2.10.5. Financials (Based on Availability)
- 11.2.11 Zebra Technologies Corp
- 11.2.11.1. Overview
- 11.2.11.2. Products
- 11.2.11.3. SWOT Analysis
- 11.2.11.4. Recent Developments
- 11.2.11.5. Financials (Based on Availability)
- 11.2.12 Advantech Corporation
- 11.2.12.1. Overview
- 11.2.12.2. Products
- 11.2.12.3. SWOT Analysis
- 11.2.12.4. Recent Developments
- 11.2.12.5. Financials (Based on Availability)
- 11.2.13 AAEON Technology Inc
- 11.2.13.1. Overview
- 11.2.13.2. Products
- 11.2.13.3. SWOT Analysis
- 11.2.13.4. Recent Developments
- 11.2.13.5. Financials (Based on Availability)
- 11.2.14 ARBOR Technology Co Ltd
- 11.2.14.1. Overview
- 11.2.14.2. Products
- 11.2.14.3. SWOT Analysis
- 11.2.14.4. Recent Developments
- 11.2.14.5. Financials (Based on Availability)
- 11.2.15 Panasonic Corporation
- 11.2.15.1. Overview
- 11.2.15.2. Products
- 11.2.15.3. SWOT Analysis
- 11.2.15.4. Recent Developments
- 11.2.15.5. Financials (Based on Availability)
- 11.2.16 Dell Technologies
- 11.2.16.1. Overview
- 11.2.16.2. Products
- 11.2.16.3. SWOT Analysis
- 11.2.16.4. Recent Developments
- 11.2.16.5. Financials (Based on Availability)
- 11.2.1 NEXCOM International Co Ltd
List of Figures
- Figure 1: Global Tablet PC Industry Revenue Breakdown (Million, %) by Region 2025 & 2033
- Figure 2: North America Tablet PC Industry Revenue (Million), by Type 2025 & 2033
- Figure 3: North America Tablet PC Industry Revenue Share (%), by Type 2025 & 2033
- Figure 4: North America Tablet PC Industry Revenue (Million), by Operating System 2025 & 2033
- Figure 5: North America Tablet PC Industry Revenue Share (%), by Operating System 2025 & 2033
- Figure 6: North America Tablet PC Industry Revenue (Million), by End-User Industry 2025 & 2033
- Figure 7: North America Tablet PC Industry Revenue Share (%), by End-User Industry 2025 & 2033
- Figure 8: North America Tablet PC Industry Revenue (Million), by Country 2025 & 2033
- Figure 9: North America Tablet PC Industry Revenue Share (%), by Country 2025 & 2033
- Figure 10: Europe Tablet PC Industry Revenue (Million), by Type 2025 & 2033
- Figure 11: Europe Tablet PC Industry Revenue Share (%), by Type 2025 & 2033
- Figure 12: Europe Tablet PC Industry Revenue (Million), by Operating System 2025 & 2033
- Figure 13: Europe Tablet PC Industry Revenue Share (%), by Operating System 2025 & 2033
- Figure 14: Europe Tablet PC Industry Revenue (Million), by End-User Industry 2025 & 2033
- Figure 15: Europe Tablet PC Industry Revenue Share (%), by End-User Industry 2025 & 2033
- Figure 16: Europe Tablet PC Industry Revenue (Million), by Country 2025 & 2033
- Figure 17: Europe Tablet PC Industry Revenue Share (%), by Country 2025 & 2033
- Figure 18: Asia Pacific Tablet PC Industry Revenue (Million), by Type 2025 & 2033
- Figure 19: Asia Pacific Tablet PC Industry Revenue Share (%), by Type 2025 & 2033
- Figure 20: Asia Pacific Tablet PC Industry Revenue (Million), by Operating System 2025 & 2033
- Figure 21: Asia Pacific Tablet PC Industry Revenue Share (%), by Operating System 2025 & 2033
- Figure 22: Asia Pacific Tablet PC Industry Revenue (Million), by End-User Industry 2025 & 2033
- Figure 23: Asia Pacific Tablet PC Industry Revenue Share (%), by End-User Industry 2025 & 2033
- Figure 24: Asia Pacific Tablet PC Industry Revenue (Million), by Country 2025 & 2033
- Figure 25: Asia Pacific Tablet PC Industry Revenue Share (%), by Country 2025 & 2033
- Figure 26: Latin America Tablet PC Industry Revenue (Million), by Type 2025 & 2033
- Figure 27: Latin America Tablet PC Industry Revenue Share (%), by Type 2025 & 2033
- Figure 28: Latin America Tablet PC Industry Revenue (Million), by Operating System 2025 & 2033
- Figure 29: Latin America Tablet PC Industry Revenue Share (%), by Operating System 2025 & 2033
- Figure 30: Latin America Tablet PC Industry Revenue (Million), by End-User Industry 2025 & 2033
- Figure 31: Latin America Tablet PC Industry Revenue Share (%), by End-User Industry 2025 & 2033
- Figure 32: Latin America Tablet PC Industry Revenue (Million), by Country 2025 & 2033
- Figure 33: Latin America Tablet PC Industry Revenue Share (%), by Country 2025 & 2033
- Figure 34: Middle East and Africa Tablet PC Industry Revenue (Million), by Type 2025 & 2033
- Figure 35: Middle East and Africa Tablet PC Industry Revenue Share (%), by Type 2025 & 2033
- Figure 36: Middle East and Africa Tablet PC Industry Revenue (Million), by Operating System 2025 & 2033
- Figure 37: Middle East and Africa Tablet PC Industry Revenue Share (%), by Operating System 2025 & 2033
- Figure 38: Middle East and Africa Tablet PC Industry Revenue (Million), by End-User Industry 2025 & 2033
- Figure 39: Middle East and Africa Tablet PC Industry Revenue Share (%), by End-User Industry 2025 & 2033
- Figure 40: Middle East and Africa Tablet PC Industry Revenue (Million), by Country 2025 & 2033
- Figure 41: Middle East and Africa Tablet PC Industry Revenue Share (%), by Country 2025 & 2033
List of Tables
- Table 1: Global Tablet PC Industry Revenue Million Forecast, by Type 2020 & 2033
- Table 2: Global Tablet PC Industry Revenue Million Forecast, by Operating System 2020 & 2033
- Table 3: Global Tablet PC Industry Revenue Million Forecast, by End-User Industry 2020 & 2033
- Table 4: Global Tablet PC Industry Revenue Million Forecast, by Region 2020 & 2033
- Table 5: Global Tablet PC Industry Revenue Million Forecast, by Type 2020 & 2033
- Table 6: Global Tablet PC Industry Revenue Million Forecast, by Operating System 2020 & 2033
- Table 7: Global Tablet PC Industry Revenue Million Forecast, by End-User Industry 2020 & 2033
- Table 8: Global Tablet PC Industry Revenue Million Forecast, by Country 2020 & 2033
- Table 9: Global Tablet PC Industry Revenue Million Forecast, by Type 2020 & 2033
- Table 10: Global Tablet PC Industry Revenue Million Forecast, by Operating System 2020 & 2033
- Table 11: Global Tablet PC Industry Revenue Million Forecast, by End-User Industry 2020 & 2033
- Table 12: Global Tablet PC Industry Revenue Million Forecast, by Country 2020 & 2033
- Table 13: Global Tablet PC Industry Revenue Million Forecast, by Type 2020 & 2033
- Table 14: Global Tablet PC Industry Revenue Million Forecast, by Operating System 2020 & 2033
- Table 15: Global Tablet PC Industry Revenue Million Forecast, by End-User Industry 2020 & 2033
- Table 16: Global Tablet PC Industry Revenue Million Forecast, by Country 2020 & 2033
- Table 17: Global Tablet PC Industry Revenue Million Forecast, by Type 2020 & 2033
- Table 18: Global Tablet PC Industry Revenue Million Forecast, by Operating System 2020 & 2033
- Table 19: Global Tablet PC Industry Revenue Million Forecast, by End-User Industry 2020 & 2033
- Table 20: Global Tablet PC Industry Revenue Million Forecast, by Country 2020 & 2033
- Table 21: Global Tablet PC Industry Revenue Million Forecast, by Type 2020 & 2033
- Table 22: Global Tablet PC Industry Revenue Million Forecast, by Operating System 2020 & 2033
- Table 23: Global Tablet PC Industry Revenue Million Forecast, by End-User Industry 2020 & 2033
- Table 24: Global Tablet PC Industry Revenue Million Forecast, by Country 2020 & 2033
Frequently Asked Questions
1. What is the projected Compound Annual Growth Rate (CAGR) of the Tablet PC Industry?
The projected CAGR is approximately 6.38%.
2. Which companies are prominent players in the Tablet PC Industry?
Key companies in the market include NEXCOM International Co Ltd, Durabook (Twinhead International), Getac Technology Corporation, RuggON Corporation, Bartec GmbH, Mobile Worxs*List Not Exhaustive, Samsung Electronics Co Ltd, Siemens AG, Mobile Demand LLC, Winmate Inc, Zebra Technologies Corp, Advantech Corporation, AAEON Technology Inc, ARBOR Technology Co Ltd, Panasonic Corporation, Dell Technologies.
3. What are the main segments of the Tablet PC Industry?
The market segments include Type, Operating System, End-User Industry.
4. Can you provide details about the market size?
The market size is estimated to be USD 1.05 Million as of 2022.
5. What are some drivers contributing to market growth?
Increased Demand for Rugged Industrial Handheld Computing Devices in Manufacturing Sector; Product Innovation and Design Robustness.
6. What are the notable trends driving market growth?
Transport & Logistics Holds Significant Share in Industrial Tablet PC Market.
7. Are there any restraints impacting market growth?
Shorter Operating Range of WiGig Products.
8. Can you provide examples of recent developments in the market?
September 2022: Durabook, the rugged mobile solutions provider owned by Twinhead International Corporation, announced the launch of its R8, an 8" fully rugged tablet featuring 12th generation Intel Core processors for powerful performance. It is designed to meet the increasing demands of field service workers operating across some of the most challenging sectors, including manufacturing, transportation, logistics, field services, and utility industries, as well as law enforcement departments and government agencies.
9. What pricing options are available for accessing the report?
Pricing options include single-user, multi-user, and enterprise licenses priced at USD 4750, USD 5250, and USD 8750 respectively.
10. Is the market size provided in terms of value or volume?
The market size is provided in terms of value, measured in Million.
11. Are there any specific market keywords associated with the report?
Yes, the market keyword associated with the report is "Tablet PC Industry," which aids in identifying and referencing the specific market segment covered.
12. How do I determine which pricing option suits my needs best?
The pricing options vary based on user requirements and access needs. Individual users may opt for single-user licenses, while businesses requiring broader access may choose multi-user or enterprise licenses for cost-effective access to the report.
13. Are there any additional resources or data provided in the Tablet PC Industry report?
While the report offers comprehensive insights, it's advisable to review the specific contents or supplementary materials provided to ascertain if additional resources or data are available.
14. How can I stay updated on further developments or reports in the Tablet PC Industry?
To stay informed about further developments, trends, and reports in the Tablet PC Industry, consider subscribing to industry newsletters, following relevant companies and organizations, or regularly checking reputable industry news sources and publications.
Methodology
Step 1 - Identification of Relevant Samples Size from Population Database


Step 2 - Approaches for Defining Global Market Size (Value, Volume* & Price*)

Note*: In applicable scenarios
Step 3 - Data Sources
Primary Research
- Web Analytics
- Survey Reports
- Research Institute
- Latest Research Reports
- Opinion Leaders
Secondary Research
- Annual Reports
- White Paper
- Latest Press Release
- Industry Association
- Paid Database
- Investor Presentations

Step 4 - Data Triangulation
Involves using different sources of information in order to increase the validity of a study
These sources are likely to be stakeholders in a program - participants, other researchers, program staff, other community members, and so on.
Then we put all data in single framework & apply various statistical tools to find out the dynamic on the market.
During the analysis stage, feedback from the stakeholder groups would be compared to determine areas of agreement as well as areas of divergence