

Key Insights
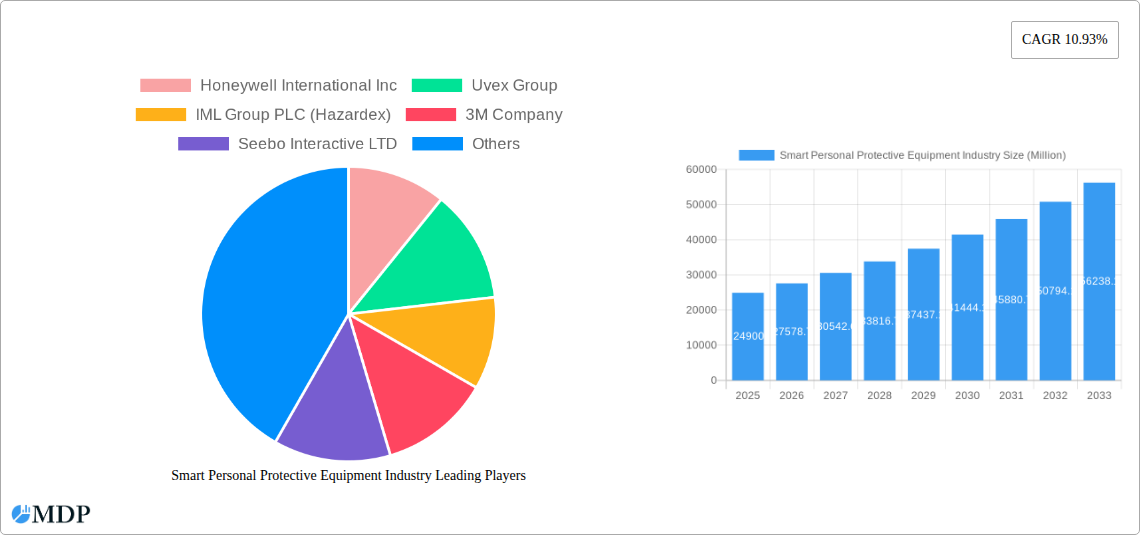
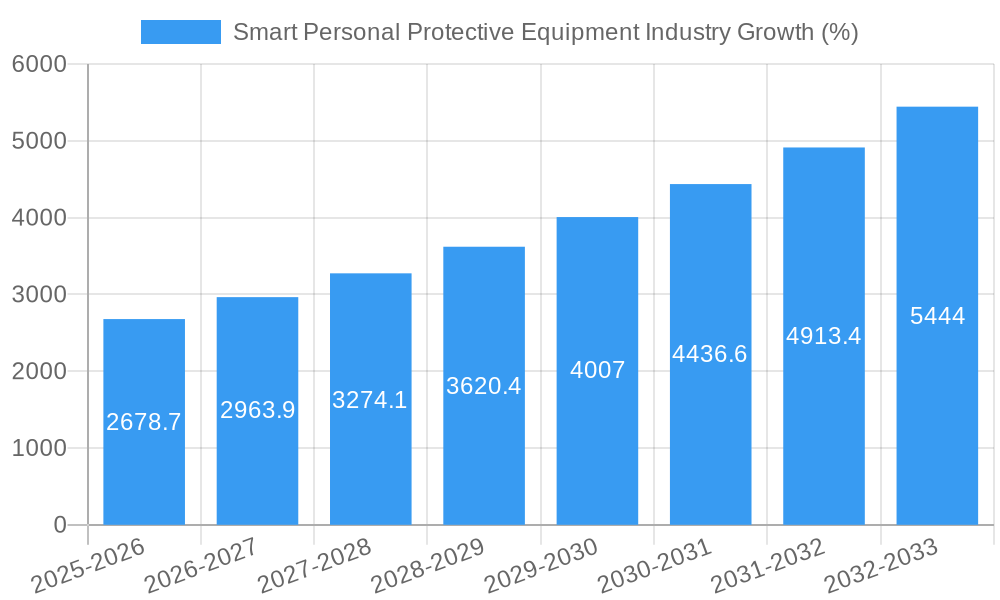
The global Smart Personal Protective Equipment (Smart PPE) market is experiencing robust growth, projected to reach $24.90 billion in 2025 and exhibiting a Compound Annual Growth Rate (CAGR) of 10.93% from 2025 to 2033. This expansion is driven by several key factors. Increasing workplace safety regulations across various industries, particularly construction, mining, and manufacturing, are mandating the adoption of advanced safety solutions. Furthermore, the rising awareness of worker well-being and the potential for reduced workplace injuries through technology integration are significant catalysts. The integration of smart technologies, such as sensors, connectivity, and data analytics, within PPE enhances worker safety by providing real-time monitoring, early hazard detection, and improved situational awareness. The increasing adoption of Industry 4.0 principles and the growing demand for connected worker solutions are further fueling market growth. Specific segments within Smart PPE, such as head protection incorporating impact sensors and fall protection systems with integrated safety alerts, are exhibiting particularly strong growth trajectories. Technological advancements, such as the development of more comfortable and user-friendly smart garments and improved data processing capabilities, are contributing to market expansion.
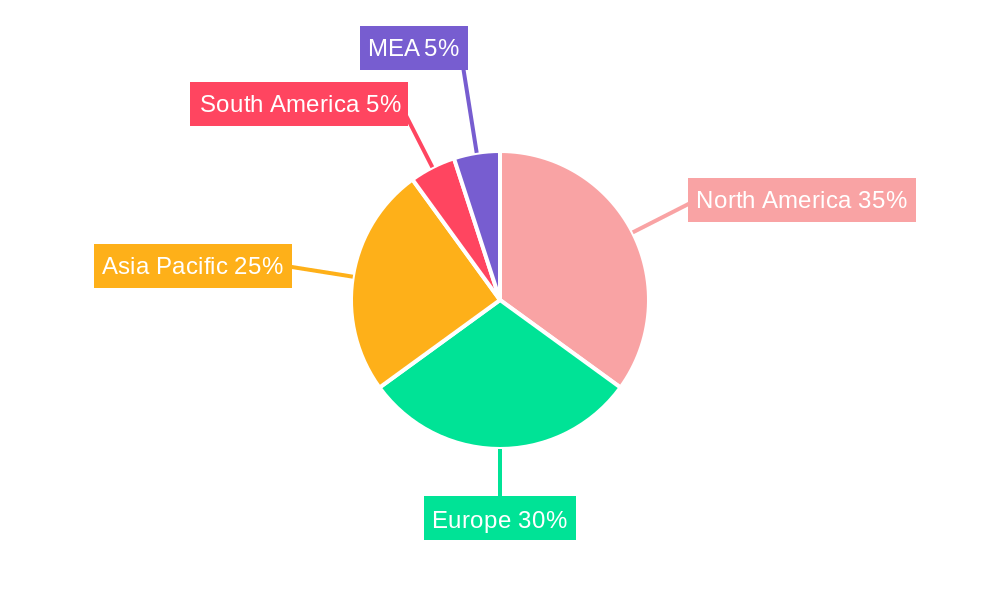
The market is segmented by PPE type (eye and face protection, hearing protection, head protection, fall protection, smart clothing, others) and end-user industry (construction, mining, oil & gas, manufacturing, automotive, others). North America, Europe, and Asia-Pacific currently represent the largest regional markets, driven by robust industrial sectors and a higher adoption rate of advanced technologies. However, developing economies in Asia-Pacific and South America are poised for significant growth, driven by increasing industrialization and infrastructure development. Competition in the market is relatively high, with established players like Honeywell International Inc., 3M Company, and Uvex Group competing alongside innovative startups focused on specific niche applications. Future growth will likely be influenced by factors such as advancements in sensor technology, the development of more sophisticated data analytics platforms, and the evolving regulatory landscape surrounding workplace safety. The continued integration of artificial intelligence and machine learning into Smart PPE is expected to lead to more proactive safety measures and improved worker efficiency.
Smart Personal Protective Equipment (PPE) Market: A Comprehensive Analysis 2019-2033
This insightful report provides a comprehensive analysis of the burgeoning Smart Personal Protective Equipment (PPE) market, offering invaluable insights for stakeholders seeking to navigate this rapidly evolving landscape. With a detailed study period spanning 2019-2033 (base year 2025, forecast period 2025-2033), this report unravels market dynamics, growth drivers, challenges, and emerging opportunities. The market is projected to reach $XX Million by 2033, exhibiting a CAGR of XX% during the forecast period.
Smart Personal Protective Equipment Industry Market Dynamics & Concentration
The Smart PPE market is characterized by moderate concentration, with key players like Honeywell International Inc, 3M Company, and Uvex Group holding significant market share. However, the market also features numerous smaller, specialized companies driving innovation. Market concentration is expected to remain relatively stable during the forecast period, with a Herfindahl-Hirschman Index (HHI) of approximately XX. Innovation is a key driver, fueled by advancements in sensor technology, connectivity, and data analytics. Stringent safety regulations across various end-user industries are shaping market dynamics, pushing manufacturers to develop more sophisticated and compliant products. Substitutes for smart PPE include traditional PPE, but the added functionality and data-driven insights of smart PPE are increasingly preferred. End-user trends show a growing preference for integrated safety solutions, while M&A activity in the market is steadily increasing. Over the historical period (2019-2024), approximately XX M&A deals were recorded, indicating significant consolidation and strategic expansion within the industry. The number is expected to reach XX by 2033.
Smart Personal Protective Equipment Industry Industry Trends & Analysis
The Smart PPE market is experiencing robust growth, driven by increasing awareness of workplace safety, the demand for enhanced worker productivity, and the rising adoption of Industry 4.0 technologies. Technological disruptions, particularly in areas like IoT and AI, are transforming PPE, enabling real-time monitoring, data analysis, and predictive maintenance. Consumer preferences are shifting towards comfortable, lightweight, and user-friendly smart PPE that seamlessly integrates into existing workflows. The competitive landscape is dynamic, with established players facing challenges from innovative startups and technology companies entering the market. The market penetration of smart PPE in various end-user industries is gradually increasing, driven by factors such as government mandates and corporate social responsibility initiatives. This trend is expected to continue, with a projected market penetration of XX% by 2033.
Leading Markets & Segments in Smart Personal Protective Equipment Industry
North America currently dominates the Smart PPE market, driven by strong regulatory frameworks, a high concentration of manufacturing industries, and significant investments in technological advancements. Within the segment breakdown:
- Type: Head protection and fall protection currently represent the largest segments, but smart clothing is projected to witness significant growth due to expanding applications and technological enhancements.
- End-User Industry: Construction, manufacturing, and oil & gas industries are key consumers of Smart PPE, fueled by higher safety standards and the need for real-time worker monitoring. Key drivers include:
- Construction: Growing infrastructure projects and government regulations.
- Manufacturing: Automation and the increasing use of robotics.
- Oil & Gas: Demand for enhanced worker safety in hazardous environments.
The European market is expected to experience significant growth during the forecast period due to increasing investments in safety infrastructure and the stringent regulatory landscape. The Asia-Pacific region, while currently smaller, shows high growth potential owing to rapid industrialization and rising safety consciousness.
Smart Personal Protective Equipment Industry Product Developments
Recent product innovations in Smart PPE include enhanced sensor technology for improved accuracy and durability, better integration with existing safety management systems, and the development of more comfortable and ergonomic designs. The market is witnessing a shift towards wearable technology, including smart helmets, smart glasses, and connected clothing, offering real-time data on worker location, vital signs, and environmental conditions. This trend is driven by the need for improved situational awareness and proactive safety measures, resulting in a better market fit and increased adoption across various sectors.
Key Drivers of Smart Personal Protective Equipment Industry Growth
Several key factors propel the growth of the Smart PPE market:
- Technological Advancements: Miniaturization of sensors, improved connectivity, and advancements in data analytics are expanding the capabilities of smart PPE.
- Stringent Safety Regulations: Governments are enforcing stricter safety regulations, making smart PPE adoption a necessity.
- Economic Growth: Economic expansion in key regions, particularly in developing economies, fuels demand for improved worker safety and efficiency.
Challenges in the Smart Personal Protective Equipment Industry Market
Several challenges hinder market growth:
- High Initial Investment Costs: The implementation of smart PPE systems requires a significant upfront investment, creating a barrier to entry for smaller companies.
- Data Privacy and Security Concerns: Concerns over data privacy and the security of sensitive worker information are slowing adoption.
- Interoperability Issues: Lack of standardization across different smart PPE systems can hinder seamless integration and data sharing. This results in a potential XX Million loss annually.
Emerging Opportunities in Smart Personal Protective Equipment Industry
The Smart PPE market offers numerous growth opportunities:
- Integration with AI and Machine Learning: Advanced analytics can improve accident prediction and prevention.
- Strategic Partnerships: Collaboration between PPE manufacturers, technology providers, and safety management companies can accelerate market penetration.
- Expansion into New Markets: Emerging economies present untapped market potential for smart PPE solutions.
Leading Players in the Smart Personal Protective Equipment Industry Sector
- Honeywell International Inc
- Uvex Group
- IML Group PLC (Hazardex)
- 3M Company
- Seebo Interactive LTD
- Tenacious Holdings Inc (dba Ergodyne)
- Intellinium
- Daqri
- Vuzix Corp
- Corvex Connected Worker
Key Milestones in Smart Personal Protective Equipment Industry Industry
- 2020: Increased focus on remote worker monitoring due to the COVID-19 pandemic.
- 2021: Several significant product launches featuring integrated sensor technologies.
- 2022: Growing partnerships between PPE manufacturers and technology companies.
- 2023: Increased regulatory scrutiny of data privacy and security in smart PPE.
- 2024: Significant M&A activity as larger companies acquire smaller, innovative firms.
Strategic Outlook for Smart Personal Protective Equipment Industry Market
The future of the Smart PPE market is bright, driven by continuous technological innovation and increasing demand for advanced safety solutions. Strategic opportunities exist for companies focused on developing interoperable systems, improving data analytics capabilities, and expanding into emerging markets. The market is expected to continue experiencing substantial growth, fueled by a convergence of technological advancements, regulatory changes, and shifting consumer preferences. The long-term outlook is positive, with significant potential for market expansion and growth.
Smart Personal Protective Equipment Industry Segmentation
-
1. Type
- 1.1. Eye and Face Protection
- 1.2. Hearing Protection
- 1.3. Head Protection
- 1.4. Fall Protection
- 1.5. Smart Clothing
- 1.6. Other Types
-
2. End-user Industry
- 2.1. Construction
- 2.2. Mining
- 2.3. Oil and Gas
- 2.4. Manufacturing
- 2.5. Automotive
- 2.6. Other End-user Industries
Smart Personal Protective Equipment Industry Segmentation By Geography
- 1. North America
- 2. Europe
- 3. Asia
- 4. Australia and New Zealand
- 5. Latin America
- 6. Middle East and Africa
Smart Personal Protective Equipment Industry REPORT HIGHLIGHTS
| Aspects | Details |
|---|---|
| Study Period | 2019-2033 |
| Base Year | 2024 |
| Estimated Year | 2025 |
| Forecast Period | 2025-2033 |
| Historical Period | 2019-2024 |
| Growth Rate | CAGR of 10.93% from 2019-2033 |
| Segmentation |
|
Table of Contents
- 1. Introduction
- 1.1. Research Scope
- 1.2. Market Segmentation
- 1.3. Research Methodology
- 1.4. Definitions and Assumptions
- 2. Executive Summary
- 2.1. Introduction
- 3. Market Dynamics
- 3.1. Introduction
- 3.2. Market Drivers
- 3.2.1. ; Improvement in worker productivity and decrease in worker injury; Increase in the development in IoT and connectivity technologies
- 3.3. Market Restrains
- 3.3.1. ; Growing concerns related to security of personal information; Stringent work regulations at operating facilities
- 3.4. Market Trends
- 3.4.1. The usage of Smart PPE in construction to witness a significant growth
- 4. Market Factor Analysis
- 4.1. Porters Five Forces
- 4.2. Supply/Value Chain
- 4.3. PESTEL analysis
- 4.4. Market Entropy
- 4.5. Patent/Trademark Analysis
- 5. Global Smart Personal Protective Equipment Industry Analysis, Insights and Forecast, 2019-2031
- 5.1. Market Analysis, Insights and Forecast - by Type
- 5.1.1. Eye and Face Protection
- 5.1.2. Hearing Protection
- 5.1.3. Head Protection
- 5.1.4. Fall Protection
- 5.1.5. Smart Clothing
- 5.1.6. Other Types
- 5.2. Market Analysis, Insights and Forecast - by End-user Industry
- 5.2.1. Construction
- 5.2.2. Mining
- 5.2.3. Oil and Gas
- 5.2.4. Manufacturing
- 5.2.5. Automotive
- 5.2.6. Other End-user Industries
- 5.3. Market Analysis, Insights and Forecast - by Region
- 5.3.1. North America
- 5.3.2. Europe
- 5.3.3. Asia
- 5.3.4. Australia and New Zealand
- 5.3.5. Latin America
- 5.3.6. Middle East and Africa
- 5.1. Market Analysis, Insights and Forecast - by Type
- 6. North America Smart Personal Protective Equipment Industry Analysis, Insights and Forecast, 2019-2031
- 6.1. Market Analysis, Insights and Forecast - by Type
- 6.1.1. Eye and Face Protection
- 6.1.2. Hearing Protection
- 6.1.3. Head Protection
- 6.1.4. Fall Protection
- 6.1.5. Smart Clothing
- 6.1.6. Other Types
- 6.2. Market Analysis, Insights and Forecast - by End-user Industry
- 6.2.1. Construction
- 6.2.2. Mining
- 6.2.3. Oil and Gas
- 6.2.4. Manufacturing
- 6.2.5. Automotive
- 6.2.6. Other End-user Industries
- 6.1. Market Analysis, Insights and Forecast - by Type
- 7. Europe Smart Personal Protective Equipment Industry Analysis, Insights and Forecast, 2019-2031
- 7.1. Market Analysis, Insights and Forecast - by Type
- 7.1.1. Eye and Face Protection
- 7.1.2. Hearing Protection
- 7.1.3. Head Protection
- 7.1.4. Fall Protection
- 7.1.5. Smart Clothing
- 7.1.6. Other Types
- 7.2. Market Analysis, Insights and Forecast - by End-user Industry
- 7.2.1. Construction
- 7.2.2. Mining
- 7.2.3. Oil and Gas
- 7.2.4. Manufacturing
- 7.2.5. Automotive
- 7.2.6. Other End-user Industries
- 7.1. Market Analysis, Insights and Forecast - by Type
- 8. Asia Smart Personal Protective Equipment Industry Analysis, Insights and Forecast, 2019-2031
- 8.1. Market Analysis, Insights and Forecast - by Type
- 8.1.1. Eye and Face Protection
- 8.1.2. Hearing Protection
- 8.1.3. Head Protection
- 8.1.4. Fall Protection
- 8.1.5. Smart Clothing
- 8.1.6. Other Types
- 8.2. Market Analysis, Insights and Forecast - by End-user Industry
- 8.2.1. Construction
- 8.2.2. Mining
- 8.2.3. Oil and Gas
- 8.2.4. Manufacturing
- 8.2.5. Automotive
- 8.2.6. Other End-user Industries
- 8.1. Market Analysis, Insights and Forecast - by Type
- 9. Australia and New Zealand Smart Personal Protective Equipment Industry Analysis, Insights and Forecast, 2019-2031
- 9.1. Market Analysis, Insights and Forecast - by Type
- 9.1.1. Eye and Face Protection
- 9.1.2. Hearing Protection
- 9.1.3. Head Protection
- 9.1.4. Fall Protection
- 9.1.5. Smart Clothing
- 9.1.6. Other Types
- 9.2. Market Analysis, Insights and Forecast - by End-user Industry
- 9.2.1. Construction
- 9.2.2. Mining
- 9.2.3. Oil and Gas
- 9.2.4. Manufacturing
- 9.2.5. Automotive
- 9.2.6. Other End-user Industries
- 9.1. Market Analysis, Insights and Forecast - by Type
- 10. Latin America Smart Personal Protective Equipment Industry Analysis, Insights and Forecast, 2019-2031
- 10.1. Market Analysis, Insights and Forecast - by Type
- 10.1.1. Eye and Face Protection
- 10.1.2. Hearing Protection
- 10.1.3. Head Protection
- 10.1.4. Fall Protection
- 10.1.5. Smart Clothing
- 10.1.6. Other Types
- 10.2. Market Analysis, Insights and Forecast - by End-user Industry
- 10.2.1. Construction
- 10.2.2. Mining
- 10.2.3. Oil and Gas
- 10.2.4. Manufacturing
- 10.2.5. Automotive
- 10.2.6. Other End-user Industries
- 10.1. Market Analysis, Insights and Forecast - by Type
- 11. Middle East and Africa Smart Personal Protective Equipment Industry Analysis, Insights and Forecast, 2019-2031
- 11.1. Market Analysis, Insights and Forecast - by Type
- 11.1.1. Eye and Face Protection
- 11.1.2. Hearing Protection
- 11.1.3. Head Protection
- 11.1.4. Fall Protection
- 11.1.5. Smart Clothing
- 11.1.6. Other Types
- 11.2. Market Analysis, Insights and Forecast - by End-user Industry
- 11.2.1. Construction
- 11.2.2. Mining
- 11.2.3. Oil and Gas
- 11.2.4. Manufacturing
- 11.2.5. Automotive
- 11.2.6. Other End-user Industries
- 11.1. Market Analysis, Insights and Forecast - by Type
- 12. North America Smart Personal Protective Equipment Industry Analysis, Insights and Forecast, 2019-2031
- 12.1. Market Analysis, Insights and Forecast - By Country/Sub-region
- 12.1.1 United States
- 12.1.2 Canada
- 12.1.3 Mexico
- 13. Europe Smart Personal Protective Equipment Industry Analysis, Insights and Forecast, 2019-2031
- 13.1. Market Analysis, Insights and Forecast - By Country/Sub-region
- 13.1.1 Germany
- 13.1.2 United Kingdom
- 13.1.3 France
- 13.1.4 Spain
- 13.1.5 Italy
- 13.1.6 Spain
- 13.1.7 Belgium
- 13.1.8 Netherland
- 13.1.9 Nordics
- 13.1.10 Rest of Europe
- 14. Asia Pacific Smart Personal Protective Equipment Industry Analysis, Insights and Forecast, 2019-2031
- 14.1. Market Analysis, Insights and Forecast - By Country/Sub-region
- 14.1.1 China
- 14.1.2 Japan
- 14.1.3 India
- 14.1.4 South Korea
- 14.1.5 Southeast Asia
- 14.1.6 Australia
- 14.1.7 Indonesia
- 14.1.8 Phillipes
- 14.1.9 Singapore
- 14.1.10 Thailandc
- 14.1.11 Rest of Asia Pacific
- 15. South America Smart Personal Protective Equipment Industry Analysis, Insights and Forecast, 2019-2031
- 15.1. Market Analysis, Insights and Forecast - By Country/Sub-region
- 15.1.1 Brazil
- 15.1.2 Argentina
- 15.1.3 Peru
- 15.1.4 Chile
- 15.1.5 Colombia
- 15.1.6 Ecuador
- 15.1.7 Venezuela
- 15.1.8 Rest of South America
- 16. North America Smart Personal Protective Equipment Industry Analysis, Insights and Forecast, 2019-2031
- 16.1. Market Analysis, Insights and Forecast - By Country/Sub-region
- 16.1.1 United States
- 16.1.2 Canada
- 16.1.3 Mexico
- 17. MEA Smart Personal Protective Equipment Industry Analysis, Insights and Forecast, 2019-2031
- 17.1. Market Analysis, Insights and Forecast - By Country/Sub-region
- 17.1.1 United Arab Emirates
- 17.1.2 Saudi Arabia
- 17.1.3 South Africa
- 17.1.4 Rest of Middle East and Africa
- 18. Competitive Analysis
- 18.1. Global Market Share Analysis 2024
- 18.2. Company Profiles
- 18.2.1 Honeywell International Inc
- 18.2.1.1. Overview
- 18.2.1.2. Products
- 18.2.1.3. SWOT Analysis
- 18.2.1.4. Recent Developments
- 18.2.1.5. Financials (Based on Availability)
- 18.2.2 Uvex Group
- 18.2.2.1. Overview
- 18.2.2.2. Products
- 18.2.2.3. SWOT Analysis
- 18.2.2.4. Recent Developments
- 18.2.2.5. Financials (Based on Availability)
- 18.2.3 IML Group PLC (Hazardex)
- 18.2.3.1. Overview
- 18.2.3.2. Products
- 18.2.3.3. SWOT Analysis
- 18.2.3.4. Recent Developments
- 18.2.3.5. Financials (Based on Availability)
- 18.2.4 3M Company
- 18.2.4.1. Overview
- 18.2.4.2. Products
- 18.2.4.3. SWOT Analysis
- 18.2.4.4. Recent Developments
- 18.2.4.5. Financials (Based on Availability)
- 18.2.5 Seebo Interactive LTD
- 18.2.5.1. Overview
- 18.2.5.2. Products
- 18.2.5.3. SWOT Analysis
- 18.2.5.4. Recent Developments
- 18.2.5.5. Financials (Based on Availability)
- 18.2.6 Tenacious Holdings Inc (dba Ergodyne)
- 18.2.6.1. Overview
- 18.2.6.2. Products
- 18.2.6.3. SWOT Analysis
- 18.2.6.4. Recent Developments
- 18.2.6.5. Financials (Based on Availability)
- 18.2.7 Intellinium
- 18.2.7.1. Overview
- 18.2.7.2. Products
- 18.2.7.3. SWOT Analysis
- 18.2.7.4. Recent Developments
- 18.2.7.5. Financials (Based on Availability)
- 18.2.8 Daqri
- 18.2.8.1. Overview
- 18.2.8.2. Products
- 18.2.8.3. SWOT Analysis
- 18.2.8.4. Recent Developments
- 18.2.8.5. Financials (Based on Availability)
- 18.2.9 Vuzix Corp*List Not Exhaustive
- 18.2.9.1. Overview
- 18.2.9.2. Products
- 18.2.9.3. SWOT Analysis
- 18.2.9.4. Recent Developments
- 18.2.9.5. Financials (Based on Availability)
- 18.2.10 Corvex Connected Worker
- 18.2.10.1. Overview
- 18.2.10.2. Products
- 18.2.10.3. SWOT Analysis
- 18.2.10.4. Recent Developments
- 18.2.10.5. Financials (Based on Availability)
- 18.2.1 Honeywell International Inc
List of Figures
- Figure 1: Global Smart Personal Protective Equipment Industry Revenue Breakdown (Million, %) by Region 2024 & 2032
- Figure 2: North America Smart Personal Protective Equipment Industry Revenue (Million), by Country 2024 & 2032
- Figure 3: North America Smart Personal Protective Equipment Industry Revenue Share (%), by Country 2024 & 2032
- Figure 4: Europe Smart Personal Protective Equipment Industry Revenue (Million), by Country 2024 & 2032
- Figure 5: Europe Smart Personal Protective Equipment Industry Revenue Share (%), by Country 2024 & 2032
- Figure 6: Asia Pacific Smart Personal Protective Equipment Industry Revenue (Million), by Country 2024 & 2032
- Figure 7: Asia Pacific Smart Personal Protective Equipment Industry Revenue Share (%), by Country 2024 & 2032
- Figure 8: South America Smart Personal Protective Equipment Industry Revenue (Million), by Country 2024 & 2032
- Figure 9: South America Smart Personal Protective Equipment Industry Revenue Share (%), by Country 2024 & 2032
- Figure 10: North America Smart Personal Protective Equipment Industry Revenue (Million), by Country 2024 & 2032
- Figure 11: North America Smart Personal Protective Equipment Industry Revenue Share (%), by Country 2024 & 2032
- Figure 12: MEA Smart Personal Protective Equipment Industry Revenue (Million), by Country 2024 & 2032
- Figure 13: MEA Smart Personal Protective Equipment Industry Revenue Share (%), by Country 2024 & 2032
- Figure 14: North America Smart Personal Protective Equipment Industry Revenue (Million), by Type 2024 & 2032
- Figure 15: North America Smart Personal Protective Equipment Industry Revenue Share (%), by Type 2024 & 2032
- Figure 16: North America Smart Personal Protective Equipment Industry Revenue (Million), by End-user Industry 2024 & 2032
- Figure 17: North America Smart Personal Protective Equipment Industry Revenue Share (%), by End-user Industry 2024 & 2032
- Figure 18: North America Smart Personal Protective Equipment Industry Revenue (Million), by Country 2024 & 2032
- Figure 19: North America Smart Personal Protective Equipment Industry Revenue Share (%), by Country 2024 & 2032
- Figure 20: Europe Smart Personal Protective Equipment Industry Revenue (Million), by Type 2024 & 2032
- Figure 21: Europe Smart Personal Protective Equipment Industry Revenue Share (%), by Type 2024 & 2032
- Figure 22: Europe Smart Personal Protective Equipment Industry Revenue (Million), by End-user Industry 2024 & 2032
- Figure 23: Europe Smart Personal Protective Equipment Industry Revenue Share (%), by End-user Industry 2024 & 2032
- Figure 24: Europe Smart Personal Protective Equipment Industry Revenue (Million), by Country 2024 & 2032
- Figure 25: Europe Smart Personal Protective Equipment Industry Revenue Share (%), by Country 2024 & 2032
- Figure 26: Asia Smart Personal Protective Equipment Industry Revenue (Million), by Type 2024 & 2032
- Figure 27: Asia Smart Personal Protective Equipment Industry Revenue Share (%), by Type 2024 & 2032
- Figure 28: Asia Smart Personal Protective Equipment Industry Revenue (Million), by End-user Industry 2024 & 2032
- Figure 29: Asia Smart Personal Protective Equipment Industry Revenue Share (%), by End-user Industry 2024 & 2032
- Figure 30: Asia Smart Personal Protective Equipment Industry Revenue (Million), by Country 2024 & 2032
- Figure 31: Asia Smart Personal Protective Equipment Industry Revenue Share (%), by Country 2024 & 2032
- Figure 32: Australia and New Zealand Smart Personal Protective Equipment Industry Revenue (Million), by Type 2024 & 2032
- Figure 33: Australia and New Zealand Smart Personal Protective Equipment Industry Revenue Share (%), by Type 2024 & 2032
- Figure 34: Australia and New Zealand Smart Personal Protective Equipment Industry Revenue (Million), by End-user Industry 2024 & 2032
- Figure 35: Australia and New Zealand Smart Personal Protective Equipment Industry Revenue Share (%), by End-user Industry 2024 & 2032
- Figure 36: Australia and New Zealand Smart Personal Protective Equipment Industry Revenue (Million), by Country 2024 & 2032
- Figure 37: Australia and New Zealand Smart Personal Protective Equipment Industry Revenue Share (%), by Country 2024 & 2032
- Figure 38: Latin America Smart Personal Protective Equipment Industry Revenue (Million), by Type 2024 & 2032
- Figure 39: Latin America Smart Personal Protective Equipment Industry Revenue Share (%), by Type 2024 & 2032
- Figure 40: Latin America Smart Personal Protective Equipment Industry Revenue (Million), by End-user Industry 2024 & 2032
- Figure 41: Latin America Smart Personal Protective Equipment Industry Revenue Share (%), by End-user Industry 2024 & 2032
- Figure 42: Latin America Smart Personal Protective Equipment Industry Revenue (Million), by Country 2024 & 2032
- Figure 43: Latin America Smart Personal Protective Equipment Industry Revenue Share (%), by Country 2024 & 2032
- Figure 44: Middle East and Africa Smart Personal Protective Equipment Industry Revenue (Million), by Type 2024 & 2032
- Figure 45: Middle East and Africa Smart Personal Protective Equipment Industry Revenue Share (%), by Type 2024 & 2032
- Figure 46: Middle East and Africa Smart Personal Protective Equipment Industry Revenue (Million), by End-user Industry 2024 & 2032
- Figure 47: Middle East and Africa Smart Personal Protective Equipment Industry Revenue Share (%), by End-user Industry 2024 & 2032
- Figure 48: Middle East and Africa Smart Personal Protective Equipment Industry Revenue (Million), by Country 2024 & 2032
- Figure 49: Middle East and Africa Smart Personal Protective Equipment Industry Revenue Share (%), by Country 2024 & 2032
List of Tables
- Table 1: Global Smart Personal Protective Equipment Industry Revenue Million Forecast, by Region 2019 & 2032
- Table 2: Global Smart Personal Protective Equipment Industry Revenue Million Forecast, by Type 2019 & 2032
- Table 3: Global Smart Personal Protective Equipment Industry Revenue Million Forecast, by End-user Industry 2019 & 2032
- Table 4: Global Smart Personal Protective Equipment Industry Revenue Million Forecast, by Region 2019 & 2032
- Table 5: Global Smart Personal Protective Equipment Industry Revenue Million Forecast, by Country 2019 & 2032
- Table 6: United States Smart Personal Protective Equipment Industry Revenue (Million) Forecast, by Application 2019 & 2032
- Table 7: Canada Smart Personal Protective Equipment Industry Revenue (Million) Forecast, by Application 2019 & 2032
- Table 8: Mexico Smart Personal Protective Equipment Industry Revenue (Million) Forecast, by Application 2019 & 2032
- Table 9: Global Smart Personal Protective Equipment Industry Revenue Million Forecast, by Country 2019 & 2032
- Table 10: Germany Smart Personal Protective Equipment Industry Revenue (Million) Forecast, by Application 2019 & 2032
- Table 11: United Kingdom Smart Personal Protective Equipment Industry Revenue (Million) Forecast, by Application 2019 & 2032
- Table 12: France Smart Personal Protective Equipment Industry Revenue (Million) Forecast, by Application 2019 & 2032
- Table 13: Spain Smart Personal Protective Equipment Industry Revenue (Million) Forecast, by Application 2019 & 2032
- Table 14: Italy Smart Personal Protective Equipment Industry Revenue (Million) Forecast, by Application 2019 & 2032
- Table 15: Spain Smart Personal Protective Equipment Industry Revenue (Million) Forecast, by Application 2019 & 2032
- Table 16: Belgium Smart Personal Protective Equipment Industry Revenue (Million) Forecast, by Application 2019 & 2032
- Table 17: Netherland Smart Personal Protective Equipment Industry Revenue (Million) Forecast, by Application 2019 & 2032
- Table 18: Nordics Smart Personal Protective Equipment Industry Revenue (Million) Forecast, by Application 2019 & 2032
- Table 19: Rest of Europe Smart Personal Protective Equipment Industry Revenue (Million) Forecast, by Application 2019 & 2032
- Table 20: Global Smart Personal Protective Equipment Industry Revenue Million Forecast, by Country 2019 & 2032
- Table 21: China Smart Personal Protective Equipment Industry Revenue (Million) Forecast, by Application 2019 & 2032
- Table 22: Japan Smart Personal Protective Equipment Industry Revenue (Million) Forecast, by Application 2019 & 2032
- Table 23: India Smart Personal Protective Equipment Industry Revenue (Million) Forecast, by Application 2019 & 2032
- Table 24: South Korea Smart Personal Protective Equipment Industry Revenue (Million) Forecast, by Application 2019 & 2032
- Table 25: Southeast Asia Smart Personal Protective Equipment Industry Revenue (Million) Forecast, by Application 2019 & 2032
- Table 26: Australia Smart Personal Protective Equipment Industry Revenue (Million) Forecast, by Application 2019 & 2032
- Table 27: Indonesia Smart Personal Protective Equipment Industry Revenue (Million) Forecast, by Application 2019 & 2032
- Table 28: Phillipes Smart Personal Protective Equipment Industry Revenue (Million) Forecast, by Application 2019 & 2032
- Table 29: Singapore Smart Personal Protective Equipment Industry Revenue (Million) Forecast, by Application 2019 & 2032
- Table 30: Thailandc Smart Personal Protective Equipment Industry Revenue (Million) Forecast, by Application 2019 & 2032
- Table 31: Rest of Asia Pacific Smart Personal Protective Equipment Industry Revenue (Million) Forecast, by Application 2019 & 2032
- Table 32: Global Smart Personal Protective Equipment Industry Revenue Million Forecast, by Country 2019 & 2032
- Table 33: Brazil Smart Personal Protective Equipment Industry Revenue (Million) Forecast, by Application 2019 & 2032
- Table 34: Argentina Smart Personal Protective Equipment Industry Revenue (Million) Forecast, by Application 2019 & 2032
- Table 35: Peru Smart Personal Protective Equipment Industry Revenue (Million) Forecast, by Application 2019 & 2032
- Table 36: Chile Smart Personal Protective Equipment Industry Revenue (Million) Forecast, by Application 2019 & 2032
- Table 37: Colombia Smart Personal Protective Equipment Industry Revenue (Million) Forecast, by Application 2019 & 2032
- Table 38: Ecuador Smart Personal Protective Equipment Industry Revenue (Million) Forecast, by Application 2019 & 2032
- Table 39: Venezuela Smart Personal Protective Equipment Industry Revenue (Million) Forecast, by Application 2019 & 2032
- Table 40: Rest of South America Smart Personal Protective Equipment Industry Revenue (Million) Forecast, by Application 2019 & 2032
- Table 41: Global Smart Personal Protective Equipment Industry Revenue Million Forecast, by Country 2019 & 2032
- Table 42: United States Smart Personal Protective Equipment Industry Revenue (Million) Forecast, by Application 2019 & 2032
- Table 43: Canada Smart Personal Protective Equipment Industry Revenue (Million) Forecast, by Application 2019 & 2032
- Table 44: Mexico Smart Personal Protective Equipment Industry Revenue (Million) Forecast, by Application 2019 & 2032
- Table 45: Global Smart Personal Protective Equipment Industry Revenue Million Forecast, by Country 2019 & 2032
- Table 46: United Arab Emirates Smart Personal Protective Equipment Industry Revenue (Million) Forecast, by Application 2019 & 2032
- Table 47: Saudi Arabia Smart Personal Protective Equipment Industry Revenue (Million) Forecast, by Application 2019 & 2032
- Table 48: South Africa Smart Personal Protective Equipment Industry Revenue (Million) Forecast, by Application 2019 & 2032
- Table 49: Rest of Middle East and Africa Smart Personal Protective Equipment Industry Revenue (Million) Forecast, by Application 2019 & 2032
- Table 50: Global Smart Personal Protective Equipment Industry Revenue Million Forecast, by Type 2019 & 2032
- Table 51: Global Smart Personal Protective Equipment Industry Revenue Million Forecast, by End-user Industry 2019 & 2032
- Table 52: Global Smart Personal Protective Equipment Industry Revenue Million Forecast, by Country 2019 & 2032
- Table 53: Global Smart Personal Protective Equipment Industry Revenue Million Forecast, by Type 2019 & 2032
- Table 54: Global Smart Personal Protective Equipment Industry Revenue Million Forecast, by End-user Industry 2019 & 2032
- Table 55: Global Smart Personal Protective Equipment Industry Revenue Million Forecast, by Country 2019 & 2032
- Table 56: Global Smart Personal Protective Equipment Industry Revenue Million Forecast, by Type 2019 & 2032
- Table 57: Global Smart Personal Protective Equipment Industry Revenue Million Forecast, by End-user Industry 2019 & 2032
- Table 58: Global Smart Personal Protective Equipment Industry Revenue Million Forecast, by Country 2019 & 2032
- Table 59: Global Smart Personal Protective Equipment Industry Revenue Million Forecast, by Type 2019 & 2032
- Table 60: Global Smart Personal Protective Equipment Industry Revenue Million Forecast, by End-user Industry 2019 & 2032
- Table 61: Global Smart Personal Protective Equipment Industry Revenue Million Forecast, by Country 2019 & 2032
- Table 62: Global Smart Personal Protective Equipment Industry Revenue Million Forecast, by Type 2019 & 2032
- Table 63: Global Smart Personal Protective Equipment Industry Revenue Million Forecast, by End-user Industry 2019 & 2032
- Table 64: Global Smart Personal Protective Equipment Industry Revenue Million Forecast, by Country 2019 & 2032
- Table 65: Global Smart Personal Protective Equipment Industry Revenue Million Forecast, by Type 2019 & 2032
- Table 66: Global Smart Personal Protective Equipment Industry Revenue Million Forecast, by End-user Industry 2019 & 2032
- Table 67: Global Smart Personal Protective Equipment Industry Revenue Million Forecast, by Country 2019 & 2032
Frequently Asked Questions
1. What is the projected Compound Annual Growth Rate (CAGR) of the Smart Personal Protective Equipment Industry?
The projected CAGR is approximately 10.93%.
2. Which companies are prominent players in the Smart Personal Protective Equipment Industry?
Key companies in the market include Honeywell International Inc, Uvex Group, IML Group PLC (Hazardex), 3M Company, Seebo Interactive LTD, Tenacious Holdings Inc (dba Ergodyne), Intellinium, Daqri, Vuzix Corp*List Not Exhaustive, Corvex Connected Worker.
3. What are the main segments of the Smart Personal Protective Equipment Industry?
The market segments include Type, End-user Industry.
4. Can you provide details about the market size?
The market size is estimated to be USD 24.90 Million as of 2022.
5. What are some drivers contributing to market growth?
; Improvement in worker productivity and decrease in worker injury; Increase in the development in IoT and connectivity technologies.
6. What are the notable trends driving market growth?
The usage of Smart PPE in construction to witness a significant growth.
7. Are there any restraints impacting market growth?
; Growing concerns related to security of personal information; Stringent work regulations at operating facilities.
8. Can you provide examples of recent developments in the market?
N/A
9. What pricing options are available for accessing the report?
Pricing options include single-user, multi-user, and enterprise licenses priced at USD 4750, USD 5250, and USD 8750 respectively.
10. Is the market size provided in terms of value or volume?
The market size is provided in terms of value, measured in Million.
11. Are there any specific market keywords associated with the report?
Yes, the market keyword associated with the report is "Smart Personal Protective Equipment Industry," which aids in identifying and referencing the specific market segment covered.
12. How do I determine which pricing option suits my needs best?
The pricing options vary based on user requirements and access needs. Individual users may opt for single-user licenses, while businesses requiring broader access may choose multi-user or enterprise licenses for cost-effective access to the report.
13. Are there any additional resources or data provided in the Smart Personal Protective Equipment Industry report?
While the report offers comprehensive insights, it's advisable to review the specific contents or supplementary materials provided to ascertain if additional resources or data are available.
14. How can I stay updated on further developments or reports in the Smart Personal Protective Equipment Industry?
To stay informed about further developments, trends, and reports in the Smart Personal Protective Equipment Industry, consider subscribing to industry newsletters, following relevant companies and organizations, or regularly checking reputable industry news sources and publications.
Methodology
Step 1 - Identification of Relevant Samples Size from Population Database


Step 2 - Approaches for Defining Global Market Size (Value, Volume* & Price*)

Note*: In applicable scenarios
Step 3 - Data Sources
Primary Research
- Web Analytics
- Survey Reports
- Research Institute
- Latest Research Reports
- Opinion Leaders
Secondary Research
- Annual Reports
- White Paper
- Latest Press Release
- Industry Association
- Paid Database
- Investor Presentations

Step 4 - Data Triangulation
Involves using different sources of information in order to increase the validity of a study
These sources are likely to be stakeholders in a program - participants, other researchers, program staff, other community members, and so on.
Then we put all data in single framework & apply various statistical tools to find out the dynamic on the market.
During the analysis stage, feedback from the stakeholder groups would be compared to determine areas of agreement as well as areas of divergence
