

Key Insights
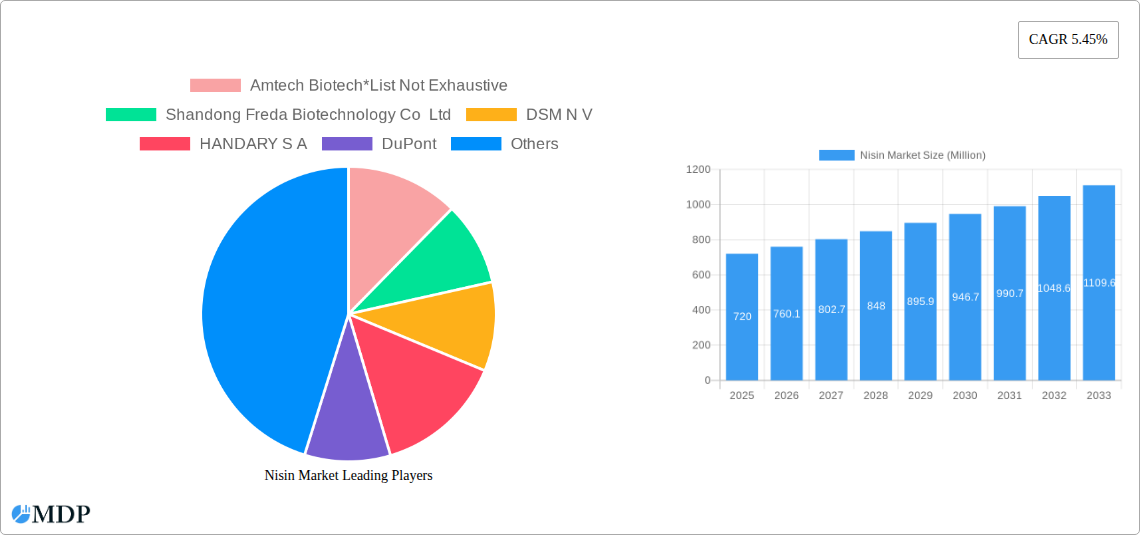
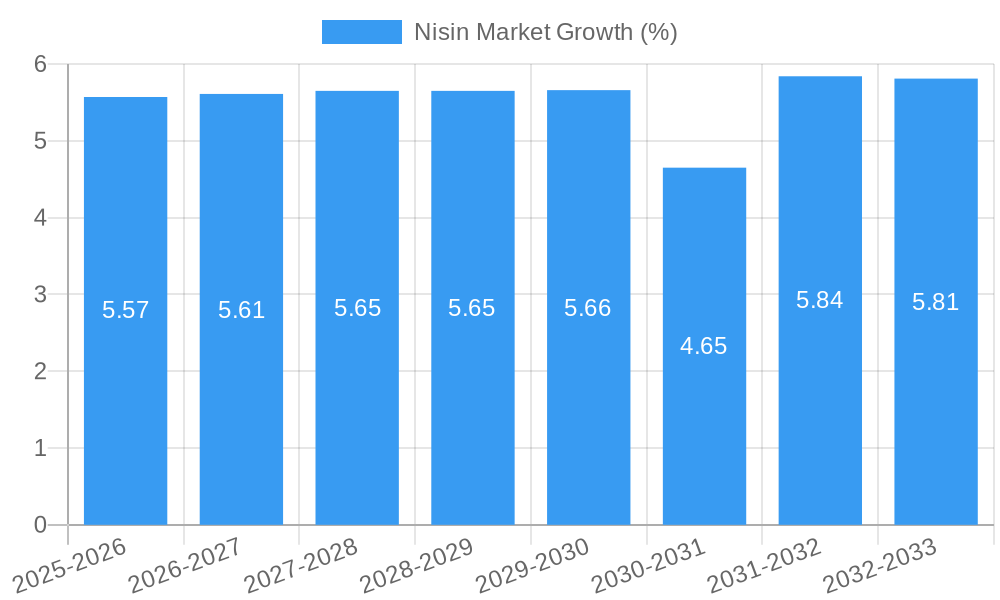
The global Nisin Market is projected to witness substantial growth, reaching an estimated market size of approximately $720 million in 2025. This expansion is fueled by a Compound Annual Growth Rate (CAGR) of 5.45% over the forecast period, indicating a robust and sustained upward trajectory. A primary driver for this growth is the increasing consumer demand for natural and safe food preservatives, a trend that directly benefits nisin, a naturally occurring bacteriocin with potent antimicrobial properties. Its efficacy in extending the shelf life of various food products, coupled with its recognition as a safe food additive (GRAS status in many regions), positions nisin as a preferred alternative to synthetic preservatives. The burgeoning processed food industry, driven by busy lifestyles and a desire for convenience, further propels nisin adoption. Applications in meat products, dairy, bakery, and canned goods are expected to dominate, reflecting the broad utility of nisin in safeguarding food integrity and quality.
The market landscape is characterized by evolving consumer preferences towards healthier and cleaner food labels, which significantly bolsters the demand for nisin. Furthermore, advancements in nisin production technologies, leading to improved yields and cost-effectiveness, are also contributing to market expansion. However, certain restraints may influence the market's pace. These could include stringent regulatory approvals in some developing nations and the availability of alternative natural preservatives. Despite these challenges, the overarching trend towards natural food preservation solutions, coupled with the expanding global food processing sector, paints a promising picture for the nisin market. Key players are actively investing in research and development to enhance nisin's application spectrum and production efficiency, aiming to capitalize on this growing global demand.
Nisin Market: Comprehensive Growth Analysis & Strategic Outlook (2019–2033)
This in-depth Nisin market report offers a comprehensive analysis of the global market, covering historical performance, current trends, and future projections from 2019 to 2033. With a base year of 2025, this study provides actionable insights for stakeholders looking to capitalize on the growing demand for natural food preservatives. The report meticulously examines market dynamics, industry trends, leading segments, product developments, growth drivers, challenges, emerging opportunities, and the competitive landscape.
Nisin Market Market Dynamics & Concentration
The Nisin market is characterized by a moderate to high level of concentration, with a few key players dominating global production and distribution. Leading companies such as DuPont, DSM N.V., and Shandong Freda Biotechnology Co Ltd hold significant market share, estimated to be over 60% combined. Innovation drivers are primarily focused on improving nisin production efficiency, developing new nisin variants with enhanced properties, and expanding its application spectrum. Regulatory frameworks, particularly those in the food and beverage industry, play a crucial role in market access and product approval, influencing the adoption of nisin as a safe and effective preservative. The increasing consumer demand for clean-label products and the phasing out of synthetic preservatives are significant end-user trends fueling nisin market growth. While direct substitutes for nisin are limited in their effectiveness as a natural antimicrobial agent, the availability of other natural preservatives and processing techniques like high-pressure processing (HPP) present indirect competition. Mergers and acquisitions (M&A) activities in the nisin market are sporadic but impactful, aimed at consolidating market positions and expanding technological capabilities. For instance, recent M&A deals have focused on acquiring companies with advanced fermentation technologies and novel application research. The market is poised for further consolidation as companies seek economies of scale and integrated value chains.
Nisin Market Industry Trends & Analysis
The global Nisin market is witnessing robust growth, driven by a confluence of evolving consumer preferences, stringent regulatory landscapes, and advancements in biotechnology. The increasing demand for natural and clean-label food products is a paramount growth driver, pushing manufacturers to substitute synthetic preservatives with naturally derived alternatives like nisin. This trend is particularly pronounced in developed economies where consumer awareness regarding food ingredients is high. Technological disruptions, including improved fermentation techniques and downstream processing, are enhancing nisin production efficiency and reducing costs, making it more accessible for a wider range of applications. The CAGR for the nisin market is projected to be around 7.5% during the forecast period. Market penetration of nisin is steadily increasing across various food categories, reflecting its efficacy as a broad-spectrum antimicrobial agent effective against a wide range of Gram-positive bacteria, including spoilage organisms and pathogens like Listeria monocytogenes. Consumer preferences are increasingly shifting towards minimally processed foods, which often require effective preservation methods, further bolstering the demand for nisin. Competitive dynamics are characterized by a focus on product quality, cost-competitiveness, and expanding application approvals. Companies are investing in research and development to discover novel applications and optimize existing ones, such as in dairy products, processed meats, and canned goods. The market's growth is also influenced by the global food safety regulations that favor naturally derived preservatives, creating a favorable environment for nisin's adoption. The increasing prevalence of foodborne illnesses and the growing emphasis on food security further underscore the importance of effective preservation solutions like nisin. The industry is also observing a trend towards specialized nisin formulations tailored for specific food matrices and processing conditions.
Leading Markets & Segments in Nisin Market
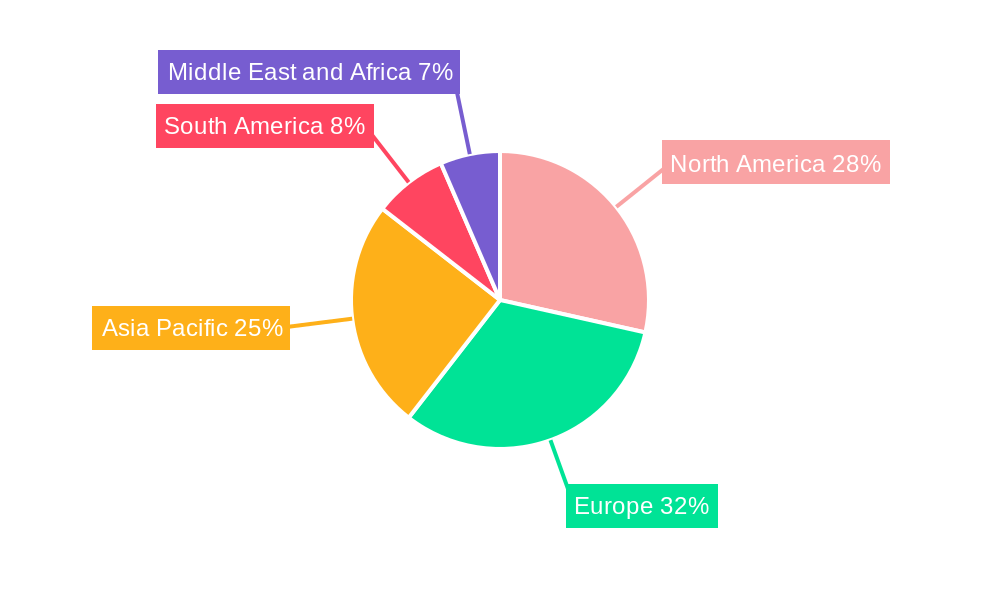
The Nisin market exhibits significant regional variations and segment-specific dominance, driven by a complex interplay of economic policies, consumer demands, and regulatory environments. North America and Europe currently represent the leading markets for nisin, owing to their well-established food processing industries, high consumer awareness of food ingredients, and stringent food safety regulations that favor natural preservatives. Within these regions, the United States and Germany are key country markets. The Meat segment is a dominant application, accounting for an estimated 35% of the total market share. This dominance is attributed to the meat industry's constant need for effective preservation to prevent spoilage and extend shelf life, especially for processed meat products.
Meat Application Dominance:
- Key Drivers: Stringent food safety regulations, consumer demand for extended shelf life in processed meats, and the efficacy of nisin against spoilage bacteria like Clostridium species. Economic policies supporting food safety standards also play a crucial role.
- Detailed Analysis: The meat industry's large scale and the inherent perishability of its products create a substantial and consistent demand for preservatives. Nisin's ability to inhibit the growth of pathogens and spoilage microorganisms in products such as sausages, ham, and ready-to-eat meat meals makes it an indispensable ingredient. Infrastructure supporting cold chain logistics further amplifies the need for reliable preservation methods.
Dairy Product Segment Growth:
- Key Drivers: Growing demand for natural preservatives in cheese, yogurt, and other dairy products; increasing focus on extending the shelf life of dairy items without compromising taste or texture.
- Detailed Analysis: Nisin is highly effective in preventing the growth of Lactobacillus and other spoilage bacteria in dairy products, contributing to product quality and safety.
Bakery Product Segment Potential:
- Key Drivers: Rising demand for minimally processed baked goods and the need to prevent mold growth in bread and pastries.
- Detailed Analysis: Nisin offers a natural solution to extend the shelf life of bakery products, appealing to consumers seeking cleaner ingredient labels.
Canned Product Application:
- Key Drivers: The inherent need for long-term preservation in canned foods, where nisin can complement thermal processing to enhance microbial stability.
- Detailed Analysis: Nisin aids in reducing the heat treatment required for canning, thus preserving the nutritional value and sensory qualities of the food.
Beverage and Others Segments: While smaller, these segments are showing significant growth potential driven by innovation in beverage formulations and the exploration of nisin in niche food applications.
Nisin Market Product Developments
Product developments in the Nisin market are largely focused on enhancing its efficacy, expanding its application range, and optimizing production processes. Companies are investing in research to develop nisin variants with improved thermostability and broader antimicrobial spectrum. Innovations include the development of nisin formulations that are easier to incorporate into different food matrices, such as microencapsulated nisin for controlled release. The competitive advantage lies in offering cost-effective, natural preservation solutions that meet evolving consumer demands for clean labels and food safety. Technological advancements in fermentation and purification are leading to higher purity nisin and reduced production costs, making it a more attractive option for food manufacturers across diverse applications.
Key Drivers of Nisin Market Growth
The Nisin market's expansion is propelled by several key drivers, predominantly centered on consumer demand for natural and clean-label food products. This fundamental shift in consumer preference is compelling food manufacturers to actively seek alternatives to synthetic preservatives, with nisin emerging as a prime candidate due to its natural origin and proven efficacy. Regulatory bodies worldwide are increasingly scrutinizing and sometimes restricting the use of artificial food additives, further creating a favorable environment for nisin adoption. Furthermore, advancements in biotechnology have led to more efficient and cost-effective nisin production methods, reducing manufacturing costs and making it more accessible for widespread use. The growing global concern for food safety and the prevention of foodborne illnesses also significantly contributes to nisin's demand, as it effectively inhibits the growth of a wide range of spoilage microorganisms and pathogens.
Challenges in the Nisin Market Market
Despite its promising growth trajectory, the Nisin market faces several challenges that could impede its full potential. Regulatory hurdles, although generally favorable for natural preservatives, can still involve complex approval processes for specific applications and regions, potentially delaying market entry. Supply chain issues, including the availability of raw materials for fermentation and the logistical complexities of distributing a sensitive biopreservative, can impact production costs and reliability. Competitive pressures from other natural preservatives and innovative food processing technologies, such as high-pressure processing (HPP), also pose a challenge, requiring nisin manufacturers to continuously demonstrate their product's superior value proposition. The cost of production, while decreasing, can still be higher than some synthetic alternatives, presenting a barrier for price-sensitive segments.
Emerging Opportunities in Nisin Market
Emerging opportunities in the Nisin market are primarily driven by technological breakthroughs and strategic market expansion. The development of novel fermentation techniques and genetic engineering approaches promises to enhance nisin yields and introduce customized nisin variants with tailored functionalities, expanding its application scope. Strategic partnerships between nisin producers and food manufacturers are crucial for co-developing innovative applications and accelerating market adoption. Furthermore, exploring untapped geographical markets, particularly in developing economies where awareness of natural preservatives is growing, presents significant long-term growth potential. The increasing focus on personalized nutrition and functional foods also opens avenues for nisin's integration into specialized product formulations.
Leading Players in the Nisin Market Sector
- Amtech Biotech
- Shandong Freda Biotechnology Co Ltd
- DSM N V
- HANDARY S A
- DuPont
- Galactic
- Mayasan Biotech
- SIVEELE B V
- Chihon Biotechnology Co Ltd
- Cayman Chemical
Key Milestones in Nisin Market Industry
- 2019: Increased research into nisin's efficacy against emerging foodborne pathogens.
- 2020: Growing consumer demand for "natural" and "clean label" products boosts nisin market visibility.
- 2021: Advancements in fermentation technology lead to more efficient nisin production.
- 2022: Expansion of nisin applications into novel food categories beyond traditional uses.
- 2023: Strategic partnerships formed to explore new nisin formulations and delivery systems.
- 2024: Increased regulatory approvals for nisin in various processed food applications globally.
- 2025 (Projected): Continued market growth driven by sustained consumer preference for natural ingredients.
- 2026-2033 (Projected): Anticipated market expansion into emerging economies and development of advanced nisin derivatives.
Strategic Outlook for Nisin Market Market
The strategic outlook for the Nisin market is overwhelmingly positive, driven by sustainable consumer demand for natural food preservation solutions. Growth accelerators include ongoing investments in R&D to unlock novel applications and improve production efficiencies, making nisin more competitive. Strategic alliances and collaborations will be pivotal in expanding market reach and co-creating innovative food products. The market's future potential is further bolstered by the continuous evolution of food safety regulations favoring natural alternatives. By focusing on product innovation, cost optimization, and market education, stakeholders can effectively capitalize on the expanding opportunities and secure a significant share in this dynamic market.
Nisin Market Segmentation
-
1. Application
- 1.1. Meat
- 1.2. Beverage
- 1.3. Bakery Product
- 1.4. Canned Product
- 1.5. Dairy Product
- 1.6. Others
Nisin Market Segmentation By Geography
-
1. North America
- 1.1. United States
- 1.2. Canada
- 1.3. Mexico
- 1.4. Rest of North America
-
2. Europe
- 2.1. United Kingdom
- 2.2. Germany
- 2.3. France
- 2.4. Russia
- 2.5. Italy
- 2.6. Spain
- 2.7. Rest of Europe
-
3. Asia Pacific
- 3.1. India
- 3.2. China
- 3.3. Japan
- 3.4. Australia
- 3.5. Rest of Asia Pacific
-
4. South America
- 4.1. Brazil
- 4.2. Argentina
- 4.3. Rest of South America
-
5. Middle East and Africa
- 5.1. South Africa
- 5.2. Saudi Arabia
- 5.3. Rest of Middle East and Africa
Nisin Market REPORT HIGHLIGHTS
| Aspects | Details |
|---|---|
| Study Period | 2019-2033 |
| Base Year | 2024 |
| Estimated Year | 2025 |
| Forecast Period | 2025-2033 |
| Historical Period | 2019-2024 |
| Growth Rate | CAGR of 5.45% from 2019-2033 |
| Segmentation |
|
Table of Contents
- 1. Introduction
- 1.1. Research Scope
- 1.2. Market Segmentation
- 1.3. Research Methodology
- 1.4. Definitions and Assumptions
- 2. Executive Summary
- 2.1. Introduction
- 3. Market Dynamics
- 3.1. Introduction
- 3.2. Market Drivers
- 3.2.1. Increasing Demand for Clean Label Bakery Products; Increasing Popularity of Specialty Ingredients
- 3.3. Market Restrains
- 3.3.1. Risk of Allergies
- 3.4. Market Trends
- 3.4.1. Growing Inclination Toward Clean Label Products
- 4. Market Factor Analysis
- 4.1. Porters Five Forces
- 4.2. Supply/Value Chain
- 4.3. PESTEL analysis
- 4.4. Market Entropy
- 4.5. Patent/Trademark Analysis
- 5. Global Nisin Market Analysis, Insights and Forecast, 2019-2031
- 5.1. Market Analysis, Insights and Forecast - by Application
- 5.1.1. Meat
- 5.1.2. Beverage
- 5.1.3. Bakery Product
- 5.1.4. Canned Product
- 5.1.5. Dairy Product
- 5.1.6. Others
- 5.2. Market Analysis, Insights and Forecast - by Region
- 5.2.1. North America
- 5.2.2. Europe
- 5.2.3. Asia Pacific
- 5.2.4. South America
- 5.2.5. Middle East and Africa
- 5.1. Market Analysis, Insights and Forecast - by Application
- 6. North America Nisin Market Analysis, Insights and Forecast, 2019-2031
- 6.1. Market Analysis, Insights and Forecast - by Application
- 6.1.1. Meat
- 6.1.2. Beverage
- 6.1.3. Bakery Product
- 6.1.4. Canned Product
- 6.1.5. Dairy Product
- 6.1.6. Others
- 6.1. Market Analysis, Insights and Forecast - by Application
- 7. Europe Nisin Market Analysis, Insights and Forecast, 2019-2031
- 7.1. Market Analysis, Insights and Forecast - by Application
- 7.1.1. Meat
- 7.1.2. Beverage
- 7.1.3. Bakery Product
- 7.1.4. Canned Product
- 7.1.5. Dairy Product
- 7.1.6. Others
- 7.1. Market Analysis, Insights and Forecast - by Application
- 8. Asia Pacific Nisin Market Analysis, Insights and Forecast, 2019-2031
- 8.1. Market Analysis, Insights and Forecast - by Application
- 8.1.1. Meat
- 8.1.2. Beverage
- 8.1.3. Bakery Product
- 8.1.4. Canned Product
- 8.1.5. Dairy Product
- 8.1.6. Others
- 8.1. Market Analysis, Insights and Forecast - by Application
- 9. South America Nisin Market Analysis, Insights and Forecast, 2019-2031
- 9.1. Market Analysis, Insights and Forecast - by Application
- 9.1.1. Meat
- 9.1.2. Beverage
- 9.1.3. Bakery Product
- 9.1.4. Canned Product
- 9.1.5. Dairy Product
- 9.1.6. Others
- 9.1. Market Analysis, Insights and Forecast - by Application
- 10. Middle East and Africa Nisin Market Analysis, Insights and Forecast, 2019-2031
- 10.1. Market Analysis, Insights and Forecast - by Application
- 10.1.1. Meat
- 10.1.2. Beverage
- 10.1.3. Bakery Product
- 10.1.4. Canned Product
- 10.1.5. Dairy Product
- 10.1.6. Others
- 10.1. Market Analysis, Insights and Forecast - by Application
- 11. North America Nisin Market Analysis, Insights and Forecast, 2019-2031
- 11.1. Market Analysis, Insights and Forecast - By Country/Sub-region
- 11.1.1 United States
- 11.1.2 Canada
- 11.1.3 Mexico
- 11.1.4 Rest of North America
- 12. Europe Nisin Market Analysis, Insights and Forecast, 2019-2031
- 12.1. Market Analysis, Insights and Forecast - By Country/Sub-region
- 12.1.1 United Kingdom
- 12.1.2 Germany
- 12.1.3 France
- 12.1.4 Russia
- 12.1.5 Italy
- 12.1.6 Spain
- 12.1.7 Rest of Europe
- 13. Asia Pacific Nisin Market Analysis, Insights and Forecast, 2019-2031
- 13.1. Market Analysis, Insights and Forecast - By Country/Sub-region
- 13.1.1 India
- 13.1.2 China
- 13.1.3 Japan
- 13.1.4 Australia
- 13.1.5 Rest of Asia Pacific
- 14. South America Nisin Market Analysis, Insights and Forecast, 2019-2031
- 14.1. Market Analysis, Insights and Forecast - By Country/Sub-region
- 14.1.1 Brazil
- 14.1.2 Argentina
- 14.1.3 Rest of South America
- 15. Middle East and Africa Nisin Market Analysis, Insights and Forecast, 2019-2031
- 15.1. Market Analysis, Insights and Forecast - By Country/Sub-region
- 15.1.1 South Africa
- 15.1.2 Saudi Arabia
- 15.1.3 Rest of Middle East and Africa
- 16. Competitive Analysis
- 16.1. Global Market Share Analysis 2024
- 16.2. Company Profiles
- 16.2.1 Amtech Biotech*List Not Exhaustive
- 16.2.1.1. Overview
- 16.2.1.2. Products
- 16.2.1.3. SWOT Analysis
- 16.2.1.4. Recent Developments
- 16.2.1.5. Financials (Based on Availability)
- 16.2.2 Shandong Freda Biotechnology Co Ltd
- 16.2.2.1. Overview
- 16.2.2.2. Products
- 16.2.2.3. SWOT Analysis
- 16.2.2.4. Recent Developments
- 16.2.2.5. Financials (Based on Availability)
- 16.2.3 DSM N V
- 16.2.3.1. Overview
- 16.2.3.2. Products
- 16.2.3.3. SWOT Analysis
- 16.2.3.4. Recent Developments
- 16.2.3.5. Financials (Based on Availability)
- 16.2.4 HANDARY S A
- 16.2.4.1. Overview
- 16.2.4.2. Products
- 16.2.4.3. SWOT Analysis
- 16.2.4.4. Recent Developments
- 16.2.4.5. Financials (Based on Availability)
- 16.2.5 DuPont
- 16.2.5.1. Overview
- 16.2.5.2. Products
- 16.2.5.3. SWOT Analysis
- 16.2.5.4. Recent Developments
- 16.2.5.5. Financials (Based on Availability)
- 16.2.6 Galactic
- 16.2.6.1. Overview
- 16.2.6.2. Products
- 16.2.6.3. SWOT Analysis
- 16.2.6.4. Recent Developments
- 16.2.6.5. Financials (Based on Availability)
- 16.2.7 Mayasan Biotech
- 16.2.7.1. Overview
- 16.2.7.2. Products
- 16.2.7.3. SWOT Analysis
- 16.2.7.4. Recent Developments
- 16.2.7.5. Financials (Based on Availability)
- 16.2.8 SIVEELE B V
- 16.2.8.1. Overview
- 16.2.8.2. Products
- 16.2.8.3. SWOT Analysis
- 16.2.8.4. Recent Developments
- 16.2.8.5. Financials (Based on Availability)
- 16.2.9 Chihon Biotechnology Co Ltd
- 16.2.9.1. Overview
- 16.2.9.2. Products
- 16.2.9.3. SWOT Analysis
- 16.2.9.4. Recent Developments
- 16.2.9.5. Financials (Based on Availability)
- 16.2.10 Cayman Chemical
- 16.2.10.1. Overview
- 16.2.10.2. Products
- 16.2.10.3. SWOT Analysis
- 16.2.10.4. Recent Developments
- 16.2.10.5. Financials (Based on Availability)
- 16.2.1 Amtech Biotech*List Not Exhaustive
List of Figures
- Figure 1: Global Nisin Market Revenue Breakdown (Million, %) by Region 2024 & 2032
- Figure 2: North America Nisin Market Revenue (Million), by Country 2024 & 2032
- Figure 3: North America Nisin Market Revenue Share (%), by Country 2024 & 2032
- Figure 4: Europe Nisin Market Revenue (Million), by Country 2024 & 2032
- Figure 5: Europe Nisin Market Revenue Share (%), by Country 2024 & 2032
- Figure 6: Asia Pacific Nisin Market Revenue (Million), by Country 2024 & 2032
- Figure 7: Asia Pacific Nisin Market Revenue Share (%), by Country 2024 & 2032
- Figure 8: South America Nisin Market Revenue (Million), by Country 2024 & 2032
- Figure 9: South America Nisin Market Revenue Share (%), by Country 2024 & 2032
- Figure 10: Middle East and Africa Nisin Market Revenue (Million), by Country 2024 & 2032
- Figure 11: Middle East and Africa Nisin Market Revenue Share (%), by Country 2024 & 2032
- Figure 12: North America Nisin Market Revenue (Million), by Application 2024 & 2032
- Figure 13: North America Nisin Market Revenue Share (%), by Application 2024 & 2032
- Figure 14: North America Nisin Market Revenue (Million), by Country 2024 & 2032
- Figure 15: North America Nisin Market Revenue Share (%), by Country 2024 & 2032
- Figure 16: Europe Nisin Market Revenue (Million), by Application 2024 & 2032
- Figure 17: Europe Nisin Market Revenue Share (%), by Application 2024 & 2032
- Figure 18: Europe Nisin Market Revenue (Million), by Country 2024 & 2032
- Figure 19: Europe Nisin Market Revenue Share (%), by Country 2024 & 2032
- Figure 20: Asia Pacific Nisin Market Revenue (Million), by Application 2024 & 2032
- Figure 21: Asia Pacific Nisin Market Revenue Share (%), by Application 2024 & 2032
- Figure 22: Asia Pacific Nisin Market Revenue (Million), by Country 2024 & 2032
- Figure 23: Asia Pacific Nisin Market Revenue Share (%), by Country 2024 & 2032
- Figure 24: South America Nisin Market Revenue (Million), by Application 2024 & 2032
- Figure 25: South America Nisin Market Revenue Share (%), by Application 2024 & 2032
- Figure 26: South America Nisin Market Revenue (Million), by Country 2024 & 2032
- Figure 27: South America Nisin Market Revenue Share (%), by Country 2024 & 2032
- Figure 28: Middle East and Africa Nisin Market Revenue (Million), by Application 2024 & 2032
- Figure 29: Middle East and Africa Nisin Market Revenue Share (%), by Application 2024 & 2032
- Figure 30: Middle East and Africa Nisin Market Revenue (Million), by Country 2024 & 2032
- Figure 31: Middle East and Africa Nisin Market Revenue Share (%), by Country 2024 & 2032
List of Tables
- Table 1: Global Nisin Market Revenue Million Forecast, by Region 2019 & 2032
- Table 2: Global Nisin Market Revenue Million Forecast, by Application 2019 & 2032
- Table 3: Global Nisin Market Revenue Million Forecast, by Region 2019 & 2032
- Table 4: Global Nisin Market Revenue Million Forecast, by Country 2019 & 2032
- Table 5: United States Nisin Market Revenue (Million) Forecast, by Application 2019 & 2032
- Table 6: Canada Nisin Market Revenue (Million) Forecast, by Application 2019 & 2032
- Table 7: Mexico Nisin Market Revenue (Million) Forecast, by Application 2019 & 2032
- Table 8: Rest of North America Nisin Market Revenue (Million) Forecast, by Application 2019 & 2032
- Table 9: Global Nisin Market Revenue Million Forecast, by Country 2019 & 2032
- Table 10: United Kingdom Nisin Market Revenue (Million) Forecast, by Application 2019 & 2032
- Table 11: Germany Nisin Market Revenue (Million) Forecast, by Application 2019 & 2032
- Table 12: France Nisin Market Revenue (Million) Forecast, by Application 2019 & 2032
- Table 13: Russia Nisin Market Revenue (Million) Forecast, by Application 2019 & 2032
- Table 14: Italy Nisin Market Revenue (Million) Forecast, by Application 2019 & 2032
- Table 15: Spain Nisin Market Revenue (Million) Forecast, by Application 2019 & 2032
- Table 16: Rest of Europe Nisin Market Revenue (Million) Forecast, by Application 2019 & 2032
- Table 17: Global Nisin Market Revenue Million Forecast, by Country 2019 & 2032
- Table 18: India Nisin Market Revenue (Million) Forecast, by Application 2019 & 2032
- Table 19: China Nisin Market Revenue (Million) Forecast, by Application 2019 & 2032
- Table 20: Japan Nisin Market Revenue (Million) Forecast, by Application 2019 & 2032
- Table 21: Australia Nisin Market Revenue (Million) Forecast, by Application 2019 & 2032
- Table 22: Rest of Asia Pacific Nisin Market Revenue (Million) Forecast, by Application 2019 & 2032
- Table 23: Global Nisin Market Revenue Million Forecast, by Country 2019 & 2032
- Table 24: Brazil Nisin Market Revenue (Million) Forecast, by Application 2019 & 2032
- Table 25: Argentina Nisin Market Revenue (Million) Forecast, by Application 2019 & 2032
- Table 26: Rest of South America Nisin Market Revenue (Million) Forecast, by Application 2019 & 2032
- Table 27: Global Nisin Market Revenue Million Forecast, by Country 2019 & 2032
- Table 28: South Africa Nisin Market Revenue (Million) Forecast, by Application 2019 & 2032
- Table 29: Saudi Arabia Nisin Market Revenue (Million) Forecast, by Application 2019 & 2032
- Table 30: Rest of Middle East and Africa Nisin Market Revenue (Million) Forecast, by Application 2019 & 2032
- Table 31: Global Nisin Market Revenue Million Forecast, by Application 2019 & 2032
- Table 32: Global Nisin Market Revenue Million Forecast, by Country 2019 & 2032
- Table 33: United States Nisin Market Revenue (Million) Forecast, by Application 2019 & 2032
- Table 34: Canada Nisin Market Revenue (Million) Forecast, by Application 2019 & 2032
- Table 35: Mexico Nisin Market Revenue (Million) Forecast, by Application 2019 & 2032
- Table 36: Rest of North America Nisin Market Revenue (Million) Forecast, by Application 2019 & 2032
- Table 37: Global Nisin Market Revenue Million Forecast, by Application 2019 & 2032
- Table 38: Global Nisin Market Revenue Million Forecast, by Country 2019 & 2032
- Table 39: United Kingdom Nisin Market Revenue (Million) Forecast, by Application 2019 & 2032
- Table 40: Germany Nisin Market Revenue (Million) Forecast, by Application 2019 & 2032
- Table 41: France Nisin Market Revenue (Million) Forecast, by Application 2019 & 2032
- Table 42: Russia Nisin Market Revenue (Million) Forecast, by Application 2019 & 2032
- Table 43: Italy Nisin Market Revenue (Million) Forecast, by Application 2019 & 2032
- Table 44: Spain Nisin Market Revenue (Million) Forecast, by Application 2019 & 2032
- Table 45: Rest of Europe Nisin Market Revenue (Million) Forecast, by Application 2019 & 2032
- Table 46: Global Nisin Market Revenue Million Forecast, by Application 2019 & 2032
- Table 47: Global Nisin Market Revenue Million Forecast, by Country 2019 & 2032
- Table 48: India Nisin Market Revenue (Million) Forecast, by Application 2019 & 2032
- Table 49: China Nisin Market Revenue (Million) Forecast, by Application 2019 & 2032
- Table 50: Japan Nisin Market Revenue (Million) Forecast, by Application 2019 & 2032
- Table 51: Australia Nisin Market Revenue (Million) Forecast, by Application 2019 & 2032
- Table 52: Rest of Asia Pacific Nisin Market Revenue (Million) Forecast, by Application 2019 & 2032
- Table 53: Global Nisin Market Revenue Million Forecast, by Application 2019 & 2032
- Table 54: Global Nisin Market Revenue Million Forecast, by Country 2019 & 2032
- Table 55: Brazil Nisin Market Revenue (Million) Forecast, by Application 2019 & 2032
- Table 56: Argentina Nisin Market Revenue (Million) Forecast, by Application 2019 & 2032
- Table 57: Rest of South America Nisin Market Revenue (Million) Forecast, by Application 2019 & 2032
- Table 58: Global Nisin Market Revenue Million Forecast, by Application 2019 & 2032
- Table 59: Global Nisin Market Revenue Million Forecast, by Country 2019 & 2032
- Table 60: South Africa Nisin Market Revenue (Million) Forecast, by Application 2019 & 2032
- Table 61: Saudi Arabia Nisin Market Revenue (Million) Forecast, by Application 2019 & 2032
- Table 62: Rest of Middle East and Africa Nisin Market Revenue (Million) Forecast, by Application 2019 & 2032
Frequently Asked Questions
1. What is the projected Compound Annual Growth Rate (CAGR) of the Nisin Market?
The projected CAGR is approximately 5.45%.
2. Which companies are prominent players in the Nisin Market?
Key companies in the market include Amtech Biotech*List Not Exhaustive, Shandong Freda Biotechnology Co Ltd, DSM N V, HANDARY S A, DuPont, Galactic, Mayasan Biotech, SIVEELE B V, Chihon Biotechnology Co Ltd, Cayman Chemical.
3. What are the main segments of the Nisin Market?
The market segments include Application.
4. Can you provide details about the market size?
The market size is estimated to be USD XX Million as of 2022.
5. What are some drivers contributing to market growth?
Increasing Demand for Clean Label Bakery Products; Increasing Popularity of Specialty Ingredients.
6. What are the notable trends driving market growth?
Growing Inclination Toward Clean Label Products.
7. Are there any restraints impacting market growth?
Risk of Allergies.
8. Can you provide examples of recent developments in the market?
N/A
9. What pricing options are available for accessing the report?
Pricing options include single-user, multi-user, and enterprise licenses priced at USD 4750, USD 5250, and USD 8750 respectively.
10. Is the market size provided in terms of value or volume?
The market size is provided in terms of value, measured in Million.
11. Are there any specific market keywords associated with the report?
Yes, the market keyword associated with the report is "Nisin Market," which aids in identifying and referencing the specific market segment covered.
12. How do I determine which pricing option suits my needs best?
The pricing options vary based on user requirements and access needs. Individual users may opt for single-user licenses, while businesses requiring broader access may choose multi-user or enterprise licenses for cost-effective access to the report.
13. Are there any additional resources or data provided in the Nisin Market report?
While the report offers comprehensive insights, it's advisable to review the specific contents or supplementary materials provided to ascertain if additional resources or data are available.
14. How can I stay updated on further developments or reports in the Nisin Market?
To stay informed about further developments, trends, and reports in the Nisin Market, consider subscribing to industry newsletters, following relevant companies and organizations, or regularly checking reputable industry news sources and publications.
Methodology
Step 1 - Identification of Relevant Samples Size from Population Database


Step 2 - Approaches for Defining Global Market Size (Value, Volume* & Price*)

Note*: In applicable scenarios
Step 3 - Data Sources
Primary Research
- Web Analytics
- Survey Reports
- Research Institute
- Latest Research Reports
- Opinion Leaders
Secondary Research
- Annual Reports
- White Paper
- Latest Press Release
- Industry Association
- Paid Database
- Investor Presentations

Step 4 - Data Triangulation
Involves using different sources of information in order to increase the validity of a study
These sources are likely to be stakeholders in a program - participants, other researchers, program staff, other community members, and so on.
Then we put all data in single framework & apply various statistical tools to find out the dynamic on the market.
During the analysis stage, feedback from the stakeholder groups would be compared to determine areas of agreement as well as areas of divergence
