

Key Insights
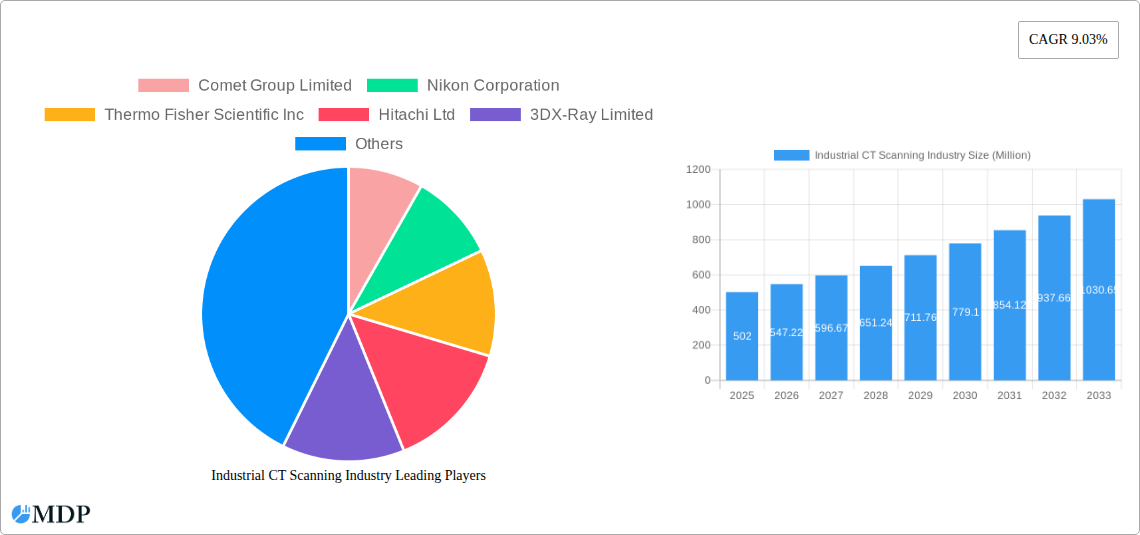
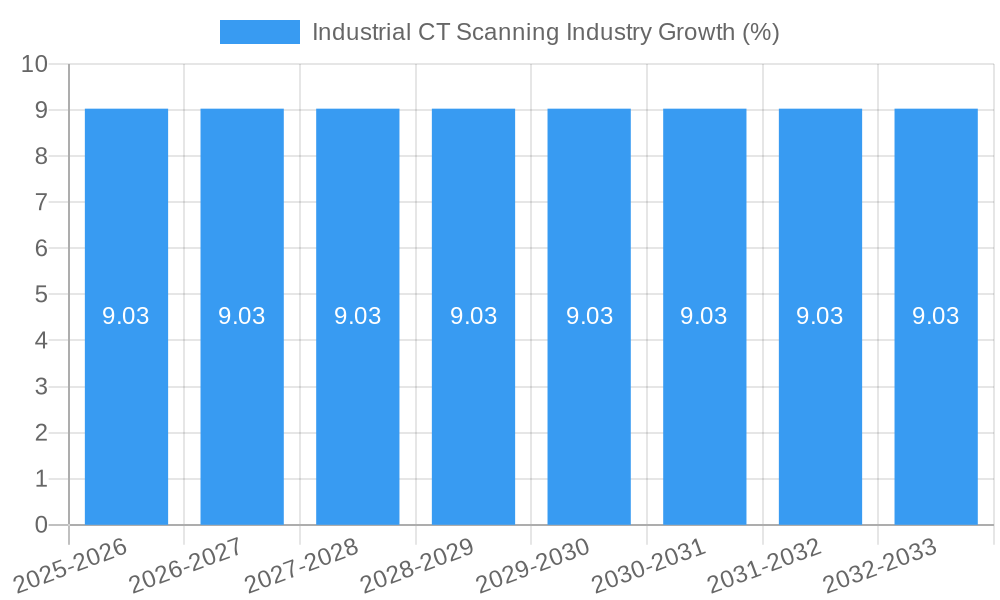
The global Industrial CT Scanning industry is poised for robust growth, currently valued at an estimated $502.00 million. This sector is projected to expand at a significant Compound Annual Growth Rate (CAGR) of 9.03% from 2019 to 2033, indicating a dynamic and expanding market. This upward trajectory is primarily fueled by the escalating demand for advanced quality control and non-destructive testing (NDT) solutions across a spectrum of critical industries. The aerospace and defense sector, with its stringent safety and performance requirements, is a major driver, alongside the rapidly evolving automotive industry's need for precise component analysis and the electronics sector's pursuit of miniaturization and defect identification. Furthermore, the oil and gas industry relies on industrial CT scanning for integrity assessment and failure analysis of complex infrastructure. The "Flaw Detection and Inspection" segment is anticipated to be a dominant application, driven by the inherent need to identify even minute imperfections that could compromise product integrity and safety. "Failure Analysis" is also a key area, enabling manufacturers to understand root causes of defects and implement corrective actions, thereby enhancing product reliability and reducing costly recalls.
The market's expansion is further bolstered by technological advancements in CT scanning hardware and software, leading to increased scanning speeds, higher resolution, and more sophisticated data analysis capabilities. Innovations in artificial intelligence and machine learning are also being integrated to automate flaw detection and interpretation, making the technology more accessible and efficient. Emerging trends include the adoption of micro-focus and nano-focus CT systems for sub-micron resolution imaging, crucial for inspecting intricate electronic components and advanced materials. The growing emphasis on Industry 4.0 initiatives, with their focus on automation, data-driven decision-making, and enhanced manufacturing processes, provides a fertile ground for industrial CT scanning adoption. While the market is overwhelmingly positive, potential restraints could include the high initial investment costs for advanced CT systems and the need for specialized expertise for operation and data interpretation. However, the long-term benefits of improved product quality, reduced waste, and enhanced safety are expected to outweigh these challenges, ensuring continued market penetration and growth.
This comprehensive report offers an in-depth analysis of the Industrial CT Scanning Industry, providing invaluable insights for stakeholders navigating this rapidly evolving sector. The study spans from 2019 to 2033, with a base year of 2025 and an estimated year of 2025, covering the forecast period of 2025–2033 and the historical period of 2019–2024. Uncover market dynamics, key trends, leading players, and future opportunities in this critical field of non-destructive testing and metrology. With an estimated market valuation of hundreds of millions and projected growth driven by advanced manufacturing, the Industrial CT Scanning market is poised for significant expansion.
Industrial CT Scanning Industry Market Dynamics & Concentration
The Industrial CT Scanning Industry exhibits a moderate to high market concentration, with a few key players dominating the landscape. Innovation drivers are primarily fueled by the increasing demand for sophisticated non-destructive testing (NDT) solutions across various high-tech industries. Regulatory frameworks, while evolving, largely support the adoption of advanced metrology tools for quality assurance and safety compliance. Product substitutes, such as traditional X-ray, ultrasound, and manual inspection, are gradually being outperformed by the detailed 3D volumetric data offered by CT scanning. End-user trends point towards a growing preference for in-line inspection and automated data analysis, accelerating adoption in sectors like automotive and aerospace. Merger and acquisition (M&A) activities, while not exceptionally frequent, signal strategic consolidation to enhance technological portfolios and market reach. Expect approximately ten significant M&A deals over the historical and forecast periods, primarily involving acquisitions of smaller technology firms by larger conglomerates. The market share distribution sees leaders like Waygate Technologies and Thermo Fisher Scientific holding substantial portions, estimated at over 30% combined market share in 2025.
Industrial CT Scanning Industry Industry Trends & Analysis
The Industrial CT Scanning Industry is experiencing robust growth, projected to achieve a Compound Annual Growth Rate (CAGR) of approximately 9.5% during the forecast period. This expansion is driven by a confluence of factors, including the escalating complexity of manufactured components, the stringent quality demands of industries such as Aerospace and Defense and Automotive, and the relentless pursuit of enhanced process efficiency. Technological disruptions are a constant, with advancements in detector technology, X-ray source power, and reconstruction algorithms continuously pushing the boundaries of resolution, speed, and throughput. Consumers are increasingly demanding higher precision, greater detail in defect analysis, and faster inspection times, directly impacting the features and capabilities of industrial CT scanners. Competitive dynamics are characterized by intense innovation and strategic partnerships aimed at developing integrated solutions that combine CT scanning with advanced data analytics and AI-powered interpretation. The penetration of CT scanning in traditional manufacturing environments is steadily increasing, moving beyond specialized applications to become a mainstream quality control tool. Global market penetration is projected to reach over 35% by 2033.
Leading Markets & Segments in Industrial CT Scanning Industry
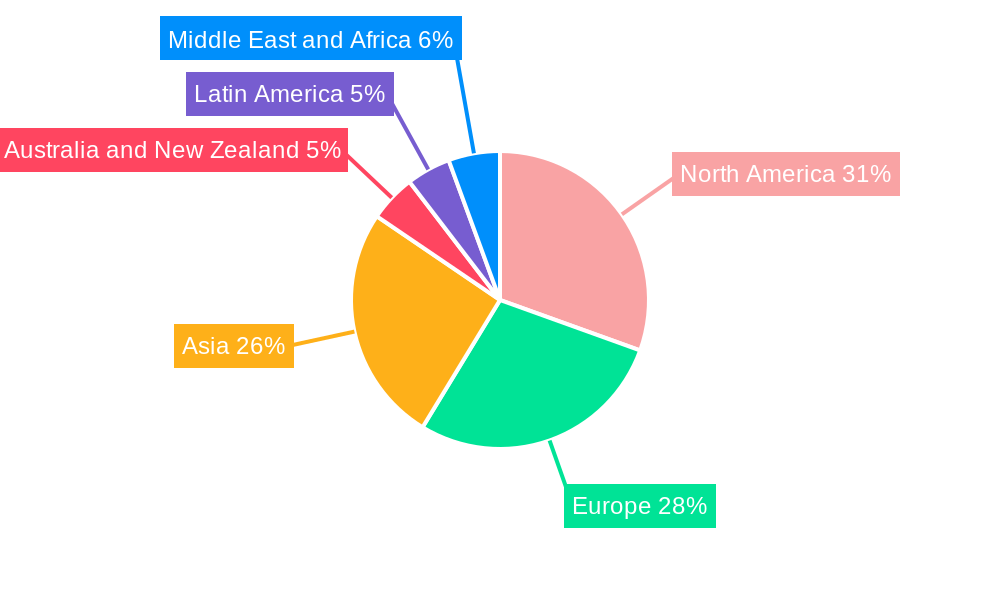
The North America region currently holds a dominant position in the Industrial CT Scanning Industry, driven by a strong presence of leading end-user industries like Aerospace and Defense and Automotive, coupled with significant investment in research and development. Within this region, the United States is the largest market, supported by favorable economic policies and a robust industrial base.
Application Dominance:
- Flaw Detection and Inspection remains the largest application segment, accounting for an estimated 45% of the market in 2025. This is driven by the critical need to identify internal defects, voids, and inclusions in critical components.
- Failure Analysis follows closely, representing approximately 25% of the market, crucial for understanding product failures and improving future designs.
- Assembly Analysis is a growing segment, driven by the increasing complexity of multi-material assemblies, with an estimated 20% market share.
- Other Applications, including research and development and process optimization, constitute the remaining 10%.
End-user Industry Dominance:
- The Aerospace and Defense industry is the leading end-user, representing an estimated 30% of the market. The stringent safety requirements and complex component structures in this sector necessitate advanced NDT solutions.
- The Automotive industry is a significant contributor, projected to hold approximately 28% of the market, with the rise of electric vehicles and complex powertrain components driving demand.
- The Electronics sector, with its miniaturized components and intricate circuitry, accounts for around 22% of the market.
- The Oil and Gas industry, particularly for inspecting pipelines and exploration equipment, represents about 15%.
- Other End-user Industries, including medical devices and general manufacturing, make up the remaining 5%.
Industrial CT Scanning Industry Product Developments
Product innovations in the Industrial CT Scanning Industry are focused on enhancing resolution, speed, and ease of use. Companies are developing compact, high-energy systems for scanning larger and denser parts, as well as micro-CT systems for unparalleled detail in small and complex geometries. Key trends include the integration of AI for automated defect detection and analysis, software advancements for faster data processing and visualization, and the development of mobile and in-line CT solutions for real-time quality control on production lines. These developments offer competitive advantages by enabling more thorough inspections, reducing inspection times, and improving overall manufacturing efficiency.
Key Drivers of Industrial CT Scanning Industry Growth
The growth of the Industrial CT Scanning Industry is primarily propelled by several key drivers:
- Technological Advancements: Continuous innovation in X-ray sources, detectors, and reconstruction algorithms leads to higher resolution, faster scan times, and improved imaging capabilities.
- Increasing Demand for Quality Assurance: Stringent quality control requirements in critical industries like aerospace, automotive, and electronics necessitate advanced non-destructive testing methods.
- Rise of Additive Manufacturing: The growing adoption of 3D printing creates a demand for CT scanning to verify internal structures and material integrity of complex printed parts.
- Industry 4.0 and Automation: The integration of CT scanning into automated production lines and smart manufacturing ecosystems enhances efficiency and data-driven decision-making.
Challenges in the Industrial CT Scanning Industry Market
Despite its growth potential, the Industrial CT Scanning Industry faces several challenges:
- High Initial Investment Costs: The capital expenditure for industrial CT scanning systems can be substantial, posing a barrier for small and medium-sized enterprises (SMEs).
- Technical Expertise Requirements: Operating and interpreting data from CT scanners often requires specialized training and skilled personnel.
- Scan Time Limitations for Large Components: While improving, scanning very large or extremely dense objects can still be time-consuming, impacting throughput in high-volume production environments.
- Data Management and Processing: The large volume of data generated by CT scans requires robust data management infrastructure and advanced processing capabilities.
Emerging Opportunities in Industrial CT Scanning Industry
Emerging opportunities in the Industrial CT Scanning Industry are vast and varied:
- Development of AI-Powered Analytics: Leveraging artificial intelligence for automated defect recognition, classification, and reporting will significantly enhance efficiency and reduce human error.
- Expansion into New End-user Industries: Growing adoption in sectors like consumer goods, food and beverage (for quality and safety checks), and renewable energy components presents untapped market potential.
- Advancements in Portable and In-line Systems: The development of more portable CT scanners and integrated in-line inspection solutions will enable wider adoption in diverse manufacturing settings and real-time process monitoring.
- Focus on Materials Science Research: The ability of CT to analyze microstructures and material properties is opening doors for its use in advanced materials research and development.
Leading Players in the Industrial CT Scanning Industry Sector
- Comet Group Limited
- Nikon Corporation
- Thermo Fisher Scientific Inc
- Hitachi Ltd
- 3DX-Ray Limited
- Zeiss International
- Omron Corporation
- Waygate Technologies
- Bruker Corporation
- Shimadzu Corporation
Key Milestones in Industrial CT Scanning Industry Industry
- March 2021: ZEISS introduced ZEISS Xradia CrystalCT micro-computed tomography (microCT) system to enable 3D crystallographic imaging of polycrystalline materials for a wide range of metal and alloy, additive manufacturing, ceramic, and pharmaceutical samples in industrial and academic laboratories.
- December 2020: Waygate Technologies announced the launch of its first high-energy Computed Tomography (CT) system: Phoenix Power|scan HE. Offering 9 mega electron volts (MeV), the system packs 20 times more punch in penetration energy as compared to the standard 450 kilo electron volts (keV). The system can therefore scan and measure internal features of critical, high-density components and assemblies. The parts can also be up to 2 meters in diameter and height and up to 1000 kg in weight. For easy handling and loading, the system also comes with an integrated crane.
Strategic Outlook for Industrial CT Scanning Industry Market
The strategic outlook for the Industrial CT Scanning Industry is exceptionally positive, driven by continuous technological innovation and the increasing imperative for precise, non-destructive quality assessment. Future growth will be fueled by the integration of CT scanning into the broader Industry 4.0 framework, enabling data-driven manufacturing and predictive maintenance. Key growth accelerators include the development of more accessible and user-friendly systems, strategic partnerships between CT manufacturers and software providers for enhanced data analytics, and the expansion into emerging economies with rapidly growing manufacturing sectors. The market is expected to witness a steady increase in adoption across a wider spectrum of industries, solidifying CT scanning’s role as an indispensable tool for modern manufacturing and research.
Industrial CT Scanning Industry Segmentation
-
1. Application
- 1.1. Flaw Detection and Inspection
- 1.2. Failure Analysis
- 1.3. Assembly Analysis
- 1.4. Other Applications
-
2. End-user Industry
- 2.1. Aerospace and Defense
- 2.2. Automotive
- 2.3. Electronics
- 2.4. Oil and Gas
- 2.5. Other End-user Industries
Industrial CT Scanning Industry Segmentation By Geography
- 1. North America
- 2. Europe
- 3. Asia
- 4. Australia and New Zealand
- 5. Latin America
- 6. Middle East and Africa
Industrial CT Scanning Industry REPORT HIGHLIGHTS
| Aspects | Details |
|---|---|
| Study Period | 2019-2033 |
| Base Year | 2024 |
| Estimated Year | 2025 |
| Forecast Period | 2025-2033 |
| Historical Period | 2019-2024 |
| Growth Rate | CAGR of 9.03% from 2019-2033 |
| Segmentation |
|
Table of Contents
- 1. Introduction
- 1.1. Research Scope
- 1.2. Market Segmentation
- 1.3. Research Methodology
- 1.4. Definitions and Assumptions
- 2. Executive Summary
- 2.1. Introduction
- 3. Market Dynamics
- 3.1. Introduction
- 3.2. Market Drivers
- 3.2.1. Technology Improvements in Resolution and Image Processing; Intensifying Demand for Portable Radiography Equipment
- 3.3. Market Restrains
- 3.3.1. High Acquisition and Maintenace Cost of Industrial CT systems
- 3.4. Market Trends
- 3.4.1. Aerospace Industry to Drive the Industrial Computed Tomography Market
- 4. Market Factor Analysis
- 4.1. Porters Five Forces
- 4.2. Supply/Value Chain
- 4.3. PESTEL analysis
- 4.4. Market Entropy
- 4.5. Patent/Trademark Analysis
- 5. Global Industrial CT Scanning Industry Analysis, Insights and Forecast, 2019-2031
- 5.1. Market Analysis, Insights and Forecast - by Application
- 5.1.1. Flaw Detection and Inspection
- 5.1.2. Failure Analysis
- 5.1.3. Assembly Analysis
- 5.1.4. Other Applications
- 5.2. Market Analysis, Insights and Forecast - by End-user Industry
- 5.2.1. Aerospace and Defense
- 5.2.2. Automotive
- 5.2.3. Electronics
- 5.2.4. Oil and Gas
- 5.2.5. Other End-user Industries
- 5.3. Market Analysis, Insights and Forecast - by Region
- 5.3.1. North America
- 5.3.2. Europe
- 5.3.3. Asia
- 5.3.4. Australia and New Zealand
- 5.3.5. Latin America
- 5.3.6. Middle East and Africa
- 5.1. Market Analysis, Insights and Forecast - by Application
- 6. North America Industrial CT Scanning Industry Analysis, Insights and Forecast, 2019-2031
- 6.1. Market Analysis, Insights and Forecast - by Application
- 6.1.1. Flaw Detection and Inspection
- 6.1.2. Failure Analysis
- 6.1.3. Assembly Analysis
- 6.1.4. Other Applications
- 6.2. Market Analysis, Insights and Forecast - by End-user Industry
- 6.2.1. Aerospace and Defense
- 6.2.2. Automotive
- 6.2.3. Electronics
- 6.2.4. Oil and Gas
- 6.2.5. Other End-user Industries
- 6.1. Market Analysis, Insights and Forecast - by Application
- 7. Europe Industrial CT Scanning Industry Analysis, Insights and Forecast, 2019-2031
- 7.1. Market Analysis, Insights and Forecast - by Application
- 7.1.1. Flaw Detection and Inspection
- 7.1.2. Failure Analysis
- 7.1.3. Assembly Analysis
- 7.1.4. Other Applications
- 7.2. Market Analysis, Insights and Forecast - by End-user Industry
- 7.2.1. Aerospace and Defense
- 7.2.2. Automotive
- 7.2.3. Electronics
- 7.2.4. Oil and Gas
- 7.2.5. Other End-user Industries
- 7.1. Market Analysis, Insights and Forecast - by Application
- 8. Asia Industrial CT Scanning Industry Analysis, Insights and Forecast, 2019-2031
- 8.1. Market Analysis, Insights and Forecast - by Application
- 8.1.1. Flaw Detection and Inspection
- 8.1.2. Failure Analysis
- 8.1.3. Assembly Analysis
- 8.1.4. Other Applications
- 8.2. Market Analysis, Insights and Forecast - by End-user Industry
- 8.2.1. Aerospace and Defense
- 8.2.2. Automotive
- 8.2.3. Electronics
- 8.2.4. Oil and Gas
- 8.2.5. Other End-user Industries
- 8.1. Market Analysis, Insights and Forecast - by Application
- 9. Australia and New Zealand Industrial CT Scanning Industry Analysis, Insights and Forecast, 2019-2031
- 9.1. Market Analysis, Insights and Forecast - by Application
- 9.1.1. Flaw Detection and Inspection
- 9.1.2. Failure Analysis
- 9.1.3. Assembly Analysis
- 9.1.4. Other Applications
- 9.2. Market Analysis, Insights and Forecast - by End-user Industry
- 9.2.1. Aerospace and Defense
- 9.2.2. Automotive
- 9.2.3. Electronics
- 9.2.4. Oil and Gas
- 9.2.5. Other End-user Industries
- 9.1. Market Analysis, Insights and Forecast - by Application
- 10. Latin America Industrial CT Scanning Industry Analysis, Insights and Forecast, 2019-2031
- 10.1. Market Analysis, Insights and Forecast - by Application
- 10.1.1. Flaw Detection and Inspection
- 10.1.2. Failure Analysis
- 10.1.3. Assembly Analysis
- 10.1.4. Other Applications
- 10.2. Market Analysis, Insights and Forecast - by End-user Industry
- 10.2.1. Aerospace and Defense
- 10.2.2. Automotive
- 10.2.3. Electronics
- 10.2.4. Oil and Gas
- 10.2.5. Other End-user Industries
- 10.1. Market Analysis, Insights and Forecast - by Application
- 11. Middle East and Africa Industrial CT Scanning Industry Analysis, Insights and Forecast, 2019-2031
- 11.1. Market Analysis, Insights and Forecast - by Application
- 11.1.1. Flaw Detection and Inspection
- 11.1.2. Failure Analysis
- 11.1.3. Assembly Analysis
- 11.1.4. Other Applications
- 11.2. Market Analysis, Insights and Forecast - by End-user Industry
- 11.2.1. Aerospace and Defense
- 11.2.2. Automotive
- 11.2.3. Electronics
- 11.2.4. Oil and Gas
- 11.2.5. Other End-user Industries
- 11.1. Market Analysis, Insights and Forecast - by Application
- 12. North America Industrial CT Scanning Industry Analysis, Insights and Forecast, 2019-2031
- 12.1. Market Analysis, Insights and Forecast - By Country/Sub-region
- 12.1.1 United States
- 12.1.2 Canada
- 12.1.3 Mexico
- 13. Europe Industrial CT Scanning Industry Analysis, Insights and Forecast, 2019-2031
- 13.1. Market Analysis, Insights and Forecast - By Country/Sub-region
- 13.1.1 Germany
- 13.1.2 United Kingdom
- 13.1.3 France
- 13.1.4 Spain
- 13.1.5 Italy
- 13.1.6 Spain
- 13.1.7 Belgium
- 13.1.8 Netherland
- 13.1.9 Nordics
- 13.1.10 Rest of Europe
- 14. Asia Pacific Industrial CT Scanning Industry Analysis, Insights and Forecast, 2019-2031
- 14.1. Market Analysis, Insights and Forecast - By Country/Sub-region
- 14.1.1 China
- 14.1.2 Japan
- 14.1.3 India
- 14.1.4 South Korea
- 14.1.5 Southeast Asia
- 14.1.6 Australia
- 14.1.7 Indonesia
- 14.1.8 Phillipes
- 14.1.9 Singapore
- 14.1.10 Thailandc
- 14.1.11 Rest of Asia Pacific
- 15. South America Industrial CT Scanning Industry Analysis, Insights and Forecast, 2019-2031
- 15.1. Market Analysis, Insights and Forecast - By Country/Sub-region
- 15.1.1 Brazil
- 15.1.2 Argentina
- 15.1.3 Peru
- 15.1.4 Chile
- 15.1.5 Colombia
- 15.1.6 Ecuador
- 15.1.7 Venezuela
- 15.1.8 Rest of South America
- 16. North America Industrial CT Scanning Industry Analysis, Insights and Forecast, 2019-2031
- 16.1. Market Analysis, Insights and Forecast - By Country/Sub-region
- 16.1.1 United States
- 16.1.2 Canada
- 16.1.3 Mexico
- 17. MEA Industrial CT Scanning Industry Analysis, Insights and Forecast, 2019-2031
- 17.1. Market Analysis, Insights and Forecast - By Country/Sub-region
- 17.1.1 United Arab Emirates
- 17.1.2 Saudi Arabia
- 17.1.3 South Africa
- 17.1.4 Rest of Middle East and Africa
- 18. Competitive Analysis
- 18.1. Global Market Share Analysis 2024
- 18.2. Company Profiles
- 18.2.1 Comet Group Limited
- 18.2.1.1. Overview
- 18.2.1.2. Products
- 18.2.1.3. SWOT Analysis
- 18.2.1.4. Recent Developments
- 18.2.1.5. Financials (Based on Availability)
- 18.2.2 Nikon Corporation
- 18.2.2.1. Overview
- 18.2.2.2. Products
- 18.2.2.3. SWOT Analysis
- 18.2.2.4. Recent Developments
- 18.2.2.5. Financials (Based on Availability)
- 18.2.3 Thermo Fisher Scientific Inc
- 18.2.3.1. Overview
- 18.2.3.2. Products
- 18.2.3.3. SWOT Analysis
- 18.2.3.4. Recent Developments
- 18.2.3.5. Financials (Based on Availability)
- 18.2.4 Hitachi Ltd
- 18.2.4.1. Overview
- 18.2.4.2. Products
- 18.2.4.3. SWOT Analysis
- 18.2.4.4. Recent Developments
- 18.2.4.5. Financials (Based on Availability)
- 18.2.5 3DX-Ray Limited
- 18.2.5.1. Overview
- 18.2.5.2. Products
- 18.2.5.3. SWOT Analysis
- 18.2.5.4. Recent Developments
- 18.2.5.5. Financials (Based on Availability)
- 18.2.6 Zeiss International
- 18.2.6.1. Overview
- 18.2.6.2. Products
- 18.2.6.3. SWOT Analysis
- 18.2.6.4. Recent Developments
- 18.2.6.5. Financials (Based on Availability)
- 18.2.7 Omron Corporation
- 18.2.7.1. Overview
- 18.2.7.2. Products
- 18.2.7.3. SWOT Analysis
- 18.2.7.4. Recent Developments
- 18.2.7.5. Financials (Based on Availability)
- 18.2.8 Waygate Technologies
- 18.2.8.1. Overview
- 18.2.8.2. Products
- 18.2.8.3. SWOT Analysis
- 18.2.8.4. Recent Developments
- 18.2.8.5. Financials (Based on Availability)
- 18.2.9 Bruker Corporation
- 18.2.9.1. Overview
- 18.2.9.2. Products
- 18.2.9.3. SWOT Analysis
- 18.2.9.4. Recent Developments
- 18.2.9.5. Financials (Based on Availability)
- 18.2.10 Shimadzu Corporation
- 18.2.10.1. Overview
- 18.2.10.2. Products
- 18.2.10.3. SWOT Analysis
- 18.2.10.4. Recent Developments
- 18.2.10.5. Financials (Based on Availability)
- 18.2.1 Comet Group Limited
List of Figures
- Figure 1: Global Industrial CT Scanning Industry Revenue Breakdown (Million, %) by Region 2024 & 2032
- Figure 2: Global Industrial CT Scanning Industry Volume Breakdown (K Unit, %) by Region 2024 & 2032
- Figure 3: North America Industrial CT Scanning Industry Revenue (Million), by Country 2024 & 2032
- Figure 4: North America Industrial CT Scanning Industry Volume (K Unit), by Country 2024 & 2032
- Figure 5: North America Industrial CT Scanning Industry Revenue Share (%), by Country 2024 & 2032
- Figure 6: North America Industrial CT Scanning Industry Volume Share (%), by Country 2024 & 2032
- Figure 7: Europe Industrial CT Scanning Industry Revenue (Million), by Country 2024 & 2032
- Figure 8: Europe Industrial CT Scanning Industry Volume (K Unit), by Country 2024 & 2032
- Figure 9: Europe Industrial CT Scanning Industry Revenue Share (%), by Country 2024 & 2032
- Figure 10: Europe Industrial CT Scanning Industry Volume Share (%), by Country 2024 & 2032
- Figure 11: Asia Pacific Industrial CT Scanning Industry Revenue (Million), by Country 2024 & 2032
- Figure 12: Asia Pacific Industrial CT Scanning Industry Volume (K Unit), by Country 2024 & 2032
- Figure 13: Asia Pacific Industrial CT Scanning Industry Revenue Share (%), by Country 2024 & 2032
- Figure 14: Asia Pacific Industrial CT Scanning Industry Volume Share (%), by Country 2024 & 2032
- Figure 15: South America Industrial CT Scanning Industry Revenue (Million), by Country 2024 & 2032
- Figure 16: South America Industrial CT Scanning Industry Volume (K Unit), by Country 2024 & 2032
- Figure 17: South America Industrial CT Scanning Industry Revenue Share (%), by Country 2024 & 2032
- Figure 18: South America Industrial CT Scanning Industry Volume Share (%), by Country 2024 & 2032
- Figure 19: North America Industrial CT Scanning Industry Revenue (Million), by Country 2024 & 2032
- Figure 20: North America Industrial CT Scanning Industry Volume (K Unit), by Country 2024 & 2032
- Figure 21: North America Industrial CT Scanning Industry Revenue Share (%), by Country 2024 & 2032
- Figure 22: North America Industrial CT Scanning Industry Volume Share (%), by Country 2024 & 2032
- Figure 23: MEA Industrial CT Scanning Industry Revenue (Million), by Country 2024 & 2032
- Figure 24: MEA Industrial CT Scanning Industry Volume (K Unit), by Country 2024 & 2032
- Figure 25: MEA Industrial CT Scanning Industry Revenue Share (%), by Country 2024 & 2032
- Figure 26: MEA Industrial CT Scanning Industry Volume Share (%), by Country 2024 & 2032
- Figure 27: North America Industrial CT Scanning Industry Revenue (Million), by Application 2024 & 2032
- Figure 28: North America Industrial CT Scanning Industry Volume (K Unit), by Application 2024 & 2032
- Figure 29: North America Industrial CT Scanning Industry Revenue Share (%), by Application 2024 & 2032
- Figure 30: North America Industrial CT Scanning Industry Volume Share (%), by Application 2024 & 2032
- Figure 31: North America Industrial CT Scanning Industry Revenue (Million), by End-user Industry 2024 & 2032
- Figure 32: North America Industrial CT Scanning Industry Volume (K Unit), by End-user Industry 2024 & 2032
- Figure 33: North America Industrial CT Scanning Industry Revenue Share (%), by End-user Industry 2024 & 2032
- Figure 34: North America Industrial CT Scanning Industry Volume Share (%), by End-user Industry 2024 & 2032
- Figure 35: North America Industrial CT Scanning Industry Revenue (Million), by Country 2024 & 2032
- Figure 36: North America Industrial CT Scanning Industry Volume (K Unit), by Country 2024 & 2032
- Figure 37: North America Industrial CT Scanning Industry Revenue Share (%), by Country 2024 & 2032
- Figure 38: North America Industrial CT Scanning Industry Volume Share (%), by Country 2024 & 2032
- Figure 39: Europe Industrial CT Scanning Industry Revenue (Million), by Application 2024 & 2032
- Figure 40: Europe Industrial CT Scanning Industry Volume (K Unit), by Application 2024 & 2032
- Figure 41: Europe Industrial CT Scanning Industry Revenue Share (%), by Application 2024 & 2032
- Figure 42: Europe Industrial CT Scanning Industry Volume Share (%), by Application 2024 & 2032
- Figure 43: Europe Industrial CT Scanning Industry Revenue (Million), by End-user Industry 2024 & 2032
- Figure 44: Europe Industrial CT Scanning Industry Volume (K Unit), by End-user Industry 2024 & 2032
- Figure 45: Europe Industrial CT Scanning Industry Revenue Share (%), by End-user Industry 2024 & 2032
- Figure 46: Europe Industrial CT Scanning Industry Volume Share (%), by End-user Industry 2024 & 2032
- Figure 47: Europe Industrial CT Scanning Industry Revenue (Million), by Country 2024 & 2032
- Figure 48: Europe Industrial CT Scanning Industry Volume (K Unit), by Country 2024 & 2032
- Figure 49: Europe Industrial CT Scanning Industry Revenue Share (%), by Country 2024 & 2032
- Figure 50: Europe Industrial CT Scanning Industry Volume Share (%), by Country 2024 & 2032
- Figure 51: Asia Industrial CT Scanning Industry Revenue (Million), by Application 2024 & 2032
- Figure 52: Asia Industrial CT Scanning Industry Volume (K Unit), by Application 2024 & 2032
- Figure 53: Asia Industrial CT Scanning Industry Revenue Share (%), by Application 2024 & 2032
- Figure 54: Asia Industrial CT Scanning Industry Volume Share (%), by Application 2024 & 2032
- Figure 55: Asia Industrial CT Scanning Industry Revenue (Million), by End-user Industry 2024 & 2032
- Figure 56: Asia Industrial CT Scanning Industry Volume (K Unit), by End-user Industry 2024 & 2032
- Figure 57: Asia Industrial CT Scanning Industry Revenue Share (%), by End-user Industry 2024 & 2032
- Figure 58: Asia Industrial CT Scanning Industry Volume Share (%), by End-user Industry 2024 & 2032
- Figure 59: Asia Industrial CT Scanning Industry Revenue (Million), by Country 2024 & 2032
- Figure 60: Asia Industrial CT Scanning Industry Volume (K Unit), by Country 2024 & 2032
- Figure 61: Asia Industrial CT Scanning Industry Revenue Share (%), by Country 2024 & 2032
- Figure 62: Asia Industrial CT Scanning Industry Volume Share (%), by Country 2024 & 2032
- Figure 63: Australia and New Zealand Industrial CT Scanning Industry Revenue (Million), by Application 2024 & 2032
- Figure 64: Australia and New Zealand Industrial CT Scanning Industry Volume (K Unit), by Application 2024 & 2032
- Figure 65: Australia and New Zealand Industrial CT Scanning Industry Revenue Share (%), by Application 2024 & 2032
- Figure 66: Australia and New Zealand Industrial CT Scanning Industry Volume Share (%), by Application 2024 & 2032
- Figure 67: Australia and New Zealand Industrial CT Scanning Industry Revenue (Million), by End-user Industry 2024 & 2032
- Figure 68: Australia and New Zealand Industrial CT Scanning Industry Volume (K Unit), by End-user Industry 2024 & 2032
- Figure 69: Australia and New Zealand Industrial CT Scanning Industry Revenue Share (%), by End-user Industry 2024 & 2032
- Figure 70: Australia and New Zealand Industrial CT Scanning Industry Volume Share (%), by End-user Industry 2024 & 2032
- Figure 71: Australia and New Zealand Industrial CT Scanning Industry Revenue (Million), by Country 2024 & 2032
- Figure 72: Australia and New Zealand Industrial CT Scanning Industry Volume (K Unit), by Country 2024 & 2032
- Figure 73: Australia and New Zealand Industrial CT Scanning Industry Revenue Share (%), by Country 2024 & 2032
- Figure 74: Australia and New Zealand Industrial CT Scanning Industry Volume Share (%), by Country 2024 & 2032
- Figure 75: Latin America Industrial CT Scanning Industry Revenue (Million), by Application 2024 & 2032
- Figure 76: Latin America Industrial CT Scanning Industry Volume (K Unit), by Application 2024 & 2032
- Figure 77: Latin America Industrial CT Scanning Industry Revenue Share (%), by Application 2024 & 2032
- Figure 78: Latin America Industrial CT Scanning Industry Volume Share (%), by Application 2024 & 2032
- Figure 79: Latin America Industrial CT Scanning Industry Revenue (Million), by End-user Industry 2024 & 2032
- Figure 80: Latin America Industrial CT Scanning Industry Volume (K Unit), by End-user Industry 2024 & 2032
- Figure 81: Latin America Industrial CT Scanning Industry Revenue Share (%), by End-user Industry 2024 & 2032
- Figure 82: Latin America Industrial CT Scanning Industry Volume Share (%), by End-user Industry 2024 & 2032
- Figure 83: Latin America Industrial CT Scanning Industry Revenue (Million), by Country 2024 & 2032
- Figure 84: Latin America Industrial CT Scanning Industry Volume (K Unit), by Country 2024 & 2032
- Figure 85: Latin America Industrial CT Scanning Industry Revenue Share (%), by Country 2024 & 2032
- Figure 86: Latin America Industrial CT Scanning Industry Volume Share (%), by Country 2024 & 2032
- Figure 87: Middle East and Africa Industrial CT Scanning Industry Revenue (Million), by Application 2024 & 2032
- Figure 88: Middle East and Africa Industrial CT Scanning Industry Volume (K Unit), by Application 2024 & 2032
- Figure 89: Middle East and Africa Industrial CT Scanning Industry Revenue Share (%), by Application 2024 & 2032
- Figure 90: Middle East and Africa Industrial CT Scanning Industry Volume Share (%), by Application 2024 & 2032
- Figure 91: Middle East and Africa Industrial CT Scanning Industry Revenue (Million), by End-user Industry 2024 & 2032
- Figure 92: Middle East and Africa Industrial CT Scanning Industry Volume (K Unit), by End-user Industry 2024 & 2032
- Figure 93: Middle East and Africa Industrial CT Scanning Industry Revenue Share (%), by End-user Industry 2024 & 2032
- Figure 94: Middle East and Africa Industrial CT Scanning Industry Volume Share (%), by End-user Industry 2024 & 2032
- Figure 95: Middle East and Africa Industrial CT Scanning Industry Revenue (Million), by Country 2024 & 2032
- Figure 96: Middle East and Africa Industrial CT Scanning Industry Volume (K Unit), by Country 2024 & 2032
- Figure 97: Middle East and Africa Industrial CT Scanning Industry Revenue Share (%), by Country 2024 & 2032
- Figure 98: Middle East and Africa Industrial CT Scanning Industry Volume Share (%), by Country 2024 & 2032
List of Tables
- Table 1: Global Industrial CT Scanning Industry Revenue Million Forecast, by Region 2019 & 2032
- Table 2: Global Industrial CT Scanning Industry Volume K Unit Forecast, by Region 2019 & 2032
- Table 3: Global Industrial CT Scanning Industry Revenue Million Forecast, by Application 2019 & 2032
- Table 4: Global Industrial CT Scanning Industry Volume K Unit Forecast, by Application 2019 & 2032
- Table 5: Global Industrial CT Scanning Industry Revenue Million Forecast, by End-user Industry 2019 & 2032
- Table 6: Global Industrial CT Scanning Industry Volume K Unit Forecast, by End-user Industry 2019 & 2032
- Table 7: Global Industrial CT Scanning Industry Revenue Million Forecast, by Region 2019 & 2032
- Table 8: Global Industrial CT Scanning Industry Volume K Unit Forecast, by Region 2019 & 2032
- Table 9: Global Industrial CT Scanning Industry Revenue Million Forecast, by Country 2019 & 2032
- Table 10: Global Industrial CT Scanning Industry Volume K Unit Forecast, by Country 2019 & 2032
- Table 11: United States Industrial CT Scanning Industry Revenue (Million) Forecast, by Application 2019 & 2032
- Table 12: United States Industrial CT Scanning Industry Volume (K Unit) Forecast, by Application 2019 & 2032
- Table 13: Canada Industrial CT Scanning Industry Revenue (Million) Forecast, by Application 2019 & 2032
- Table 14: Canada Industrial CT Scanning Industry Volume (K Unit) Forecast, by Application 2019 & 2032
- Table 15: Mexico Industrial CT Scanning Industry Revenue (Million) Forecast, by Application 2019 & 2032
- Table 16: Mexico Industrial CT Scanning Industry Volume (K Unit) Forecast, by Application 2019 & 2032
- Table 17: Global Industrial CT Scanning Industry Revenue Million Forecast, by Country 2019 & 2032
- Table 18: Global Industrial CT Scanning Industry Volume K Unit Forecast, by Country 2019 & 2032
- Table 19: Germany Industrial CT Scanning Industry Revenue (Million) Forecast, by Application 2019 & 2032
- Table 20: Germany Industrial CT Scanning Industry Volume (K Unit) Forecast, by Application 2019 & 2032
- Table 21: United Kingdom Industrial CT Scanning Industry Revenue (Million) Forecast, by Application 2019 & 2032
- Table 22: United Kingdom Industrial CT Scanning Industry Volume (K Unit) Forecast, by Application 2019 & 2032
- Table 23: France Industrial CT Scanning Industry Revenue (Million) Forecast, by Application 2019 & 2032
- Table 24: France Industrial CT Scanning Industry Volume (K Unit) Forecast, by Application 2019 & 2032
- Table 25: Spain Industrial CT Scanning Industry Revenue (Million) Forecast, by Application 2019 & 2032
- Table 26: Spain Industrial CT Scanning Industry Volume (K Unit) Forecast, by Application 2019 & 2032
- Table 27: Italy Industrial CT Scanning Industry Revenue (Million) Forecast, by Application 2019 & 2032
- Table 28: Italy Industrial CT Scanning Industry Volume (K Unit) Forecast, by Application 2019 & 2032
- Table 29: Spain Industrial CT Scanning Industry Revenue (Million) Forecast, by Application 2019 & 2032
- Table 30: Spain Industrial CT Scanning Industry Volume (K Unit) Forecast, by Application 2019 & 2032
- Table 31: Belgium Industrial CT Scanning Industry Revenue (Million) Forecast, by Application 2019 & 2032
- Table 32: Belgium Industrial CT Scanning Industry Volume (K Unit) Forecast, by Application 2019 & 2032
- Table 33: Netherland Industrial CT Scanning Industry Revenue (Million) Forecast, by Application 2019 & 2032
- Table 34: Netherland Industrial CT Scanning Industry Volume (K Unit) Forecast, by Application 2019 & 2032
- Table 35: Nordics Industrial CT Scanning Industry Revenue (Million) Forecast, by Application 2019 & 2032
- Table 36: Nordics Industrial CT Scanning Industry Volume (K Unit) Forecast, by Application 2019 & 2032
- Table 37: Rest of Europe Industrial CT Scanning Industry Revenue (Million) Forecast, by Application 2019 & 2032
- Table 38: Rest of Europe Industrial CT Scanning Industry Volume (K Unit) Forecast, by Application 2019 & 2032
- Table 39: Global Industrial CT Scanning Industry Revenue Million Forecast, by Country 2019 & 2032
- Table 40: Global Industrial CT Scanning Industry Volume K Unit Forecast, by Country 2019 & 2032
- Table 41: China Industrial CT Scanning Industry Revenue (Million) Forecast, by Application 2019 & 2032
- Table 42: China Industrial CT Scanning Industry Volume (K Unit) Forecast, by Application 2019 & 2032
- Table 43: Japan Industrial CT Scanning Industry Revenue (Million) Forecast, by Application 2019 & 2032
- Table 44: Japan Industrial CT Scanning Industry Volume (K Unit) Forecast, by Application 2019 & 2032
- Table 45: India Industrial CT Scanning Industry Revenue (Million) Forecast, by Application 2019 & 2032
- Table 46: India Industrial CT Scanning Industry Volume (K Unit) Forecast, by Application 2019 & 2032
- Table 47: South Korea Industrial CT Scanning Industry Revenue (Million) Forecast, by Application 2019 & 2032
- Table 48: South Korea Industrial CT Scanning Industry Volume (K Unit) Forecast, by Application 2019 & 2032
- Table 49: Southeast Asia Industrial CT Scanning Industry Revenue (Million) Forecast, by Application 2019 & 2032
- Table 50: Southeast Asia Industrial CT Scanning Industry Volume (K Unit) Forecast, by Application 2019 & 2032
- Table 51: Australia Industrial CT Scanning Industry Revenue (Million) Forecast, by Application 2019 & 2032
- Table 52: Australia Industrial CT Scanning Industry Volume (K Unit) Forecast, by Application 2019 & 2032
- Table 53: Indonesia Industrial CT Scanning Industry Revenue (Million) Forecast, by Application 2019 & 2032
- Table 54: Indonesia Industrial CT Scanning Industry Volume (K Unit) Forecast, by Application 2019 & 2032
- Table 55: Phillipes Industrial CT Scanning Industry Revenue (Million) Forecast, by Application 2019 & 2032
- Table 56: Phillipes Industrial CT Scanning Industry Volume (K Unit) Forecast, by Application 2019 & 2032
- Table 57: Singapore Industrial CT Scanning Industry Revenue (Million) Forecast, by Application 2019 & 2032
- Table 58: Singapore Industrial CT Scanning Industry Volume (K Unit) Forecast, by Application 2019 & 2032
- Table 59: Thailandc Industrial CT Scanning Industry Revenue (Million) Forecast, by Application 2019 & 2032
- Table 60: Thailandc Industrial CT Scanning Industry Volume (K Unit) Forecast, by Application 2019 & 2032
- Table 61: Rest of Asia Pacific Industrial CT Scanning Industry Revenue (Million) Forecast, by Application 2019 & 2032
- Table 62: Rest of Asia Pacific Industrial CT Scanning Industry Volume (K Unit) Forecast, by Application 2019 & 2032
- Table 63: Global Industrial CT Scanning Industry Revenue Million Forecast, by Country 2019 & 2032
- Table 64: Global Industrial CT Scanning Industry Volume K Unit Forecast, by Country 2019 & 2032
- Table 65: Brazil Industrial CT Scanning Industry Revenue (Million) Forecast, by Application 2019 & 2032
- Table 66: Brazil Industrial CT Scanning Industry Volume (K Unit) Forecast, by Application 2019 & 2032
- Table 67: Argentina Industrial CT Scanning Industry Revenue (Million) Forecast, by Application 2019 & 2032
- Table 68: Argentina Industrial CT Scanning Industry Volume (K Unit) Forecast, by Application 2019 & 2032
- Table 69: Peru Industrial CT Scanning Industry Revenue (Million) Forecast, by Application 2019 & 2032
- Table 70: Peru Industrial CT Scanning Industry Volume (K Unit) Forecast, by Application 2019 & 2032
- Table 71: Chile Industrial CT Scanning Industry Revenue (Million) Forecast, by Application 2019 & 2032
- Table 72: Chile Industrial CT Scanning Industry Volume (K Unit) Forecast, by Application 2019 & 2032
- Table 73: Colombia Industrial CT Scanning Industry Revenue (Million) Forecast, by Application 2019 & 2032
- Table 74: Colombia Industrial CT Scanning Industry Volume (K Unit) Forecast, by Application 2019 & 2032
- Table 75: Ecuador Industrial CT Scanning Industry Revenue (Million) Forecast, by Application 2019 & 2032
- Table 76: Ecuador Industrial CT Scanning Industry Volume (K Unit) Forecast, by Application 2019 & 2032
- Table 77: Venezuela Industrial CT Scanning Industry Revenue (Million) Forecast, by Application 2019 & 2032
- Table 78: Venezuela Industrial CT Scanning Industry Volume (K Unit) Forecast, by Application 2019 & 2032
- Table 79: Rest of South America Industrial CT Scanning Industry Revenue (Million) Forecast, by Application 2019 & 2032
- Table 80: Rest of South America Industrial CT Scanning Industry Volume (K Unit) Forecast, by Application 2019 & 2032
- Table 81: Global Industrial CT Scanning Industry Revenue Million Forecast, by Country 2019 & 2032
- Table 82: Global Industrial CT Scanning Industry Volume K Unit Forecast, by Country 2019 & 2032
- Table 83: United States Industrial CT Scanning Industry Revenue (Million) Forecast, by Application 2019 & 2032
- Table 84: United States Industrial CT Scanning Industry Volume (K Unit) Forecast, by Application 2019 & 2032
- Table 85: Canada Industrial CT Scanning Industry Revenue (Million) Forecast, by Application 2019 & 2032
- Table 86: Canada Industrial CT Scanning Industry Volume (K Unit) Forecast, by Application 2019 & 2032
- Table 87: Mexico Industrial CT Scanning Industry Revenue (Million) Forecast, by Application 2019 & 2032
- Table 88: Mexico Industrial CT Scanning Industry Volume (K Unit) Forecast, by Application 2019 & 2032
- Table 89: Global Industrial CT Scanning Industry Revenue Million Forecast, by Country 2019 & 2032
- Table 90: Global Industrial CT Scanning Industry Volume K Unit Forecast, by Country 2019 & 2032
- Table 91: United Arab Emirates Industrial CT Scanning Industry Revenue (Million) Forecast, by Application 2019 & 2032
- Table 92: United Arab Emirates Industrial CT Scanning Industry Volume (K Unit) Forecast, by Application 2019 & 2032
- Table 93: Saudi Arabia Industrial CT Scanning Industry Revenue (Million) Forecast, by Application 2019 & 2032
- Table 94: Saudi Arabia Industrial CT Scanning Industry Volume (K Unit) Forecast, by Application 2019 & 2032
- Table 95: South Africa Industrial CT Scanning Industry Revenue (Million) Forecast, by Application 2019 & 2032
- Table 96: South Africa Industrial CT Scanning Industry Volume (K Unit) Forecast, by Application 2019 & 2032
- Table 97: Rest of Middle East and Africa Industrial CT Scanning Industry Revenue (Million) Forecast, by Application 2019 & 2032
- Table 98: Rest of Middle East and Africa Industrial CT Scanning Industry Volume (K Unit) Forecast, by Application 2019 & 2032
- Table 99: Global Industrial CT Scanning Industry Revenue Million Forecast, by Application 2019 & 2032
- Table 100: Global Industrial CT Scanning Industry Volume K Unit Forecast, by Application 2019 & 2032
- Table 101: Global Industrial CT Scanning Industry Revenue Million Forecast, by End-user Industry 2019 & 2032
- Table 102: Global Industrial CT Scanning Industry Volume K Unit Forecast, by End-user Industry 2019 & 2032
- Table 103: Global Industrial CT Scanning Industry Revenue Million Forecast, by Country 2019 & 2032
- Table 104: Global Industrial CT Scanning Industry Volume K Unit Forecast, by Country 2019 & 2032
- Table 105: Global Industrial CT Scanning Industry Revenue Million Forecast, by Application 2019 & 2032
- Table 106: Global Industrial CT Scanning Industry Volume K Unit Forecast, by Application 2019 & 2032
- Table 107: Global Industrial CT Scanning Industry Revenue Million Forecast, by End-user Industry 2019 & 2032
- Table 108: Global Industrial CT Scanning Industry Volume K Unit Forecast, by End-user Industry 2019 & 2032
- Table 109: Global Industrial CT Scanning Industry Revenue Million Forecast, by Country 2019 & 2032
- Table 110: Global Industrial CT Scanning Industry Volume K Unit Forecast, by Country 2019 & 2032
- Table 111: Global Industrial CT Scanning Industry Revenue Million Forecast, by Application 2019 & 2032
- Table 112: Global Industrial CT Scanning Industry Volume K Unit Forecast, by Application 2019 & 2032
- Table 113: Global Industrial CT Scanning Industry Revenue Million Forecast, by End-user Industry 2019 & 2032
- Table 114: Global Industrial CT Scanning Industry Volume K Unit Forecast, by End-user Industry 2019 & 2032
- Table 115: Global Industrial CT Scanning Industry Revenue Million Forecast, by Country 2019 & 2032
- Table 116: Global Industrial CT Scanning Industry Volume K Unit Forecast, by Country 2019 & 2032
- Table 117: Global Industrial CT Scanning Industry Revenue Million Forecast, by Application 2019 & 2032
- Table 118: Global Industrial CT Scanning Industry Volume K Unit Forecast, by Application 2019 & 2032
- Table 119: Global Industrial CT Scanning Industry Revenue Million Forecast, by End-user Industry 2019 & 2032
- Table 120: Global Industrial CT Scanning Industry Volume K Unit Forecast, by End-user Industry 2019 & 2032
- Table 121: Global Industrial CT Scanning Industry Revenue Million Forecast, by Country 2019 & 2032
- Table 122: Global Industrial CT Scanning Industry Volume K Unit Forecast, by Country 2019 & 2032
- Table 123: Global Industrial CT Scanning Industry Revenue Million Forecast, by Application 2019 & 2032
- Table 124: Global Industrial CT Scanning Industry Volume K Unit Forecast, by Application 2019 & 2032
- Table 125: Global Industrial CT Scanning Industry Revenue Million Forecast, by End-user Industry 2019 & 2032
- Table 126: Global Industrial CT Scanning Industry Volume K Unit Forecast, by End-user Industry 2019 & 2032
- Table 127: Global Industrial CT Scanning Industry Revenue Million Forecast, by Country 2019 & 2032
- Table 128: Global Industrial CT Scanning Industry Volume K Unit Forecast, by Country 2019 & 2032
- Table 129: Global Industrial CT Scanning Industry Revenue Million Forecast, by Application 2019 & 2032
- Table 130: Global Industrial CT Scanning Industry Volume K Unit Forecast, by Application 2019 & 2032
- Table 131: Global Industrial CT Scanning Industry Revenue Million Forecast, by End-user Industry 2019 & 2032
- Table 132: Global Industrial CT Scanning Industry Volume K Unit Forecast, by End-user Industry 2019 & 2032
- Table 133: Global Industrial CT Scanning Industry Revenue Million Forecast, by Country 2019 & 2032
- Table 134: Global Industrial CT Scanning Industry Volume K Unit Forecast, by Country 2019 & 2032
Frequently Asked Questions
1. What is the projected Compound Annual Growth Rate (CAGR) of the Industrial CT Scanning Industry?
The projected CAGR is approximately 9.03%.
2. Which companies are prominent players in the Industrial CT Scanning Industry?
Key companies in the market include Comet Group Limited, Nikon Corporation, Thermo Fisher Scientific Inc, Hitachi Ltd, 3DX-Ray Limited, Zeiss International, Omron Corporation, Waygate Technologies, Bruker Corporation, Shimadzu Corporation.
3. What are the main segments of the Industrial CT Scanning Industry?
The market segments include Application, End-user Industry.
4. Can you provide details about the market size?
The market size is estimated to be USD 502.00 Million as of 2022.
5. What are some drivers contributing to market growth?
Technology Improvements in Resolution and Image Processing; Intensifying Demand for Portable Radiography Equipment.
6. What are the notable trends driving market growth?
Aerospace Industry to Drive the Industrial Computed Tomography Market.
7. Are there any restraints impacting market growth?
High Acquisition and Maintenace Cost of Industrial CT systems.
8. Can you provide examples of recent developments in the market?
March 2021 - ZEISS introduced ZEISS Xradia CrystalCT micro-computed tomography (microCT) system to enable 3D crystallographic imaging of polycrystalline materials for a wide range of metal and alloy, additive manufacturing, ceramic, and pharmaceutical samples in industrial and academic laboratories.
9. What pricing options are available for accessing the report?
Pricing options include single-user, multi-user, and enterprise licenses priced at USD 4750, USD 5250, and USD 8750 respectively.
10. Is the market size provided in terms of value or volume?
The market size is provided in terms of value, measured in Million and volume, measured in K Unit.
11. Are there any specific market keywords associated with the report?
Yes, the market keyword associated with the report is "Industrial CT Scanning Industry," which aids in identifying and referencing the specific market segment covered.
12. How do I determine which pricing option suits my needs best?
The pricing options vary based on user requirements and access needs. Individual users may opt for single-user licenses, while businesses requiring broader access may choose multi-user or enterprise licenses for cost-effective access to the report.
13. Are there any additional resources or data provided in the Industrial CT Scanning Industry report?
While the report offers comprehensive insights, it's advisable to review the specific contents or supplementary materials provided to ascertain if additional resources or data are available.
14. How can I stay updated on further developments or reports in the Industrial CT Scanning Industry?
To stay informed about further developments, trends, and reports in the Industrial CT Scanning Industry, consider subscribing to industry newsletters, following relevant companies and organizations, or regularly checking reputable industry news sources and publications.
Methodology
Step 1 - Identification of Relevant Samples Size from Population Database


Step 2 - Approaches for Defining Global Market Size (Value, Volume* & Price*)

Note*: In applicable scenarios
Step 3 - Data Sources
Primary Research
- Web Analytics
- Survey Reports
- Research Institute
- Latest Research Reports
- Opinion Leaders
Secondary Research
- Annual Reports
- White Paper
- Latest Press Release
- Industry Association
- Paid Database
- Investor Presentations

Step 4 - Data Triangulation
Involves using different sources of information in order to increase the validity of a study
These sources are likely to be stakeholders in a program - participants, other researchers, program staff, other community members, and so on.
Then we put all data in single framework & apply various statistical tools to find out the dynamic on the market.
During the analysis stage, feedback from the stakeholder groups would be compared to determine areas of agreement as well as areas of divergence
