

Key Insights
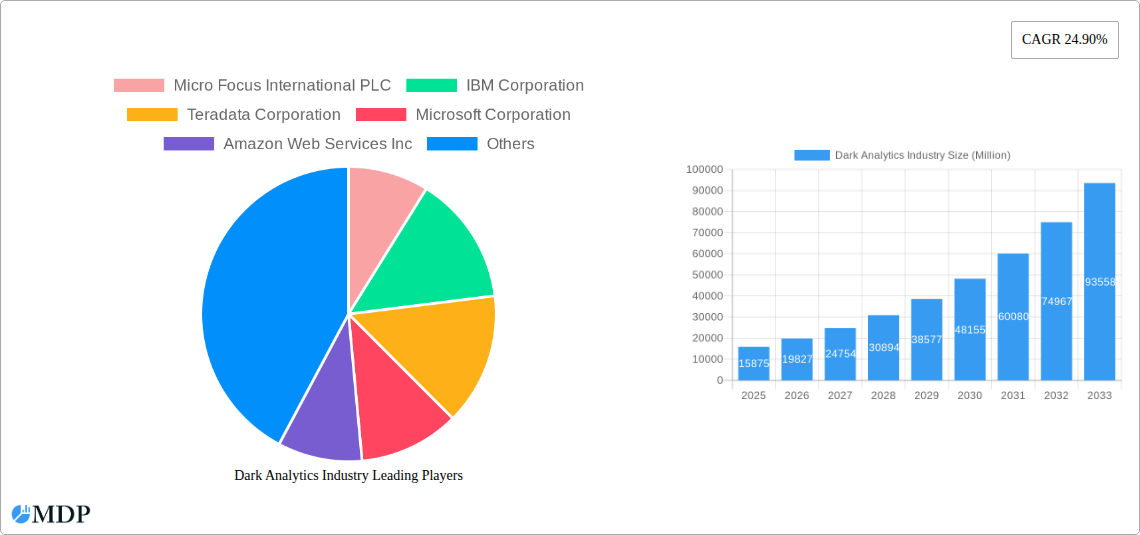
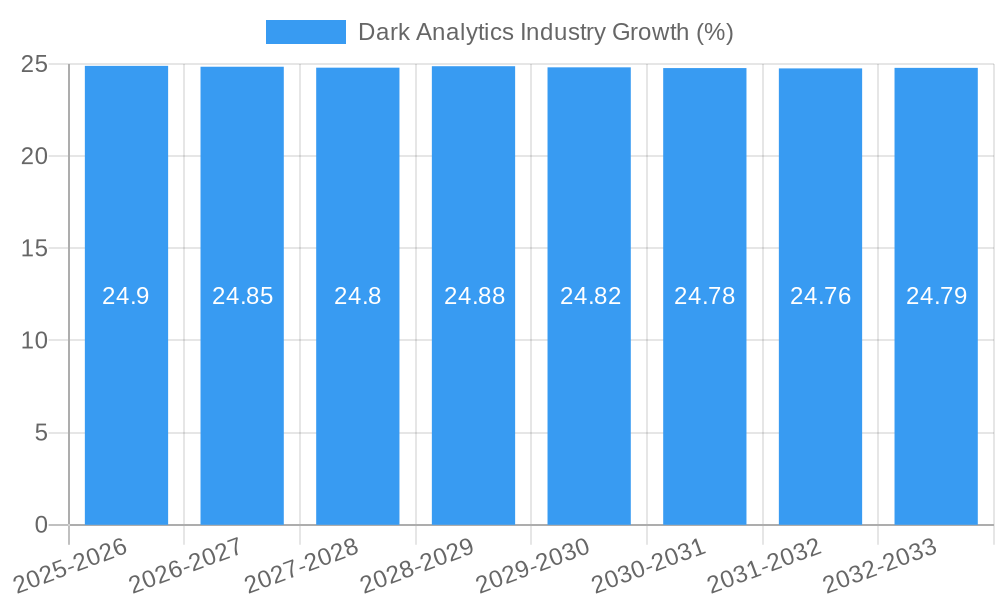
The global Dark Analytics market is poised for extraordinary expansion, projected to reach an estimated $15,875 million by 2025. Fueled by a remarkable Compound Annual Growth Rate (CAGR) of 24.90% over the forecast period of 2025-2033, this sector signifies a critical shift in how organizations leverage previously untapped data for strategic advantage. Key drivers behind this surge include the escalating volume and complexity of unstructured and semi-structured data, alongside a growing imperative for advanced insights in areas such as fraud detection, customer churn prediction, and risk management across diverse industries. The increasing adoption of AI and machine learning technologies further empowers businesses to unlock the value hidden within this "dark data," enabling more sophisticated predictive and prescriptive analytics. This intelligence is becoming indispensable for maintaining competitive differentiation and operational efficiency.
The market's growth trajectory is significantly influenced by the increasing demand for advanced analytical capabilities across major end-user verticals. The BFSI sector, for instance, is a major adopter, utilizing dark analytics for credit risk assessment, anti-money laundering efforts, and personalized customer offerings. Similarly, the healthcare industry leverages these insights for drug discovery, patient outcome prediction, and personalized medicine. Telecommunications companies are employing dark analytics to optimize network performance, predict customer behavior, and enhance service delivery. While the potential for dark analytics is immense, challenges such as data privacy concerns, regulatory compliance, and the need for specialized talent can act as restraints. However, innovative solutions and a growing understanding of data governance are steadily mitigating these hurdles, paving the way for widespread integration of dark analytics into core business strategies.
Dive deep into the burgeoning Dark Analytics Industry with this comprehensive report, meticulously crafted to illuminate market dynamics, innovation, and growth trajectories. Covering the Study Period 2019–2033, with a Base Year and Estimated Year of 2025, and a robust Forecast Period of 2025–2033, this analysis dissects the Historical Period of 2019–2024. Discover actionable insights into predictive analytics, prescriptive analytics, and descriptive analytics, driven by demand across BFSI, Healthcare, Government, Telecommunications, and Retail & E-commerce verticals. This indispensable resource provides market participants with a strategic roadmap to navigate the evolving landscape of dark data utilization.
Dark Analytics Industry Market Dynamics & Concentration
The Dark Analytics Industry is characterized by a dynamic and evolving market concentration. Innovation drivers, such as the escalating volume of unstructured and semi-structured data, are compelling organizations to invest in advanced analytics solutions. Regulatory frameworks, while presenting compliance challenges, are also fostering a demand for enhanced data governance and security within dark data utilization. Product substitutes, though limited given the niche nature of dark data, are emerging in the form of specialized AI and machine learning platforms designed for data discovery. End-user trends show a significant shift towards proactive data exploitation, moving beyond traditional structured data analysis. Mergers and Acquisitions (M&A) activities are on the rise, indicating a consolidation phase as larger players seek to acquire niche capabilities and expand their market share. Anticipate an increasing number of strategic partnerships to leverage complementary technologies and market reach. The market share of leading providers is expected to fluctuate as new entrants bring innovative solutions to the forefront. Estimated M&A deal counts are projected to reach xx in the coming years, signaling a robust investment appetite.
- Market Concentration: Fragmented with emerging leaders, increasing consolidation expected.
- Innovation Drivers: Unstructured data growth, AI/ML advancements, need for competitive advantage.
- Regulatory Frameworks: Growing importance of data privacy and security compliance, driving specialized solutions.
- Product Substitutes: Specialized AI/ML platforms, advanced data discovery tools.
- End-User Trends: Shift from reactive to proactive data utilization, demand for actionable insights from all data sources.
- M&A Activities: Increasing, driven by the need for integrated solutions and market expansion.
Dark Analytics Industry Industry Trends & Analysis
The Dark Analytics Industry is experiencing exponential growth, fueled by a confluence of technological advancements and evolving business needs. The primary market growth driver is the sheer volume of dark data—information that organizations collect but do not actively use—which is estimated to reach over xx Petabytes globally. Leveraging this untapped resource presents unparalleled opportunities for uncovering hidden patterns, predicting future outcomes, and optimizing operational efficiencies. Technological disruptions, particularly in the realm of Artificial Intelligence (AI) and Machine Learning (ML), are pivotal. These technologies enable the sophisticated processing and analysis of unstructured data formats like text, images, and audio, which constitute a significant portion of dark data. Natural Language Processing (NLP) and Computer Vision are key enablers in this context, allowing for the extraction of meaningful insights from previously inaccessible data silos. Consumer preferences are increasingly dictating the need for personalized experiences and hyper-targeted marketing, which can only be achieved through a deeper understanding of customer behavior derived from all available data, including dark data. The competitive dynamics within the industry are intensifying, with established technology giants and agile startups vying for market dominance. Companies are recognizing that the strategic utilization of dark data is no longer a differentiator but a necessity for survival and growth. The market penetration of dark analytics solutions is still in its nascent stages, signifying substantial room for expansion. The Compound Annual Growth Rate (CAGR) for the dark analytics market is projected to be an impressive xx% over the forecast period, underscoring its significant potential. The adoption of cloud-based analytics platforms is further accelerating this trend, offering scalability and accessibility for processing vast datasets. The development of specialized algorithms for anomaly detection and sentiment analysis within dark data repositories is a key area of innovation. Furthermore, the integration of dark analytics with existing business intelligence tools is creating more holistic data ecosystems.
Leading Markets & Segments in Dark Analytics Industry
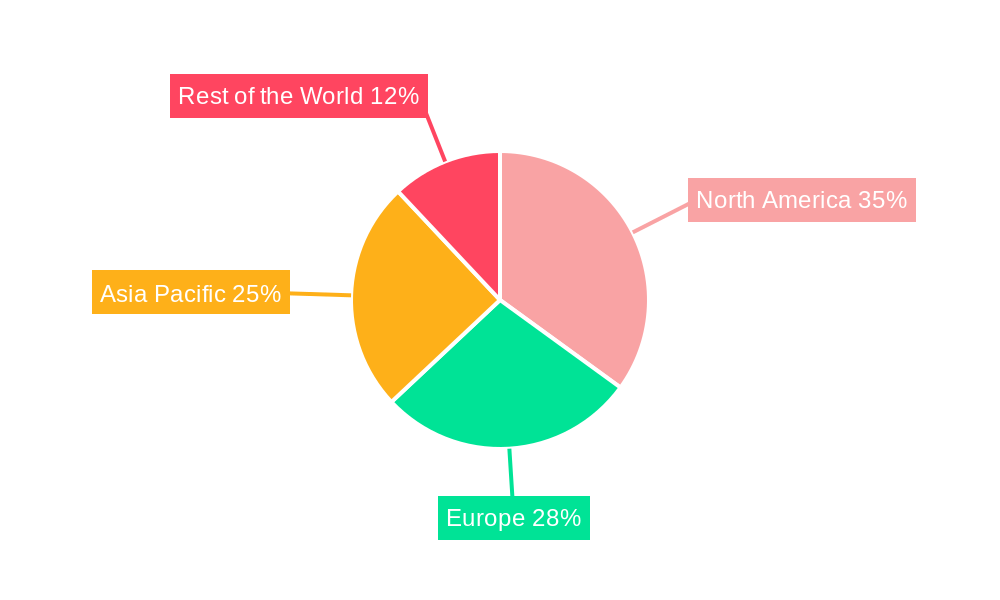
The North America region is poised to dominate the Dark Analytics Industry, driven by robust technological infrastructure, a high concentration of innovative enterprises, and significant investment in AI and ML research. Within North America, the United States stands out as the leading country due to its established tech giants, venture capital ecosystem, and a forward-thinking approach to data monetization. Among the Types of Analytics, Predictive Analytics is emerging as the most influential segment, allowing businesses to forecast future trends, customer behavior, and market shifts with unprecedented accuracy. This is closely followed by Prescriptive Analytics, which offers actionable recommendations to optimize decision-making.
The BFSI (Banking, Financial Services, and Insurance) sector is projected to be the largest End-user Vertical, driven by the imperative to combat fraud, personalize customer offerings, manage risk effectively, and comply with stringent regulations. The ability to analyze vast amounts of transactional and behavioral data, often residing in dark data repositories, is critical for BFSI institutions.
- Dominant Region: North America, particularly the United States.
- Key Drivers: Advanced technological infrastructure, strong R&D investment, significant presence of data-intensive industries, supportive venture capital landscape.
- Leading Country: United States.
- Dominance Analysis: Home to major technology innovators and a mature market for data-driven solutions.
- Leading Segment (Type of Analytics): Predictive Analytics.
- Key Drivers: Demand for forecasting, risk assessment, fraud detection, customer churn prediction, market trend analysis.
- Dominance Analysis: Enables proactive decision-making and competitive advantage through foresight.
- Leading Segment (End-user Vertical): BFSI.
- Key Drivers: Stringent regulatory requirements, massive data volumes, need for fraud prevention, personalized customer experiences, risk management.
- Dominance Analysis: Critical for optimizing operations, enhancing security, and improving customer loyalty.
Other significant end-user verticals include Healthcare, where dark data can unlock insights into patient outcomes and disease prediction, and Telecommunications, for network optimization and customer segmentation. Retail & E-commerce is also a major beneficiary, leveraging dark data for personalized marketing and inventory management.
Dark Analytics Industry Product Developments
Product developments in the Dark Analytics Industry are increasingly focused on enhancing the accessibility and actionable nature of dark data. Innovations are centered around advanced AI and ML algorithms that can automatically discover, classify, and analyze unstructured and semi-structured data sources. Key trends include the development of intuitive interfaces for data scientists and business analysts, enabling them to query and derive insights from diverse data lakes and warehouses without extensive technical expertise. Competitive advantages are being gained through solutions that offer real-time processing capabilities, robust data governance features, and seamless integration with existing enterprise systems. The market fit is being enhanced by solutions tailored to specific industry needs, such as fraud detection in BFSI or patient outcome prediction in healthcare.
Key Drivers of Dark Analytics Industry Growth
The Dark Analytics Industry is propelled by several potent growth drivers. The exponential increase in data generation, much of which remains unutilized, is a primary catalyst. Advancements in AI and Machine Learning are democratizing the analysis of complex, unstructured data formats. The growing imperative for businesses to gain a competitive edge through deeper customer understanding and operational efficiency necessitates the exploration of all available data sources. Furthermore, the increasing adoption of cloud computing provides the scalable infrastructure required for processing massive dark data volumes. Regulatory pressures in sectors like BFSI and Healthcare are also indirectly driving the adoption of analytics solutions that can ensure compliance and enhance security by understanding all data touchpoints.
Challenges in the Dark Analytics Industry Market
Despite its immense potential, the Dark Analytics Industry faces significant challenges. Regulatory hurdles, particularly concerning data privacy and consent management for sensitive dark data, can impede adoption. The complexity of data integration from disparate and often siloed sources presents a substantial technical challenge. The shortage of skilled data scientists and analysts capable of working with specialized dark data analytics tools also limits market penetration. Furthermore, the perceived cost and return on investment for dark data initiatives can be a barrier for some organizations, especially smaller enterprises. Cybersecurity threats targeting these vast data repositories also pose a considerable risk.
Emerging Opportunities in Dark Analytics Industry
Emerging opportunities in the Dark Analytics Industry are largely driven by technological breakthroughs and strategic market expansion. The continuous evolution of AI and ML, particularly in areas like explainable AI (XAI), is making dark data insights more transparent and trustworthy. The development of specialized data marketplaces and platforms that facilitate the ethical sharing and monetization of dark data is creating new revenue streams. Strategic partnerships between analytics providers, cloud infrastructure companies, and industry-specific software vendors are enabling more comprehensive and integrated solutions. Furthermore, the expanding global reach of businesses and the increasing data regulation across different regions present opportunities for tailored dark analytics solutions that cater to localized compliance and business needs.
Leading Players in the Dark Analytics Industry Sector
- Micro Focus International PLC
- IBM Corporation
- Teradata Corporation
- Microsoft Corporation
- Amazon Web Services Inc
- SAS Institute
- Hewlett-Packard Enterprise Company
- Oracle Corporation
- SAP SE
Key Milestones in Dark Analytics Industry Industry
- November 2022: Cloudera introduced the Cloudera Partner Network, a program designed to reward partners for their go-to-market contributions and expose customers to contemporary data techniques built on the Cloudera hybrid data platform, including marketing automation and asset libraries. This milestone signifies a growing ecosystem approach to enabling advanced data utilization.
- February 2023: N-iX achieved Amazon Redshift and Amazon EMR Service Delivery Designation, highlighting their expertise in big data analytics application development and deployment on cloud platforms. Their successful project with an in-flight connectivity and entertainment supplier, involving the migration of a data solution to the cloud and the creation of an Amazon data platform collecting data from over 20 sources, demonstrates practical application and the increasing reliance on cloud-based big data frameworks.
Strategic Outlook for Dark Analytics Industry Market
The strategic outlook for the Dark Analytics Industry is exceptionally positive, driven by the increasing recognition of dark data as a critical untapped asset. Future growth accelerators will stem from advancements in AI-powered data discovery and automated insight generation. The trend towards federated learning and privacy-preserving analytics will further enable the utilization of sensitive dark data. Strategic opportunities lie in developing industry-specific dark data solutions, fostering robust data governance frameworks, and building strong partner ecosystems. The market's expansion will also be fueled by the growing demand for hyper-personalization in customer engagement and the need for sophisticated risk management in an increasingly complex global landscape.
Dark Analytics Industry Segmentation
-
1. Type of Analytics
- 1.1. Predictive
- 1.2. Prescriptive
- 1.3. Descriptive
-
2. End-user Vertical
- 2.1. BFSI
- 2.2. Healthcare
- 2.3. Government
- 2.4. Telecommunications
- 2.5. Retail & E-commerce
- 2.6. Other End-user Verticals
Dark Analytics Industry Segmentation By Geography
-
1. North America
- 1.1. United States
- 1.2. Canada
-
2. Europe
- 2.1. United Kingdom
- 2.2. Germany
- 2.3. Rest of Europe
-
3. Asia Pacific
- 3.1. China
- 3.2. Japan
- 3.3. Australia
- 3.4. Rest of Asia Pacific
-
4. Rest of the World
- 4.1. Latin America
- 4.2. Middl East
Dark Analytics Industry REPORT HIGHLIGHTS
| Aspects | Details |
|---|---|
| Study Period | 2019-2033 |
| Base Year | 2024 |
| Estimated Year | 2025 |
| Forecast Period | 2025-2033 |
| Historical Period | 2019-2024 |
| Growth Rate | CAGR of 24.90% from 2019-2033 |
| Segmentation |
|
Table of Contents
- 1. Introduction
- 1.1. Research Scope
- 1.2. Market Segmentation
- 1.3. Research Methodology
- 1.4. Definitions and Assumptions
- 2. Executive Summary
- 2.1. Introduction
- 3. Market Dynamics
- 3.1. Introduction
- 3.2. Market Drivers
- 3.2.1. Increasing Adoption Rates of Machine Learning and Artificial Intelligence; Rapid Growth in Generated Data Volume and Variety Owing to Adoption of IoT
- 3.3. Market Restrains
- 3.3.1. Security Concerns
- 3.4. Market Trends
- 3.4.1. Retail and E-commerce to Hold Significant Growth
- 4. Market Factor Analysis
- 4.1. Porters Five Forces
- 4.2. Supply/Value Chain
- 4.3. PESTEL analysis
- 4.4. Market Entropy
- 4.5. Patent/Trademark Analysis
- 5. Global Dark Analytics Industry Analysis, Insights and Forecast, 2019-2031
- 5.1. Market Analysis, Insights and Forecast - by Type of Analytics
- 5.1.1. Predictive
- 5.1.2. Prescriptive
- 5.1.3. Descriptive
- 5.2. Market Analysis, Insights and Forecast - by End-user Vertical
- 5.2.1. BFSI
- 5.2.2. Healthcare
- 5.2.3. Government
- 5.2.4. Telecommunications
- 5.2.5. Retail & E-commerce
- 5.2.6. Other End-user Verticals
- 5.3. Market Analysis, Insights and Forecast - by Region
- 5.3.1. North America
- 5.3.2. Europe
- 5.3.3. Asia Pacific
- 5.3.4. Rest of the World
- 5.1. Market Analysis, Insights and Forecast - by Type of Analytics
- 6. North America Dark Analytics Industry Analysis, Insights and Forecast, 2019-2031
- 6.1. Market Analysis, Insights and Forecast - by Type of Analytics
- 6.1.1. Predictive
- 6.1.2. Prescriptive
- 6.1.3. Descriptive
- 6.2. Market Analysis, Insights and Forecast - by End-user Vertical
- 6.2.1. BFSI
- 6.2.2. Healthcare
- 6.2.3. Government
- 6.2.4. Telecommunications
- 6.2.5. Retail & E-commerce
- 6.2.6. Other End-user Verticals
- 6.1. Market Analysis, Insights and Forecast - by Type of Analytics
- 7. Europe Dark Analytics Industry Analysis, Insights and Forecast, 2019-2031
- 7.1. Market Analysis, Insights and Forecast - by Type of Analytics
- 7.1.1. Predictive
- 7.1.2. Prescriptive
- 7.1.3. Descriptive
- 7.2. Market Analysis, Insights and Forecast - by End-user Vertical
- 7.2.1. BFSI
- 7.2.2. Healthcare
- 7.2.3. Government
- 7.2.4. Telecommunications
- 7.2.5. Retail & E-commerce
- 7.2.6. Other End-user Verticals
- 7.1. Market Analysis, Insights and Forecast - by Type of Analytics
- 8. Asia Pacific Dark Analytics Industry Analysis, Insights and Forecast, 2019-2031
- 8.1. Market Analysis, Insights and Forecast - by Type of Analytics
- 8.1.1. Predictive
- 8.1.2. Prescriptive
- 8.1.3. Descriptive
- 8.2. Market Analysis, Insights and Forecast - by End-user Vertical
- 8.2.1. BFSI
- 8.2.2. Healthcare
- 8.2.3. Government
- 8.2.4. Telecommunications
- 8.2.5. Retail & E-commerce
- 8.2.6. Other End-user Verticals
- 8.1. Market Analysis, Insights and Forecast - by Type of Analytics
- 9. Rest of the World Dark Analytics Industry Analysis, Insights and Forecast, 2019-2031
- 9.1. Market Analysis, Insights and Forecast - by Type of Analytics
- 9.1.1. Predictive
- 9.1.2. Prescriptive
- 9.1.3. Descriptive
- 9.2. Market Analysis, Insights and Forecast - by End-user Vertical
- 9.2.1. BFSI
- 9.2.2. Healthcare
- 9.2.3. Government
- 9.2.4. Telecommunications
- 9.2.5. Retail & E-commerce
- 9.2.6. Other End-user Verticals
- 9.1. Market Analysis, Insights and Forecast - by Type of Analytics
- 10. North America Dark Analytics Industry Analysis, Insights and Forecast, 2019-2031
- 10.1. Market Analysis, Insights and Forecast - By Country/Sub-region
- 10.1.1 United States
- 10.1.2 Canada
- 10.1.3 Mexico
- 11. Europe Dark Analytics Industry Analysis, Insights and Forecast, 2019-2031
- 11.1. Market Analysis, Insights and Forecast - By Country/Sub-region
- 11.1.1 Germany
- 11.1.2 United Kingdom
- 11.1.3 France
- 11.1.4 Spain
- 11.1.5 Italy
- 11.1.6 Spain
- 11.1.7 Belgium
- 11.1.8 Netherland
- 11.1.9 Nordics
- 11.1.10 Rest of Europe
- 12. Asia Pacific Dark Analytics Industry Analysis, Insights and Forecast, 2019-2031
- 12.1. Market Analysis, Insights and Forecast - By Country/Sub-region
- 12.1.1 China
- 12.1.2 Japan
- 12.1.3 India
- 12.1.4 South Korea
- 12.1.5 Southeast Asia
- 12.1.6 Australia
- 12.1.7 Indonesia
- 12.1.8 Phillipes
- 12.1.9 Singapore
- 12.1.10 Thailandc
- 12.1.11 Rest of Asia Pacific
- 13. South America Dark Analytics Industry Analysis, Insights and Forecast, 2019-2031
- 13.1. Market Analysis, Insights and Forecast - By Country/Sub-region
- 13.1.1 Brazil
- 13.1.2 Argentina
- 13.1.3 Peru
- 13.1.4 Chile
- 13.1.5 Colombia
- 13.1.6 Ecuador
- 13.1.7 Venezuela
- 13.1.8 Rest of South America
- 14. North America Dark Analytics Industry Analysis, Insights and Forecast, 2019-2031
- 14.1. Market Analysis, Insights and Forecast - By Country/Sub-region
- 14.1.1 United States
- 14.1.2 Canada
- 14.1.3 Mexico
- 15. MEA Dark Analytics Industry Analysis, Insights and Forecast, 2019-2031
- 15.1. Market Analysis, Insights and Forecast - By Country/Sub-region
- 15.1.1 United Arab Emirates
- 15.1.2 Saudi Arabia
- 15.1.3 South Africa
- 15.1.4 Rest of Middle East and Africa
- 16. Competitive Analysis
- 16.1. Global Market Share Analysis 2024
- 16.2. Company Profiles
- 16.2.1 Micro Focus International PLC
- 16.2.1.1. Overview
- 16.2.1.2. Products
- 16.2.1.3. SWOT Analysis
- 16.2.1.4. Recent Developments
- 16.2.1.5. Financials (Based on Availability)
- 16.2.2 IBM Corporation
- 16.2.2.1. Overview
- 16.2.2.2. Products
- 16.2.2.3. SWOT Analysis
- 16.2.2.4. Recent Developments
- 16.2.2.5. Financials (Based on Availability)
- 16.2.3 Teradata Corporation
- 16.2.3.1. Overview
- 16.2.3.2. Products
- 16.2.3.3. SWOT Analysis
- 16.2.3.4. Recent Developments
- 16.2.3.5. Financials (Based on Availability)
- 16.2.4 Microsoft Corporation
- 16.2.4.1. Overview
- 16.2.4.2. Products
- 16.2.4.3. SWOT Analysis
- 16.2.4.4. Recent Developments
- 16.2.4.5. Financials (Based on Availability)
- 16.2.5 Amazon Web Services Inc
- 16.2.5.1. Overview
- 16.2.5.2. Products
- 16.2.5.3. SWOT Analysis
- 16.2.5.4. Recent Developments
- 16.2.5.5. Financials (Based on Availability)
- 16.2.6 SAS Institute
- 16.2.6.1. Overview
- 16.2.6.2. Products
- 16.2.6.3. SWOT Analysis
- 16.2.6.4. Recent Developments
- 16.2.6.5. Financials (Based on Availability)
- 16.2.7 Hewlett-Packard Enterprise Company
- 16.2.7.1. Overview
- 16.2.7.2. Products
- 16.2.7.3. SWOT Analysis
- 16.2.7.4. Recent Developments
- 16.2.7.5. Financials (Based on Availability)
- 16.2.8 Oracle Corporation*List Not Exhaustive
- 16.2.8.1. Overview
- 16.2.8.2. Products
- 16.2.8.3. SWOT Analysis
- 16.2.8.4. Recent Developments
- 16.2.8.5. Financials (Based on Availability)
- 16.2.9 SAP SE
- 16.2.9.1. Overview
- 16.2.9.2. Products
- 16.2.9.3. SWOT Analysis
- 16.2.9.4. Recent Developments
- 16.2.9.5. Financials (Based on Availability)
- 16.2.1 Micro Focus International PLC
List of Figures
- Figure 1: Global Dark Analytics Industry Revenue Breakdown (Million, %) by Region 2024 & 2032
- Figure 2: North America Dark Analytics Industry Revenue (Million), by Country 2024 & 2032
- Figure 3: North America Dark Analytics Industry Revenue Share (%), by Country 2024 & 2032
- Figure 4: Europe Dark Analytics Industry Revenue (Million), by Country 2024 & 2032
- Figure 5: Europe Dark Analytics Industry Revenue Share (%), by Country 2024 & 2032
- Figure 6: Asia Pacific Dark Analytics Industry Revenue (Million), by Country 2024 & 2032
- Figure 7: Asia Pacific Dark Analytics Industry Revenue Share (%), by Country 2024 & 2032
- Figure 8: South America Dark Analytics Industry Revenue (Million), by Country 2024 & 2032
- Figure 9: South America Dark Analytics Industry Revenue Share (%), by Country 2024 & 2032
- Figure 10: North America Dark Analytics Industry Revenue (Million), by Country 2024 & 2032
- Figure 11: North America Dark Analytics Industry Revenue Share (%), by Country 2024 & 2032
- Figure 12: MEA Dark Analytics Industry Revenue (Million), by Country 2024 & 2032
- Figure 13: MEA Dark Analytics Industry Revenue Share (%), by Country 2024 & 2032
- Figure 14: North America Dark Analytics Industry Revenue (Million), by Type of Analytics 2024 & 2032
- Figure 15: North America Dark Analytics Industry Revenue Share (%), by Type of Analytics 2024 & 2032
- Figure 16: North America Dark Analytics Industry Revenue (Million), by End-user Vertical 2024 & 2032
- Figure 17: North America Dark Analytics Industry Revenue Share (%), by End-user Vertical 2024 & 2032
- Figure 18: North America Dark Analytics Industry Revenue (Million), by Country 2024 & 2032
- Figure 19: North America Dark Analytics Industry Revenue Share (%), by Country 2024 & 2032
- Figure 20: Europe Dark Analytics Industry Revenue (Million), by Type of Analytics 2024 & 2032
- Figure 21: Europe Dark Analytics Industry Revenue Share (%), by Type of Analytics 2024 & 2032
- Figure 22: Europe Dark Analytics Industry Revenue (Million), by End-user Vertical 2024 & 2032
- Figure 23: Europe Dark Analytics Industry Revenue Share (%), by End-user Vertical 2024 & 2032
- Figure 24: Europe Dark Analytics Industry Revenue (Million), by Country 2024 & 2032
- Figure 25: Europe Dark Analytics Industry Revenue Share (%), by Country 2024 & 2032
- Figure 26: Asia Pacific Dark Analytics Industry Revenue (Million), by Type of Analytics 2024 & 2032
- Figure 27: Asia Pacific Dark Analytics Industry Revenue Share (%), by Type of Analytics 2024 & 2032
- Figure 28: Asia Pacific Dark Analytics Industry Revenue (Million), by End-user Vertical 2024 & 2032
- Figure 29: Asia Pacific Dark Analytics Industry Revenue Share (%), by End-user Vertical 2024 & 2032
- Figure 30: Asia Pacific Dark Analytics Industry Revenue (Million), by Country 2024 & 2032
- Figure 31: Asia Pacific Dark Analytics Industry Revenue Share (%), by Country 2024 & 2032
- Figure 32: Rest of the World Dark Analytics Industry Revenue (Million), by Type of Analytics 2024 & 2032
- Figure 33: Rest of the World Dark Analytics Industry Revenue Share (%), by Type of Analytics 2024 & 2032
- Figure 34: Rest of the World Dark Analytics Industry Revenue (Million), by End-user Vertical 2024 & 2032
- Figure 35: Rest of the World Dark Analytics Industry Revenue Share (%), by End-user Vertical 2024 & 2032
- Figure 36: Rest of the World Dark Analytics Industry Revenue (Million), by Country 2024 & 2032
- Figure 37: Rest of the World Dark Analytics Industry Revenue Share (%), by Country 2024 & 2032
List of Tables
- Table 1: Global Dark Analytics Industry Revenue Million Forecast, by Region 2019 & 2032
- Table 2: Global Dark Analytics Industry Revenue Million Forecast, by Type of Analytics 2019 & 2032
- Table 3: Global Dark Analytics Industry Revenue Million Forecast, by End-user Vertical 2019 & 2032
- Table 4: Global Dark Analytics Industry Revenue Million Forecast, by Region 2019 & 2032
- Table 5: Global Dark Analytics Industry Revenue Million Forecast, by Country 2019 & 2032
- Table 6: United States Dark Analytics Industry Revenue (Million) Forecast, by Application 2019 & 2032
- Table 7: Canada Dark Analytics Industry Revenue (Million) Forecast, by Application 2019 & 2032
- Table 8: Mexico Dark Analytics Industry Revenue (Million) Forecast, by Application 2019 & 2032
- Table 9: Global Dark Analytics Industry Revenue Million Forecast, by Country 2019 & 2032
- Table 10: Germany Dark Analytics Industry Revenue (Million) Forecast, by Application 2019 & 2032
- Table 11: United Kingdom Dark Analytics Industry Revenue (Million) Forecast, by Application 2019 & 2032
- Table 12: France Dark Analytics Industry Revenue (Million) Forecast, by Application 2019 & 2032
- Table 13: Spain Dark Analytics Industry Revenue (Million) Forecast, by Application 2019 & 2032
- Table 14: Italy Dark Analytics Industry Revenue (Million) Forecast, by Application 2019 & 2032
- Table 15: Spain Dark Analytics Industry Revenue (Million) Forecast, by Application 2019 & 2032
- Table 16: Belgium Dark Analytics Industry Revenue (Million) Forecast, by Application 2019 & 2032
- Table 17: Netherland Dark Analytics Industry Revenue (Million) Forecast, by Application 2019 & 2032
- Table 18: Nordics Dark Analytics Industry Revenue (Million) Forecast, by Application 2019 & 2032
- Table 19: Rest of Europe Dark Analytics Industry Revenue (Million) Forecast, by Application 2019 & 2032
- Table 20: Global Dark Analytics Industry Revenue Million Forecast, by Country 2019 & 2032
- Table 21: China Dark Analytics Industry Revenue (Million) Forecast, by Application 2019 & 2032
- Table 22: Japan Dark Analytics Industry Revenue (Million) Forecast, by Application 2019 & 2032
- Table 23: India Dark Analytics Industry Revenue (Million) Forecast, by Application 2019 & 2032
- Table 24: South Korea Dark Analytics Industry Revenue (Million) Forecast, by Application 2019 & 2032
- Table 25: Southeast Asia Dark Analytics Industry Revenue (Million) Forecast, by Application 2019 & 2032
- Table 26: Australia Dark Analytics Industry Revenue (Million) Forecast, by Application 2019 & 2032
- Table 27: Indonesia Dark Analytics Industry Revenue (Million) Forecast, by Application 2019 & 2032
- Table 28: Phillipes Dark Analytics Industry Revenue (Million) Forecast, by Application 2019 & 2032
- Table 29: Singapore Dark Analytics Industry Revenue (Million) Forecast, by Application 2019 & 2032
- Table 30: Thailandc Dark Analytics Industry Revenue (Million) Forecast, by Application 2019 & 2032
- Table 31: Rest of Asia Pacific Dark Analytics Industry Revenue (Million) Forecast, by Application 2019 & 2032
- Table 32: Global Dark Analytics Industry Revenue Million Forecast, by Country 2019 & 2032
- Table 33: Brazil Dark Analytics Industry Revenue (Million) Forecast, by Application 2019 & 2032
- Table 34: Argentina Dark Analytics Industry Revenue (Million) Forecast, by Application 2019 & 2032
- Table 35: Peru Dark Analytics Industry Revenue (Million) Forecast, by Application 2019 & 2032
- Table 36: Chile Dark Analytics Industry Revenue (Million) Forecast, by Application 2019 & 2032
- Table 37: Colombia Dark Analytics Industry Revenue (Million) Forecast, by Application 2019 & 2032
- Table 38: Ecuador Dark Analytics Industry Revenue (Million) Forecast, by Application 2019 & 2032
- Table 39: Venezuela Dark Analytics Industry Revenue (Million) Forecast, by Application 2019 & 2032
- Table 40: Rest of South America Dark Analytics Industry Revenue (Million) Forecast, by Application 2019 & 2032
- Table 41: Global Dark Analytics Industry Revenue Million Forecast, by Country 2019 & 2032
- Table 42: United States Dark Analytics Industry Revenue (Million) Forecast, by Application 2019 & 2032
- Table 43: Canada Dark Analytics Industry Revenue (Million) Forecast, by Application 2019 & 2032
- Table 44: Mexico Dark Analytics Industry Revenue (Million) Forecast, by Application 2019 & 2032
- Table 45: Global Dark Analytics Industry Revenue Million Forecast, by Country 2019 & 2032
- Table 46: United Arab Emirates Dark Analytics Industry Revenue (Million) Forecast, by Application 2019 & 2032
- Table 47: Saudi Arabia Dark Analytics Industry Revenue (Million) Forecast, by Application 2019 & 2032
- Table 48: South Africa Dark Analytics Industry Revenue (Million) Forecast, by Application 2019 & 2032
- Table 49: Rest of Middle East and Africa Dark Analytics Industry Revenue (Million) Forecast, by Application 2019 & 2032
- Table 50: Global Dark Analytics Industry Revenue Million Forecast, by Type of Analytics 2019 & 2032
- Table 51: Global Dark Analytics Industry Revenue Million Forecast, by End-user Vertical 2019 & 2032
- Table 52: Global Dark Analytics Industry Revenue Million Forecast, by Country 2019 & 2032
- Table 53: United States Dark Analytics Industry Revenue (Million) Forecast, by Application 2019 & 2032
- Table 54: Canada Dark Analytics Industry Revenue (Million) Forecast, by Application 2019 & 2032
- Table 55: Global Dark Analytics Industry Revenue Million Forecast, by Type of Analytics 2019 & 2032
- Table 56: Global Dark Analytics Industry Revenue Million Forecast, by End-user Vertical 2019 & 2032
- Table 57: Global Dark Analytics Industry Revenue Million Forecast, by Country 2019 & 2032
- Table 58: United Kingdom Dark Analytics Industry Revenue (Million) Forecast, by Application 2019 & 2032
- Table 59: Germany Dark Analytics Industry Revenue (Million) Forecast, by Application 2019 & 2032
- Table 60: Rest of Europe Dark Analytics Industry Revenue (Million) Forecast, by Application 2019 & 2032
- Table 61: Global Dark Analytics Industry Revenue Million Forecast, by Type of Analytics 2019 & 2032
- Table 62: Global Dark Analytics Industry Revenue Million Forecast, by End-user Vertical 2019 & 2032
- Table 63: Global Dark Analytics Industry Revenue Million Forecast, by Country 2019 & 2032
- Table 64: China Dark Analytics Industry Revenue (Million) Forecast, by Application 2019 & 2032
- Table 65: Japan Dark Analytics Industry Revenue (Million) Forecast, by Application 2019 & 2032
- Table 66: Australia Dark Analytics Industry Revenue (Million) Forecast, by Application 2019 & 2032
- Table 67: Rest of Asia Pacific Dark Analytics Industry Revenue (Million) Forecast, by Application 2019 & 2032
- Table 68: Global Dark Analytics Industry Revenue Million Forecast, by Type of Analytics 2019 & 2032
- Table 69: Global Dark Analytics Industry Revenue Million Forecast, by End-user Vertical 2019 & 2032
- Table 70: Global Dark Analytics Industry Revenue Million Forecast, by Country 2019 & 2032
- Table 71: Latin America Dark Analytics Industry Revenue (Million) Forecast, by Application 2019 & 2032
- Table 72: Middl East Dark Analytics Industry Revenue (Million) Forecast, by Application 2019 & 2032
Frequently Asked Questions
1. What is the projected Compound Annual Growth Rate (CAGR) of the Dark Analytics Industry?
The projected CAGR is approximately 24.90%.
2. Which companies are prominent players in the Dark Analytics Industry?
Key companies in the market include Micro Focus International PLC, IBM Corporation, Teradata Corporation, Microsoft Corporation, Amazon Web Services Inc, SAS Institute, Hewlett-Packard Enterprise Company, Oracle Corporation*List Not Exhaustive, SAP SE.
3. What are the main segments of the Dark Analytics Industry?
The market segments include Type of Analytics, End-user Vertical.
4. Can you provide details about the market size?
The market size is estimated to be USD XX Million as of 2022.
5. What are some drivers contributing to market growth?
Increasing Adoption Rates of Machine Learning and Artificial Intelligence; Rapid Growth in Generated Data Volume and Variety Owing to Adoption of IoT.
6. What are the notable trends driving market growth?
Retail and E-commerce to Hold Significant Growth.
7. Are there any restraints impacting market growth?
Security Concerns.
8. Can you provide examples of recent developments in the market?
November 2022: The hybrid data company, Cloudera, has introduced a program called the Cloudera Partner Network that pays and honors partners for their role in the firm's go-to-market performance. Customers participating in this program will become familiar with contemporary data techniques built on the Cloudera hybrid data platform. The participants will use cutting-edge solutions, including the easy-to-use Marketing Automation Platform and Asset Library.
9. What pricing options are available for accessing the report?
Pricing options include single-user, multi-user, and enterprise licenses priced at USD 4750, USD 5250, and USD 8750 respectively.
10. Is the market size provided in terms of value or volume?
The market size is provided in terms of value, measured in Million.
11. Are there any specific market keywords associated with the report?
Yes, the market keyword associated with the report is "Dark Analytics Industry," which aids in identifying and referencing the specific market segment covered.
12. How do I determine which pricing option suits my needs best?
The pricing options vary based on user requirements and access needs. Individual users may opt for single-user licenses, while businesses requiring broader access may choose multi-user or enterprise licenses for cost-effective access to the report.
13. Are there any additional resources or data provided in the Dark Analytics Industry report?
While the report offers comprehensive insights, it's advisable to review the specific contents or supplementary materials provided to ascertain if additional resources or data are available.
14. How can I stay updated on further developments or reports in the Dark Analytics Industry?
To stay informed about further developments, trends, and reports in the Dark Analytics Industry, consider subscribing to industry newsletters, following relevant companies and organizations, or regularly checking reputable industry news sources and publications.
Methodology
Step 1 - Identification of Relevant Samples Size from Population Database


Step 2 - Approaches for Defining Global Market Size (Value, Volume* & Price*)

Note*: In applicable scenarios
Step 3 - Data Sources
Primary Research
- Web Analytics
- Survey Reports
- Research Institute
- Latest Research Reports
- Opinion Leaders
Secondary Research
- Annual Reports
- White Paper
- Latest Press Release
- Industry Association
- Paid Database
- Investor Presentations

Step 4 - Data Triangulation
Involves using different sources of information in order to increase the validity of a study
These sources are likely to be stakeholders in a program - participants, other researchers, program staff, other community members, and so on.
Then we put all data in single framework & apply various statistical tools to find out the dynamic on the market.
During the analysis stage, feedback from the stakeholder groups would be compared to determine areas of agreement as well as areas of divergence
