

Key Insights
The Asia Pacific Industrial Computed Tomography (ICT) market is demonstrating substantial expansion, propelled by its increasing integration across critical industries such as aerospace, automotive, and electronics. This growth is underpinned by the region's robust manufacturing infrastructure and the escalating demand for advanced quality assurance and non-destructive testing (NDT) methodologies. With a projected CAGR of 19.04%, the market is anticipated to reach a size of $536 million by the base year of 2025. Technological advancements in ICT, delivering enhanced imaging resolution and accelerated scanning capabilities, are further stimulating adoption by offering more efficient and cost-effective solutions for defect analysis, failure assessment, and assembly verification. Leading market participants, including Comet Group, Nikon, and Zeiss, are actively driving this progress through innovation and strategic alliances.
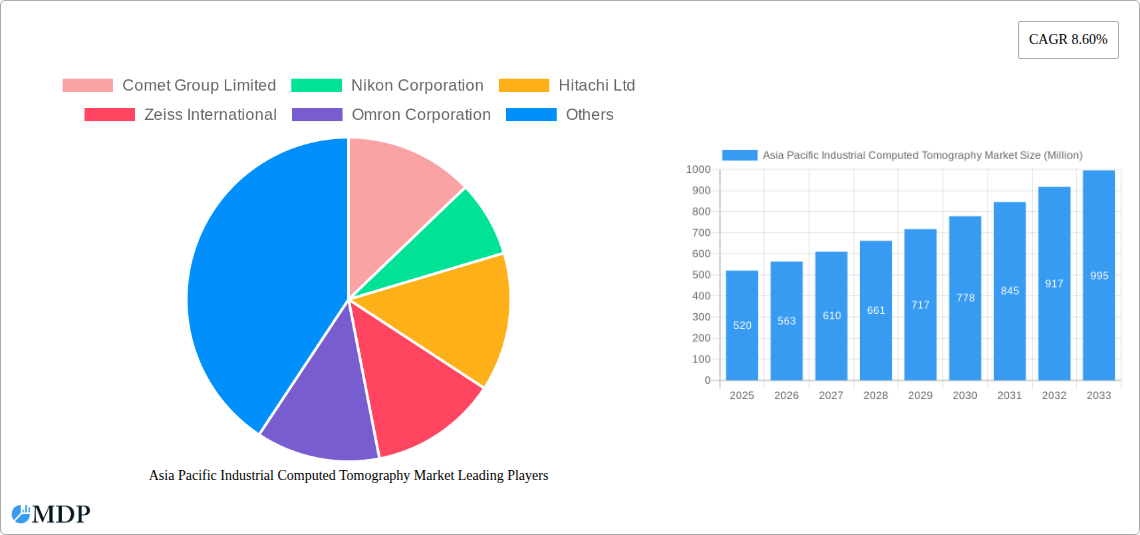
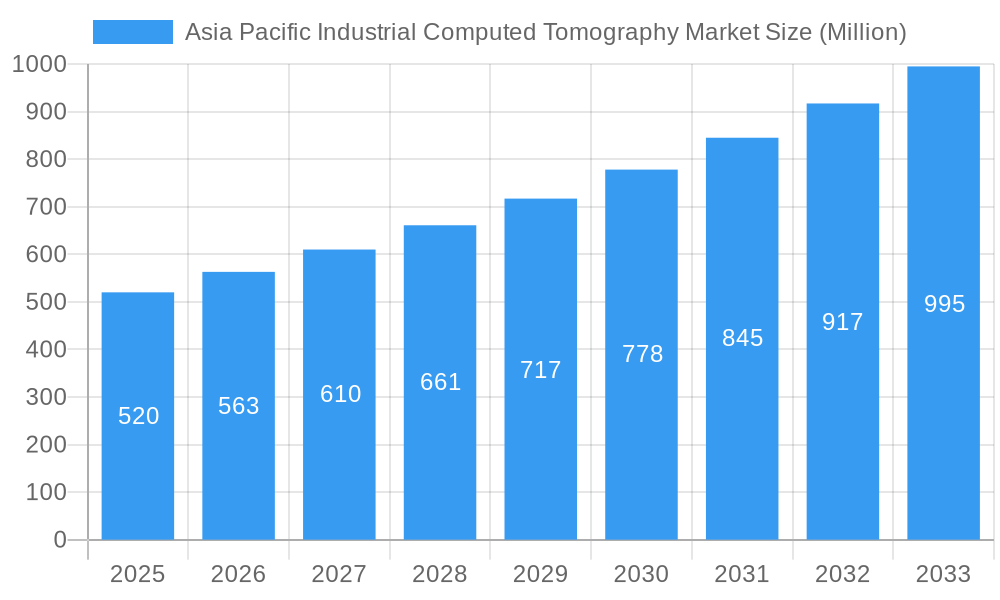
Asia Pacific Industrial Computed Tomography Market Market Size (In Million)
Despite the positive trajectory, the market faces certain hurdles. The considerable upfront investment for ICT systems may pose a barrier for small and medium-sized enterprises. Additionally, a shortage of qualified personnel for operating and interpreting complex ICT data presents a potential constraint. Nevertheless, the market outlook remains optimistic, with continued growth expected throughout the forecast period. Heightened emphasis on product integrity and stringent safety standards, particularly in the aerospace and automotive sectors, will continue to drive ICT demand in the Asia Pacific. Key economies, including China, Japan, South Korea, and India, with their burgeoning manufacturing footprints, are poised to be significant contributors to this expansion.
Asia Pacific Industrial Computed Tomography Market Company Market Share
Asia Pacific Industrial Computed Tomography Market Report: 2019-2033
This comprehensive report provides an in-depth analysis of the Asia Pacific Industrial Computed Tomography (CT) market, offering invaluable insights for stakeholders across the industry. Covering the period from 2019 to 2033, with a base year of 2025, this report meticulously examines market dynamics, trends, leading players, and future growth prospects. The market is segmented by application (Flaw Detection and Inspection, Failure Analysis, Assembly Analysis, Other Applications) and end-user industry (Aerospace, Automotive, Electronics, Oil and Gas, Other End-User Industries). The report projects a market value of xx Million by 2033, presenting a detailed breakdown across all segments and regions within the Asia-Pacific region.
Asia Pacific Industrial Computed Tomography Market Market Dynamics & Concentration
The Asia Pacific industrial computed tomography market is characterized by a moderately concentrated landscape, with key players such as Comet Group Limited, Nikon Corporation, Hitachi Ltd, Zeiss International, Omron Corporation, Thermo Fischer Scientific Inc, Shimadzu Corporation, Waygate Technologies (Baker Hughes Digital Solutions GmbH), and Bruker Corporation holding significant market share. Market concentration is influenced by factors such as technological advancements, stringent regulatory frameworks, and the increasing adoption of industrial CT across diverse sectors. Innovation is a key driver, with companies continuously striving to enhance image quality, speed, and ease of use. The regulatory environment plays a crucial role, with safety and environmental standards impacting product development and market access. The market experiences competitive pressures from alternative inspection methods, driving innovation and efficiency improvements within industrial CT technology. Mergers and acquisitions (M&A) are relatively infrequent, with xx M&A deals recorded over the past five years, suggesting a more organic growth trajectory within the market. The market share of the top five players is estimated at xx%, indicating a competitive yet stable market structure.
Asia Pacific Industrial Computed Tomography Market Industry Trends & Analysis
The Asia Pacific industrial computed tomography market is experiencing robust growth, driven by several key factors. The rising demand for quality control and non-destructive testing (NDT) across various industries, coupled with technological advancements such as faster scan times and improved image resolution, is fueling market expansion. The CAGR for the forecast period (2025-2033) is projected at xx%, indicating significant market potential. Market penetration remains relatively high in developed economies like Japan and South Korea, however, significant growth is anticipated in emerging economies such as India and China, driven by rapid industrialization and increasing investments in advanced manufacturing technologies. The shift towards automation and Industry 4.0 is also driving demand for industrial CT systems, offering enhanced efficiency and productivity. Consumer preferences increasingly favor advanced features like automated analysis and integration with existing manufacturing workflows, driving innovation within the market. Competitive dynamics are characterized by continuous innovation, strategic partnerships, and a focus on product differentiation.
Leading Markets & Segments in Asia Pacific Industrial Computed Tomography Market
The Electronics sector is the dominant end-user industry in the Asia Pacific industrial computed tomography market, accounting for approximately xx% of the total market revenue in 2025. This is primarily driven by the stringent quality requirements in electronics manufacturing and the need for detailed inspection of complex components. The Flaw Detection and Inspection application segment holds the largest market share among all applications, due to its widespread use in quality control across various industries.
Key Drivers for Leading Segments:
- Electronics: Stringent quality control, miniaturization of components, and the need for high-speed inspection.
- Flaw Detection & Inspection: Growing demand for non-destructive testing (NDT) and improved product quality.
Country Dominance:
China and Japan are the dominant markets within the Asia-Pacific region, driven by robust manufacturing sectors and high adoption rates of advanced inspection technologies. Factors contributing to market dominance include favorable economic policies promoting industrial growth and well-developed infrastructure supporting technological advancements.
Asia Pacific Industrial Computed Tomography Market Product Developments
Recent product developments highlight a trend towards miniaturization, increased speed, and improved image quality. Shimadzu Corporation's XSeeker 8000, the smallest and lightest X-ray CT system, exemplifies this trend, offering high-resolution images for a diverse range of samples. Omron Corporation's VT-X750-V3 boasts significantly faster scanning capabilities, enabling high-throughput inspection of electronic components. These developments underscore the industry's focus on enhancing efficiency and providing advanced solutions to meet the diverse needs of various end-user industries.
Key Drivers of Asia Pacific Industrial Computed Tomography Market Growth
Several factors drive the growth of the Asia Pacific industrial computed tomography market: increasing demand for quality control and assurance in diverse industries; advancements in CT technology resulting in faster scanning speeds, higher resolution, and improved ease of use; the rising adoption of automation and Industry 4.0 principles in manufacturing; and government initiatives promoting advanced manufacturing and technological advancements across the region.
Challenges in the Asia Pacific Industrial Computed Tomography Market Market
The market faces challenges such as high initial investment costs for industrial CT systems, the need for skilled personnel to operate and interpret the data, and potential supply chain disruptions impacting the availability of critical components. Additionally, regulatory compliance and safety standards can impact the adoption and utilization of industrial CT systems in specific regions or industries. These factors can collectively hinder market growth to some extent.
Emerging Opportunities in Asia Pacific Industrial Computed Tomography Market
Significant growth opportunities exist in expanding the adoption of industrial CT systems in emerging economies and across new industry segments. The development of advanced algorithms and AI-powered image analysis can further improve efficiency and data interpretation, opening doors for new applications. Strategic partnerships between equipment manufacturers and software providers can unlock innovative solutions, enhancing the market's overall value proposition.
Leading Players in the Asia Pacific Industrial Computed Tomography Market Sector
Key Milestones in Asia Pacific Industrial Computed Tomography Market Industry
- November 2021: Omron Corporation announced the development of the VT-X750-V3, a high-speed CT-type X-ray inspection device. This significantly enhances inspection efficiency for electronic board assemblies.
- May 2022: Shimadzu Corporation launched the XSeeker 8000 bench-top X-ray CT system, offering improved portability and image clarity for various sample types. This enhances accessibility for smaller businesses and expands the range of applications.
Strategic Outlook for Asia Pacific Industrial Computed Tomography Market Market
The Asia Pacific industrial computed tomography market holds significant long-term growth potential, driven by technological advancements, increasing industrial automation, and expanding applications across diverse sectors. Strategic partnerships, focused R&D, and expansion into emerging markets will be crucial for players seeking to capitalize on these opportunities. A focus on customized solutions, enhanced software capabilities, and streamlined integration into existing manufacturing workflows will shape the future competitive landscape.
Asia Pacific Industrial Computed Tomography Market Segmentation
-
1. Application
- 1.1. Flaw Detection and Inspection
- 1.2. Failure Analysis
- 1.3. Assembly Analysis
- 1.4. Other Applications
-
2. End-User Industry
- 2.1. Aerospace
- 2.2. Automotive
- 2.3. Electronics
- 2.4. Oil and Gas
- 2.5. Other End-User Industries
Asia Pacific Industrial Computed Tomography Market Segmentation By Geography
-
1. Asia Pacific
- 1.1. China
- 1.2. Japan
- 1.3. South Korea
- 1.4. India
- 1.5. Australia
- 1.6. New Zealand
- 1.7. Indonesia
- 1.8. Malaysia
- 1.9. Singapore
- 1.10. Thailand
- 1.11. Vietnam
- 1.12. Philippines
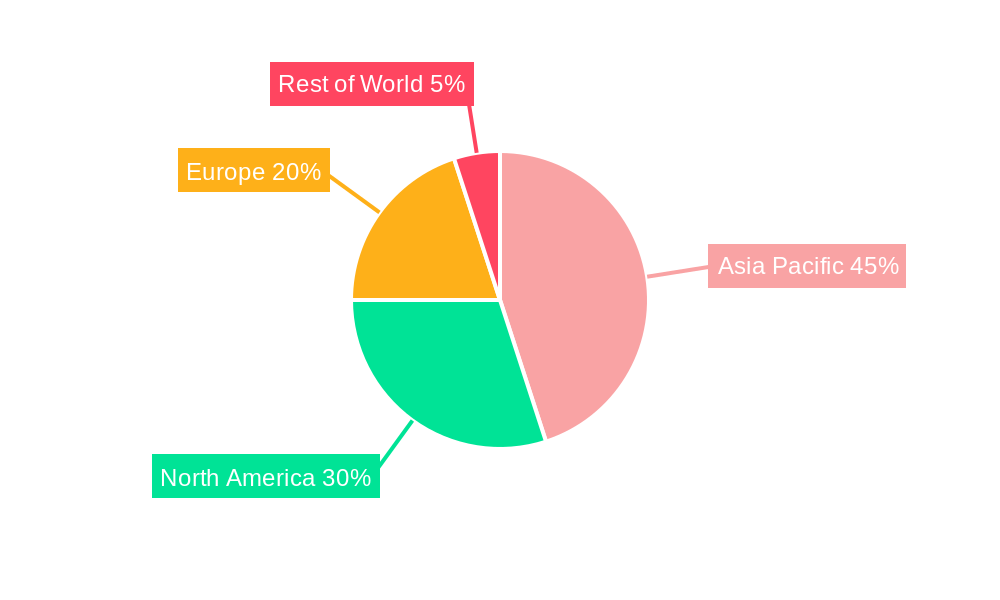
Asia Pacific Industrial Computed Tomography Market Regional Market Share
Geographic Coverage of Asia Pacific Industrial Computed Tomography Market
Asia Pacific Industrial Computed Tomography Market REPORT HIGHLIGHTS
| Aspects | Details |
|---|---|
| Study Period | 2020-2034 |
| Base Year | 2025 |
| Estimated Year | 2026 |
| Forecast Period | 2026-2034 |
| Historical Period | 2020-2025 |
| Growth Rate | CAGR of 19.04% from 2020-2034 |
| Segmentation |
|
Table of Contents
- 1. Introduction
- 1.1. Research Scope
- 1.2. Market Segmentation
- 1.3. Research Objective
- 1.4. Definitions and Assumptions
- 2. Executive Summary
- 2.1. Market Snapshot
- 3. Market Dynamics
- 3.1. Market Drivers
- 3.2. Market Restrains
- 3.3. Market Trends
- 3.4. Market Opportunities
- 4. Market Factor Analysis
- 4.1. Porters Five Forces
- 4.1.1. Bargaining Power of Suppliers
- 4.1.2. Bargaining Power of Buyers
- 4.1.3. Threat of New Entrants
- 4.1.4. Threat of Substitutes
- 4.1.5. Competitive Rivalry
- 4.2. PESTEL analysis
- 4.3. BCG Analysis
- 4.3.1. Stars (High Growth, High Market Share)
- 4.3.2. Cash Cows (Low Growth, High Market Share)
- 4.3.3. Question Mark (High Growth, Low Market Share)
- 4.3.4. Dogs (Low Growth, Low Market Share)
- 4.4. Ansoff Matrix Analysis
- 4.5. Supply Chain Analysis
- 4.6. Regulatory Landscape
- 4.7. Current Market Potential and Opportunity Assessment (TAM–SAM–SOM Framework)
- 4.8. MDP Analyst Note
- 4.1. Porters Five Forces
- 5. Market Analysis, Insights and Forecast 2021-2033
- 5.1. Market Analysis, Insights and Forecast - by Application
- 5.1.1. Flaw Detection and Inspection
- 5.1.2. Failure Analysis
- 5.1.3. Assembly Analysis
- 5.1.4. Other Applications
- 5.2. Market Analysis, Insights and Forecast - by End-User Industry
- 5.2.1. Aerospace
- 5.2.2. Automotive
- 5.2.3. Electronics
- 5.2.4. Oil and Gas
- 5.2.5. Other End-User Industries
- 5.3. Market Analysis, Insights and Forecast - by Region
- 5.3.1. Asia Pacific
- 5.1. Market Analysis, Insights and Forecast - by Application
- 6. Asia Pacific Industrial Computed Tomography Market Analysis, Insights and Forecast, 2021-2033
- 6.1. Market Analysis, Insights and Forecast - by Application
- 6.1.1. Flaw Detection and Inspection
- 6.1.2. Failure Analysis
- 6.1.3. Assembly Analysis
- 6.1.4. Other Applications
- 6.2. Market Analysis, Insights and Forecast - by End-User Industry
- 6.2.1. Aerospace
- 6.2.2. Automotive
- 6.2.3. Electronics
- 6.2.4. Oil and Gas
- 6.2.5. Other End-User Industries
- 6.1. Market Analysis, Insights and Forecast - by Application
- 7. Competitive Analysis
- 7.1. Company Profiles
- 7.1.1 Comet Group Limited
- 7.1.1.1. Company Overview
- 7.1.1.2. Products
- 7.1.1.3. Company Financials
- 7.1.1.4. SWOT Analysis
- 7.1.2 Nikon Corporation
- 7.1.2.1. Company Overview
- 7.1.2.2. Products
- 7.1.2.3. Company Financials
- 7.1.2.4. SWOT Analysis
- 7.1.3 Hitachi Ltd
- 7.1.3.1. Company Overview
- 7.1.3.2. Products
- 7.1.3.3. Company Financials
- 7.1.3.4. SWOT Analysis
- 7.1.4 Zeiss International
- 7.1.4.1. Company Overview
- 7.1.4.2. Products
- 7.1.4.3. Company Financials
- 7.1.4.4. SWOT Analysis
- 7.1.5 Omron Corporation
- 7.1.5.1. Company Overview
- 7.1.5.2. Products
- 7.1.5.3. Company Financials
- 7.1.5.4. SWOT Analysis
- 7.1.6 Thermo Fischer Scientific Inc
- 7.1.6.1. Company Overview
- 7.1.6.2. Products
- 7.1.6.3. Company Financials
- 7.1.6.4. SWOT Analysis
- 7.1.7 Shimadzu Corporation
- 7.1.7.1. Company Overview
- 7.1.7.2. Products
- 7.1.7.3. Company Financials
- 7.1.7.4. SWOT Analysis
- 7.1.8 Waygate Technologies (Baker Hughes Digital Solutions GmbH)
- 7.1.8.1. Company Overview
- 7.1.8.2. Products
- 7.1.8.3. Company Financials
- 7.1.8.4. SWOT Analysis
- 7.1.9 Bruker Corporation
- 7.1.9.1. Company Overview
- 7.1.9.2. Products
- 7.1.9.3. Company Financials
- 7.1.9.4. SWOT Analysis
- 7.1.10 Shimadzu Corporation
- 7.1.10.1. Company Overview
- 7.1.10.2. Products
- 7.1.10.3. Company Financials
- 7.1.10.4. SWOT Analysis
- 7.1.1 Comet Group Limited
- 7.2. Market Entropy
- 7.2.1 Company's Key Areas Served
- 7.2.2 Recent Developments
- 7.3. Company Market Share Analysis 2025
- 7.3.1 Top 5 Companies Market Share Analysis
- 7.3.2 Top 3 Companies Market Share Analysis
- 7.4. List of Potential Customers
- 8. Research Methodology
List of Figures
- Figure 1: Asia Pacific Industrial Computed Tomography Market Revenue Breakdown (million, %) by Product 2025 & 2033
- Figure 2: Asia Pacific Industrial Computed Tomography Market Share (%) by Company 2025
List of Tables
- Table 1: Asia Pacific Industrial Computed Tomography Market Revenue million Forecast, by Application 2020 & 2033
- Table 2: Asia Pacific Industrial Computed Tomography Market Revenue million Forecast, by End-User Industry 2020 & 2033
- Table 3: Asia Pacific Industrial Computed Tomography Market Revenue million Forecast, by Region 2020 & 2033
- Table 4: Asia Pacific Industrial Computed Tomography Market Revenue million Forecast, by Application 2020 & 2033
- Table 5: Asia Pacific Industrial Computed Tomography Market Revenue million Forecast, by End-User Industry 2020 & 2033
- Table 6: Asia Pacific Industrial Computed Tomography Market Revenue million Forecast, by Country 2020 & 2033
- Table 7: China Asia Pacific Industrial Computed Tomography Market Revenue (million) Forecast, by Application 2020 & 2033
- Table 8: Japan Asia Pacific Industrial Computed Tomography Market Revenue (million) Forecast, by Application 2020 & 2033
- Table 9: South Korea Asia Pacific Industrial Computed Tomography Market Revenue (million) Forecast, by Application 2020 & 2033
- Table 10: India Asia Pacific Industrial Computed Tomography Market Revenue (million) Forecast, by Application 2020 & 2033
- Table 11: Australia Asia Pacific Industrial Computed Tomography Market Revenue (million) Forecast, by Application 2020 & 2033
- Table 12: New Zealand Asia Pacific Industrial Computed Tomography Market Revenue (million) Forecast, by Application 2020 & 2033
- Table 13: Indonesia Asia Pacific Industrial Computed Tomography Market Revenue (million) Forecast, by Application 2020 & 2033
- Table 14: Malaysia Asia Pacific Industrial Computed Tomography Market Revenue (million) Forecast, by Application 2020 & 2033
- Table 15: Singapore Asia Pacific Industrial Computed Tomography Market Revenue (million) Forecast, by Application 2020 & 2033
- Table 16: Thailand Asia Pacific Industrial Computed Tomography Market Revenue (million) Forecast, by Application 2020 & 2033
- Table 17: Vietnam Asia Pacific Industrial Computed Tomography Market Revenue (million) Forecast, by Application 2020 & 2033
- Table 18: Philippines Asia Pacific Industrial Computed Tomography Market Revenue (million) Forecast, by Application 2020 & 2033
Frequently Asked Questions
1. What is the projected Compound Annual Growth Rate (CAGR) of the Asia Pacific Industrial Computed Tomography Market?
The projected CAGR is approximately 19.04%.
2. Which companies are prominent players in the Asia Pacific Industrial Computed Tomography Market?
Key companies in the market include Comet Group Limited, Nikon Corporation, Hitachi Ltd, Zeiss International, Omron Corporation, Thermo Fischer Scientific Inc, Shimadzu Corporation, Waygate Technologies (Baker Hughes Digital Solutions GmbH), Bruker Corporation, Shimadzu Corporation.
3. What are the main segments of the Asia Pacific Industrial Computed Tomography Market?
The market segments include Application, End-User Industry.
4. Can you provide details about the market size?
The market size is estimated to be USD 536 million as of 2022.
5. What are some drivers contributing to market growth?
Rising Demand for Portable Radiography Equipment; Technology Advancements in Resolution and Image Processing.
6. What are the notable trends driving market growth?
Automotive to Gain Significant Growth in the Region.
7. Are there any restraints impacting market growth?
High Installation Cost and Longer ROI Period; Longer Replacement Cycle of Water Meters.
8. Can you provide examples of recent developments in the market?
May 2022 - Shimadzu Corporation announced the release of the XSeeker 8000 bench-top X-ray CT system. It is considered to be the smallest and lightest X-ray system. It offers clear images of a variety of samples, from resin molded parts to aluminum die cast and other metallic elements.
9. What pricing options are available for accessing the report?
Pricing options include single-user, multi-user, and enterprise licenses priced at USD 4750, USD 5250, and USD 8750 respectively.
10. Is the market size provided in terms of value or volume?
The market size is provided in terms of value, measured in million.
11. Are there any specific market keywords associated with the report?
Yes, the market keyword associated with the report is "Asia Pacific Industrial Computed Tomography Market," which aids in identifying and referencing the specific market segment covered.
12. How do I determine which pricing option suits my needs best?
The pricing options vary based on user requirements and access needs. Individual users may opt for single-user licenses, while businesses requiring broader access may choose multi-user or enterprise licenses for cost-effective access to the report.
13. Are there any additional resources or data provided in the Asia Pacific Industrial Computed Tomography Market report?
While the report offers comprehensive insights, it's advisable to review the specific contents or supplementary materials provided to ascertain if additional resources or data are available.
14. How can I stay updated on further developments or reports in the Asia Pacific Industrial Computed Tomography Market?
To stay informed about further developments, trends, and reports in the Asia Pacific Industrial Computed Tomography Market, consider subscribing to industry newsletters, following relevant companies and organizations, or regularly checking reputable industry news sources and publications.
Methodology
Step 1 - Identification of Relevant Samples Size from Population Database


Step 2 - Approaches for Defining Global Market Size (Value, Volume* & Price*)

Note*: In applicable scenarios
Step 3 - Data Sources
Primary Research
- Web Analytics
- Survey Reports
- Research Institute
- Latest Research Reports
- Opinion Leaders
Secondary Research
- Annual Reports
- White Paper
- Latest Press Release
- Industry Association
- Paid Database
- Investor Presentations

Step 4 - Data Triangulation
Involves using different sources of information in order to increase the validity of a study
These sources are likely to be stakeholders in a program - participants, other researchers, program staff, other community members, and so on.
Then we put all data in single framework & apply various statistical tools to find out the dynamic on the market.
During the analysis stage, feedback from the stakeholder groups would be compared to determine areas of agreement as well as areas of divergence