

Key Insights
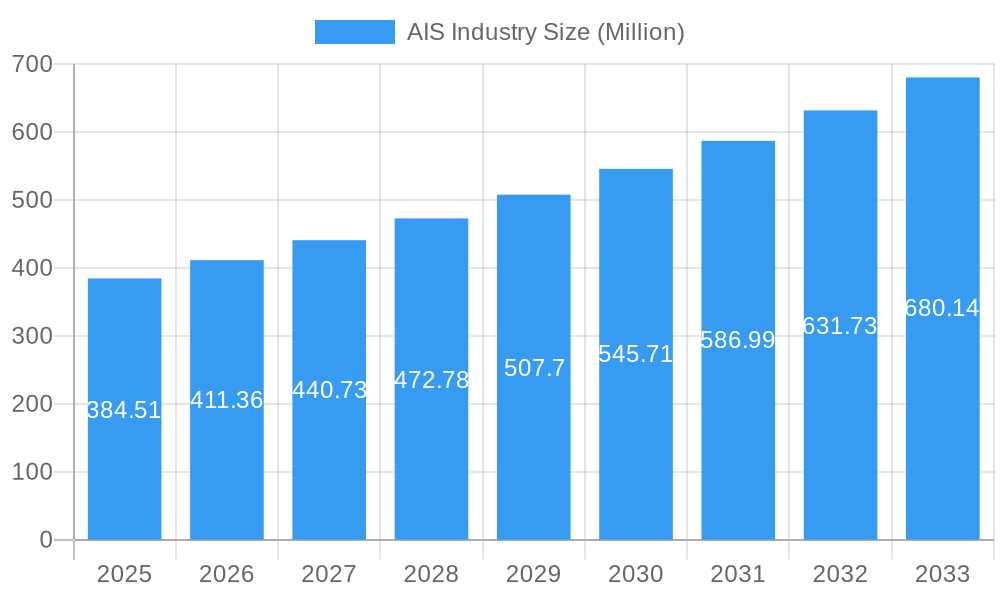
The Automatic Identification System (AIS) market is experiencing robust growth, projected to reach a substantial size driven by increasing maritime traffic, stringent safety regulations, and the growing demand for efficient fleet management solutions. The market's Compound Annual Growth Rate (CAGR) of 6.85% from 2019 to 2024 indicates a consistent upward trajectory. Analyzing the provided data and considering industry trends, we can estimate the 2025 market size to be approximately $384.51 million, building on the strong growth witnessed in the preceding years. Key drivers include the increasing adoption of AIS technology for vessel tracking, enhancing maritime security, and facilitating accident investigation and infrastructure protection. The integration of AIS with other technologies like IoT and satellite communication is further propelling market expansion. Growth is segmented across various applications, with fleet management and vessel tracking dominating, followed by maritime security and other applications. The platform segment is also diverse, with vessel-based and onshore platforms catering to different needs. Major players like Wärtsilä, Kongsberg, and Garmin are key contributors to market innovation and competition, constantly developing advanced AIS solutions. The geographical distribution likely shows strong presence in North America and Europe, followed by Asia Pacific and other regions, reflecting the concentration of shipping activities and regulatory frameworks. The forecast period (2025-2033) anticipates continued expansion fueled by technological advancements and increasing global trade.
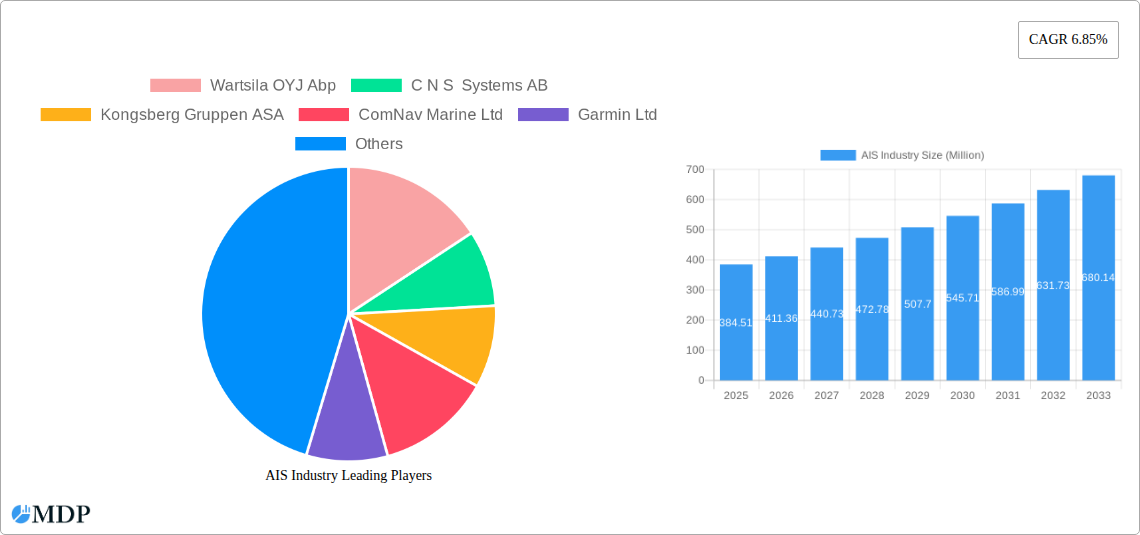
AIS Industry Market Size (In Million)
The market’s steady growth is attributed to factors such as the increasing need for improved maritime safety and security, driven by international maritime regulations and rising instances of piracy and accidents. The integration of AIS with other technologies, such as GPS and satellite communication, has enhanced the capabilities of the system, allowing for more precise tracking and real-time monitoring of vessels. Furthermore, advancements in AIS technology, including the development of more compact and cost-effective devices, have broadened its accessibility to smaller vessels and operators. The growing demand for efficient fleet management solutions across various industries, including shipping, fishing, and offshore operations, has further accelerated the adoption of AIS technology. While challenges such as initial investment costs and potential interference may exist, the overall market outlook remains positive, projecting substantial growth throughout the forecast period.
AIS Industry Company Market Share
This comprehensive report provides a detailed analysis of the Automatic Identification System (AIS) industry, offering invaluable insights for stakeholders, investors, and industry professionals. With a forecast period spanning 2025-2033 and a study period encompassing 2019-2024, this report leverages extensive market research to illuminate key trends, challenges, and opportunities within the AIS sector. The report values are in Millions.
AIS Industry Market Dynamics & Concentration
The AIS industry, valued at xx Million in 2024, exhibits a moderately consolidated market structure. Key players, including Wartsila OYJ Abp, C N S Systems AB, Kongsberg Gruppen ASA, ComNav Marine Ltd, Garmin Ltd, Furuno Electric Co Ltd, Orbcomm Inc, Japan Radio Company Ltd, Saab AB, L3 Technologies Inc, ExactEarth Ltd, and True Heading AB, control a significant market share, estimated at xx%. However, the emergence of smaller, specialized companies is increasing competition.
- Market Concentration: High concentration among major players (xx%), moderate fragmentation among smaller players (xx%).
- Innovation Drivers: Advancements in sensor technology, data analytics, and communication protocols.
- Regulatory Frameworks: International Maritime Organization (IMO) regulations significantly influence market growth and adoption.
- Product Substitutes: Limited direct substitutes exist, although alternative vessel tracking technologies present indirect competition.
- End-User Trends: Growing demand for enhanced vessel tracking, fleet management, and maritime security solutions.
- M&A Activities: The number of M&A deals in the past five years is estimated at xx, indicating a consolidating market landscape.
AIS Industry Trends & Analysis
The AIS market is experiencing robust growth, driven by increasing adoption across various maritime applications. Technological advancements, such as the integration of IoT technologies and AI-powered analytics, are transforming the industry. The compound annual growth rate (CAGR) from 2025-2033 is projected at xx%, with market penetration reaching approximately xx% by 2033. This growth reflects increased awareness of maritime security threats, stricter regulatory compliance mandates, and the need for efficient fleet management. Consumer preferences are shifting towards integrated, cost-effective, and user-friendly AIS solutions that provide real-time data and actionable insights. Competitive dynamics are marked by continuous innovation, strategic partnerships, and increasing competition from smaller, specialized companies.
Leading Markets & Segments in AIS Industry
The Asia-Pacific region currently holds the largest market share in the AIS industry, driven by the region's extensive shipping activity and burgeoning maritime sector. Significant growth is also anticipated from North America and Europe.
Key Drivers by Segment:
- Application:
- Fleet Management: Driven by increased efficiency demands and cost optimization within shipping companies.
- Vessel Tracking: Demand driven by regulatory compliance, safety concerns, and improved operational visibility.
- Maritime Security: Fueled by increasing piracy and smuggling concerns.
- Other Applications: Growing demand for accident investigation and infrastructure protection applications.
- Platform:
- Vessel-Based: Remains the dominant platform due to its direct integration with vessels.
- On-Shore: Growing adoption for centralized monitoring and management of fleets.
AIS Industry Product Developments
Recent product innovations focus on enhancing data accuracy, improving integration capabilities with existing systems, and developing user-friendly interfaces. Technological trends include the integration of IoT sensors, AI-powered analytics, and satellite communication technologies to enhance data processing, analysis, and real-time monitoring capabilities. New products offer improved functionalities, such as precise positioning, enhanced data security, and advanced reporting features.
Key Drivers of AIS Industry Growth
Several factors are driving the growth of the AIS industry:
- Technological advancements: Integration of IoT, AI, and satellite communication technologies.
- Economic growth: Expanding global trade and maritime activities.
- Stringent regulations: IMO regulations mandating AIS usage for improved maritime safety and security.
Challenges in the AIS Industry Market
The AIS industry faces various challenges, including:
- Regulatory hurdles: Differing regulations across countries can complicate market entry and expansion.
- Supply chain disruptions: Global supply chain issues impact the availability and cost of components.
- Competitive pressure: Increased competition from new entrants and existing players offering similar solutions.
Emerging Opportunities in AIS Industry
The AIS industry presents numerous opportunities, driven by:
- Technological breakthroughs: Advancements in AI, machine learning, and data analytics provide opportunities for advanced solutions.
- Strategic partnerships: Collaborations between AIS providers, data analytics companies, and maritime organizations can create new value propositions.
- Market expansion: Expanding into new markets and applications, particularly in the developing world, presents significant growth potential.
Leading Players in the AIS Industry Sector
- Wartsila OYJ Abp
- C N S Systems AB
- Kongsberg Gruppen ASA
- ComNav Marine Ltd
- Garmin Ltd
- Furuno Electric Co Ltd
- Orbcomm Inc
- Japan Radio Company Ltd
- Saab AB
- L3 Technologies Inc
- ExactEarth Ltd
- True Heading AB
Key Milestones in AIS Industry Industry
- November 2022: A study revealed that up to 6% of vessel activity is concealed due to AIS disabling, highlighting the need for enhanced monitoring and security measures. This has implications for maritime security and anti-illegal fishing efforts.
- May 2022: The QUAD initiative announced plans to strengthen marine security partnerships, improving monitoring of illegal fishing and "dark shipping." This will directly increase demand for AIS systems and related services.
Strategic Outlook for AIS Industry Market
The AIS industry is poised for continued growth, driven by advancements in technology, increasing regulatory compliance mandates, and the ongoing need for enhanced maritime safety and security. Strategic opportunities exist for companies focusing on innovative solutions, expanding into new markets, and forming strategic partnerships to capitalize on the growing demand for integrated and user-friendly AIS systems. The industry's long-term potential is considerable, with market expansion fueled by the increasing interconnectedness of the global maritime sector.
AIS Industry Segmentation
-
1. Application
- 1.1. Fleet Management
- 1.2. Vessel Tracking
- 1.3. Maritime Security
- 1.4. Other Ap
-
2. Platform
- 2.1. Vessel-Based
- 2.2. On-Shore
AIS Industry Segmentation By Geography
- 1. North America
- 2. Europe
- 3. Asia
- 4. Australia and New Zealand
- 5. Latin America
- 6. Middle East and Africa
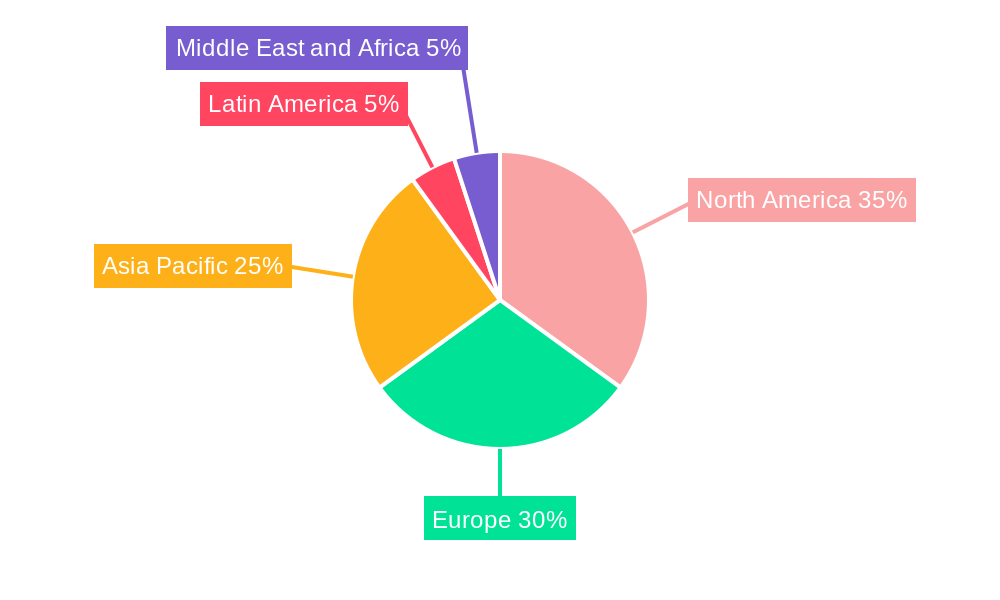
AIS Industry Regional Market Share
Geographic Coverage of AIS Industry
AIS Industry REPORT HIGHLIGHTS
| Aspects | Details |
|---|---|
| Study Period | 2020-2034 |
| Base Year | 2025 |
| Estimated Year | 2026 |
| Forecast Period | 2026-2034 |
| Historical Period | 2020-2025 |
| Growth Rate | CAGR of 6.85% from 2020-2034 |
| Segmentation |
|
Table of Contents
- 1. Introduction
- 1.1. Research Scope
- 1.2. Market Segmentation
- 1.3. Research Objective
- 1.4. Definitions and Assumptions
- 2. Executive Summary
- 2.1. Market Snapshot
- 3. Market Dynamics
- 3.1. Market Drivers
- 3.2. Market Restrains
- 3.3. Market Trends
- 3.4. Market Opportunities
- 4. Market Factor Analysis
- 4.1. Porters Five Forces
- 4.1.1. Bargaining Power of Suppliers
- 4.1.2. Bargaining Power of Buyers
- 4.1.3. Threat of New Entrants
- 4.1.4. Threat of Substitutes
- 4.1.5. Competitive Rivalry
- 4.2. PESTEL analysis
- 4.3. BCG Analysis
- 4.3.1. Stars (High Growth, High Market Share)
- 4.3.2. Cash Cows (Low Growth, High Market Share)
- 4.3.3. Question Mark (High Growth, Low Market Share)
- 4.3.4. Dogs (Low Growth, Low Market Share)
- 4.4. Ansoff Matrix Analysis
- 4.5. Supply Chain Analysis
- 4.6. Regulatory Landscape
- 4.7. Current Market Potential and Opportunity Assessment (TAM–SAM–SOM Framework)
- 4.8. MDP Analyst Note
- 4.1. Porters Five Forces
- 5. Market Analysis, Insights and Forecast 2021-2033
- 5.1. Market Analysis, Insights and Forecast - by Application
- 5.1.1. Fleet Management
- 5.1.2. Vessel Tracking
- 5.1.3. Maritime Security
- 5.1.4. Other Ap
- 5.2. Market Analysis, Insights and Forecast - by Platform
- 5.2.1. Vessel-Based
- 5.2.2. On-Shore
- 5.3. Market Analysis, Insights and Forecast - by Region
- 5.3.1. North America
- 5.3.2. Europe
- 5.3.3. Asia
- 5.3.4. Australia and New Zealand
- 5.3.5. Latin America
- 5.3.6. Middle East and Africa
- 5.1. Market Analysis, Insights and Forecast - by Application
- 6. Global AIS Industry Analysis, Insights and Forecast, 2021-2033
- 6.1. Market Analysis, Insights and Forecast - by Application
- 6.1.1. Fleet Management
- 6.1.2. Vessel Tracking
- 6.1.3. Maritime Security
- 6.1.4. Other Ap
- 6.2. Market Analysis, Insights and Forecast - by Platform
- 6.2.1. Vessel-Based
- 6.2.2. On-Shore
- 6.1. Market Analysis, Insights and Forecast - by Application
- 7. North America AIS Industry Analysis, Insights and Forecast, 2020-2032
- 7.1. Market Analysis, Insights and Forecast - by Application
- 7.1.1. Fleet Management
- 7.1.2. Vessel Tracking
- 7.1.3. Maritime Security
- 7.1.4. Other Ap
- 7.2. Market Analysis, Insights and Forecast - by Platform
- 7.2.1. Vessel-Based
- 7.2.2. On-Shore
- 7.1. Market Analysis, Insights and Forecast - by Application
- 8. Europe AIS Industry Analysis, Insights and Forecast, 2020-2032
- 8.1. Market Analysis, Insights and Forecast - by Application
- 8.1.1. Fleet Management
- 8.1.2. Vessel Tracking
- 8.1.3. Maritime Security
- 8.1.4. Other Ap
- 8.2. Market Analysis, Insights and Forecast - by Platform
- 8.2.1. Vessel-Based
- 8.2.2. On-Shore
- 8.1. Market Analysis, Insights and Forecast - by Application
- 9. Asia AIS Industry Analysis, Insights and Forecast, 2020-2032
- 9.1. Market Analysis, Insights and Forecast - by Application
- 9.1.1. Fleet Management
- 9.1.2. Vessel Tracking
- 9.1.3. Maritime Security
- 9.1.4. Other Ap
- 9.2. Market Analysis, Insights and Forecast - by Platform
- 9.2.1. Vessel-Based
- 9.2.2. On-Shore
- 9.1. Market Analysis, Insights and Forecast - by Application
- 10. Australia and New Zealand AIS Industry Analysis, Insights and Forecast, 2020-2032
- 10.1. Market Analysis, Insights and Forecast - by Application
- 10.1.1. Fleet Management
- 10.1.2. Vessel Tracking
- 10.1.3. Maritime Security
- 10.1.4. Other Ap
- 10.2. Market Analysis, Insights and Forecast - by Platform
- 10.2.1. Vessel-Based
- 10.2.2. On-Shore
- 10.1. Market Analysis, Insights and Forecast - by Application
- 11. Latin America AIS Industry Analysis, Insights and Forecast, 2020-2032
- 11.1. Market Analysis, Insights and Forecast - by Application
- 11.1.1. Fleet Management
- 11.1.2. Vessel Tracking
- 11.1.3. Maritime Security
- 11.1.4. Other Ap
- 11.2. Market Analysis, Insights and Forecast - by Platform
- 11.2.1. Vessel-Based
- 11.2.2. On-Shore
- 11.1. Market Analysis, Insights and Forecast - by Application
- 12. Middle East and Africa AIS Industry Analysis, Insights and Forecast, 2020-2032
- 12.1. Market Analysis, Insights and Forecast - by Application
- 12.1.1. Fleet Management
- 12.1.2. Vessel Tracking
- 12.1.3. Maritime Security
- 12.1.4. Other Ap
- 12.2. Market Analysis, Insights and Forecast - by Platform
- 12.2.1. Vessel-Based
- 12.2.2. On-Shore
- 12.1. Market Analysis, Insights and Forecast - by Application
- 13. Competitive Analysis
- 13.1. Company Profiles
- 13.1.1 Wartsila OYJ Abp
- 13.1.1.1. Company Overview
- 13.1.1.2. Products
- 13.1.1.3. Company Financials
- 13.1.1.4. SWOT Analysis
- 13.1.2 C N S Systems AB
- 13.1.2.1. Company Overview
- 13.1.2.2. Products
- 13.1.2.3. Company Financials
- 13.1.2.4. SWOT Analysis
- 13.1.3 Kongsberg Gruppen ASA
- 13.1.3.1. Company Overview
- 13.1.3.2. Products
- 13.1.3.3. Company Financials
- 13.1.3.4. SWOT Analysis
- 13.1.4 ComNav Marine Ltd
- 13.1.4.1. Company Overview
- 13.1.4.2. Products
- 13.1.4.3. Company Financials
- 13.1.4.4. SWOT Analysis
- 13.1.5 Garmin Ltd
- 13.1.5.1. Company Overview
- 13.1.5.2. Products
- 13.1.5.3. Company Financials
- 13.1.5.4. SWOT Analysis
- 13.1.6 Furuno Electric Co Ltd
- 13.1.6.1. Company Overview
- 13.1.6.2. Products
- 13.1.6.3. Company Financials
- 13.1.6.4. SWOT Analysis
- 13.1.7 Orbcomm Inc
- 13.1.7.1. Company Overview
- 13.1.7.2. Products
- 13.1.7.3. Company Financials
- 13.1.7.4. SWOT Analysis
- 13.1.8 Japan Radio Company Ltd
- 13.1.8.1. Company Overview
- 13.1.8.2. Products
- 13.1.8.3. Company Financials
- 13.1.8.4. SWOT Analysis
- 13.1.9 Saab AB
- 13.1.9.1. Company Overview
- 13.1.9.2. Products
- 13.1.9.3. Company Financials
- 13.1.9.4. SWOT Analysis
- 13.1.10 L3 Technologies Inc *List Not Exhaustive
- 13.1.10.1. Company Overview
- 13.1.10.2. Products
- 13.1.10.3. Company Financials
- 13.1.10.4. SWOT Analysis
- 13.1.11 ExactEarth Ltd
- 13.1.11.1. Company Overview
- 13.1.11.2. Products
- 13.1.11.3. Company Financials
- 13.1.11.4. SWOT Analysis
- 13.1.12 True Heading AB
- 13.1.12.1. Company Overview
- 13.1.12.2. Products
- 13.1.12.3. Company Financials
- 13.1.12.4. SWOT Analysis
- 13.1.1 Wartsila OYJ Abp
- 13.2. Market Entropy
- 13.2.1 Company's Key Areas Served
- 13.2.2 Recent Developments
- 13.3. Company Market Share Analysis 2025
- 13.3.1 Top 5 Companies Market Share Analysis
- 13.3.2 Top 3 Companies Market Share Analysis
- 13.4. List of Potential Customers
- 14. Research Methodology
List of Figures
- Figure 1: Global AIS Industry Revenue Breakdown (Million, %) by Region 2025 & 2033
- Figure 2: North America AIS Industry Revenue (Million), by Application 2025 & 2033
- Figure 3: North America AIS Industry Revenue Share (%), by Application 2025 & 2033
- Figure 4: North America AIS Industry Revenue (Million), by Platform 2025 & 2033
- Figure 5: North America AIS Industry Revenue Share (%), by Platform 2025 & 2033
- Figure 6: North America AIS Industry Revenue (Million), by Country 2025 & 2033
- Figure 7: North America AIS Industry Revenue Share (%), by Country 2025 & 2033
- Figure 8: Europe AIS Industry Revenue (Million), by Application 2025 & 2033
- Figure 9: Europe AIS Industry Revenue Share (%), by Application 2025 & 2033
- Figure 10: Europe AIS Industry Revenue (Million), by Platform 2025 & 2033
- Figure 11: Europe AIS Industry Revenue Share (%), by Platform 2025 & 2033
- Figure 12: Europe AIS Industry Revenue (Million), by Country 2025 & 2033
- Figure 13: Europe AIS Industry Revenue Share (%), by Country 2025 & 2033
- Figure 14: Asia AIS Industry Revenue (Million), by Application 2025 & 2033
- Figure 15: Asia AIS Industry Revenue Share (%), by Application 2025 & 2033
- Figure 16: Asia AIS Industry Revenue (Million), by Platform 2025 & 2033
- Figure 17: Asia AIS Industry Revenue Share (%), by Platform 2025 & 2033
- Figure 18: Asia AIS Industry Revenue (Million), by Country 2025 & 2033
- Figure 19: Asia AIS Industry Revenue Share (%), by Country 2025 & 2033
- Figure 20: Australia and New Zealand AIS Industry Revenue (Million), by Application 2025 & 2033
- Figure 21: Australia and New Zealand AIS Industry Revenue Share (%), by Application 2025 & 2033
- Figure 22: Australia and New Zealand AIS Industry Revenue (Million), by Platform 2025 & 2033
- Figure 23: Australia and New Zealand AIS Industry Revenue Share (%), by Platform 2025 & 2033
- Figure 24: Australia and New Zealand AIS Industry Revenue (Million), by Country 2025 & 2033
- Figure 25: Australia and New Zealand AIS Industry Revenue Share (%), by Country 2025 & 2033
- Figure 26: Latin America AIS Industry Revenue (Million), by Application 2025 & 2033
- Figure 27: Latin America AIS Industry Revenue Share (%), by Application 2025 & 2033
- Figure 28: Latin America AIS Industry Revenue (Million), by Platform 2025 & 2033
- Figure 29: Latin America AIS Industry Revenue Share (%), by Platform 2025 & 2033
- Figure 30: Latin America AIS Industry Revenue (Million), by Country 2025 & 2033
- Figure 31: Latin America AIS Industry Revenue Share (%), by Country 2025 & 2033
- Figure 32: Middle East and Africa AIS Industry Revenue (Million), by Application 2025 & 2033
- Figure 33: Middle East and Africa AIS Industry Revenue Share (%), by Application 2025 & 2033
- Figure 34: Middle East and Africa AIS Industry Revenue (Million), by Platform 2025 & 2033
- Figure 35: Middle East and Africa AIS Industry Revenue Share (%), by Platform 2025 & 2033
- Figure 36: Middle East and Africa AIS Industry Revenue (Million), by Country 2025 & 2033
- Figure 37: Middle East and Africa AIS Industry Revenue Share (%), by Country 2025 & 2033
List of Tables
- Table 1: Global AIS Industry Revenue Million Forecast, by Application 2020 & 2033
- Table 2: Global AIS Industry Revenue Million Forecast, by Platform 2020 & 2033
- Table 3: Global AIS Industry Revenue Million Forecast, by Region 2020 & 2033
- Table 4: Global AIS Industry Revenue Million Forecast, by Application 2020 & 2033
- Table 5: Global AIS Industry Revenue Million Forecast, by Platform 2020 & 2033
- Table 6: Global AIS Industry Revenue Million Forecast, by Country 2020 & 2033
- Table 7: Global AIS Industry Revenue Million Forecast, by Application 2020 & 2033
- Table 8: Global AIS Industry Revenue Million Forecast, by Platform 2020 & 2033
- Table 9: Global AIS Industry Revenue Million Forecast, by Country 2020 & 2033
- Table 10: Global AIS Industry Revenue Million Forecast, by Application 2020 & 2033
- Table 11: Global AIS Industry Revenue Million Forecast, by Platform 2020 & 2033
- Table 12: Global AIS Industry Revenue Million Forecast, by Country 2020 & 2033
- Table 13: Global AIS Industry Revenue Million Forecast, by Application 2020 & 2033
- Table 14: Global AIS Industry Revenue Million Forecast, by Platform 2020 & 2033
- Table 15: Global AIS Industry Revenue Million Forecast, by Country 2020 & 2033
- Table 16: Global AIS Industry Revenue Million Forecast, by Application 2020 & 2033
- Table 17: Global AIS Industry Revenue Million Forecast, by Platform 2020 & 2033
- Table 18: Global AIS Industry Revenue Million Forecast, by Country 2020 & 2033
- Table 19: Global AIS Industry Revenue Million Forecast, by Application 2020 & 2033
- Table 20: Global AIS Industry Revenue Million Forecast, by Platform 2020 & 2033
- Table 21: Global AIS Industry Revenue Million Forecast, by Country 2020 & 2033
Frequently Asked Questions
1. What is the projected Compound Annual Growth Rate (CAGR) of the AIS Industry?
The projected CAGR is approximately 6.85%.
2. Which companies are prominent players in the AIS Industry?
Key companies in the market include Wartsila OYJ Abp, C N S Systems AB, Kongsberg Gruppen ASA, ComNav Marine Ltd, Garmin Ltd, Furuno Electric Co Ltd, Orbcomm Inc, Japan Radio Company Ltd, Saab AB, L3 Technologies Inc *List Not Exhaustive, ExactEarth Ltd, True Heading AB.
3. What are the main segments of the AIS Industry?
The market segments include Application, Platform.
4. Can you provide details about the market size?
The market size is estimated to be USD 384.51 Million as of 2022.
5. What are some drivers contributing to market growth?
Increased Maritime Traffic; Need for Improvement in Vessel Dwell Time and Port Performance.
6. What are the notable trends driving market growth?
Fleet Management is Expected to Hold Significant Share.
7. Are there any restraints impacting market growth?
Costs. Adaptability Requirements. and Power Outages.
8. Can you provide examples of recent developments in the market?
November 2022: On November 2, a study published in Science Advances presented the first global dataset on automatic identification system (AIS) disabling in commercial fisheries. The study revealed that AIS disabling, which conceals up to 6% of vessel activity, is a significant issue in the industry. Data about international fishing activity, including illicit, unreported, and unregulated fishing, can be found in the shipboard AIS, developed as a collision avoidance tool. AIS equipment aboard fishing boats may be disabled. However, a recent examination of purposeful disabling incidents in commercial fisheries reveals that while some disabling incidents might be justified, others are cover-ups for unlawful activity.
9. What pricing options are available for accessing the report?
Pricing options include single-user, multi-user, and enterprise licenses priced at USD 4750, USD 5250, and USD 8750 respectively.
10. Is the market size provided in terms of value or volume?
The market size is provided in terms of value, measured in Million.
11. Are there any specific market keywords associated with the report?
Yes, the market keyword associated with the report is "AIS Industry," which aids in identifying and referencing the specific market segment covered.
12. How do I determine which pricing option suits my needs best?
The pricing options vary based on user requirements and access needs. Individual users may opt for single-user licenses, while businesses requiring broader access may choose multi-user or enterprise licenses for cost-effective access to the report.
13. Are there any additional resources or data provided in the AIS Industry report?
While the report offers comprehensive insights, it's advisable to review the specific contents or supplementary materials provided to ascertain if additional resources or data are available.
14. How can I stay updated on further developments or reports in the AIS Industry?
To stay informed about further developments, trends, and reports in the AIS Industry, consider subscribing to industry newsletters, following relevant companies and organizations, or regularly checking reputable industry news sources and publications.
Methodology
Step 1 - Identification of Relevant Samples Size from Population Database


Step 2 - Approaches for Defining Global Market Size (Value, Volume* & Price*)

Note*: In applicable scenarios
Step 3 - Data Sources
Primary Research
- Web Analytics
- Survey Reports
- Research Institute
- Latest Research Reports
- Opinion Leaders
Secondary Research
- Annual Reports
- White Paper
- Latest Press Release
- Industry Association
- Paid Database
- Investor Presentations

Step 4 - Data Triangulation
Involves using different sources of information in order to increase the validity of a study
These sources are likely to be stakeholders in a program - participants, other researchers, program staff, other community members, and so on.
Then we put all data in single framework & apply various statistical tools to find out the dynamic on the market.
During the analysis stage, feedback from the stakeholder groups would be compared to determine areas of agreement as well as areas of divergence