

Key Insights
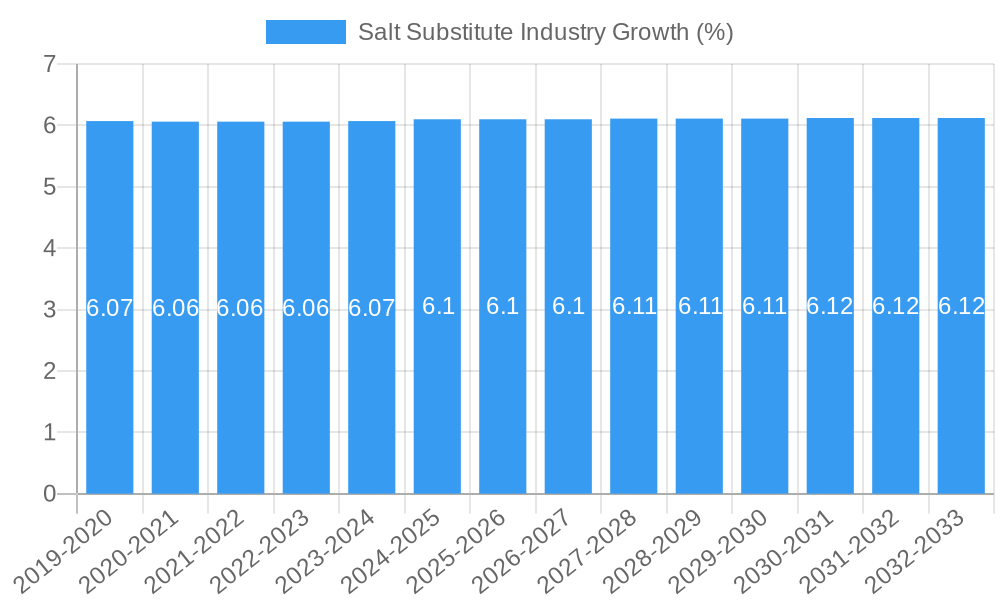
The global salt substitute market is poised for significant expansion, projected to reach approximately $1.30 million in value by 2025 and exhibit a robust Compound Annual Growth Rate (CAGR) of 6.59% through 2033. This growth is primarily fueled by a growing global awareness of the adverse health effects associated with excessive sodium consumption, leading consumers to actively seek healthier alternatives. Rising prevalence of cardiovascular diseases and hypertension worldwide acts as a major impetus for the adoption of salt substitutes. Furthermore, evolving consumer preferences towards clean-label products and a demand for improved taste profiles in low-sodium foods are driving innovation and market penetration. The food and beverage industry's proactive approach in reformulating products to reduce sodium content, coupled with supportive government initiatives and public health campaigns promoting healthier diets, are also contributing positively to market dynamics.
The market is segmented across various types of salt substitutes, including mineral salts, amino acids, yeast extracts, and hydrolyzed vegetable protein, each catering to specific functional and flavor needs in diverse food applications. Bakery and confectionery, snacks, meat and poultry, and beverages represent key application segments witnessing substantial demand for these alternatives. Emerging trends such as the development of novel flavor enhancers and umami-rich ingredients, alongside advancements in processing technologies that maintain palatability in reduced-sodium products, are further shaping the market landscape. While growth is strong, potential restraints include the lingering taste perception challenges of some salt substitutes and the cost-effectiveness compared to traditional salt, which could moderate the pace of adoption in certain price-sensitive markets. However, with ongoing research and development and increasing consumer education, these challenges are expected to be overcome, paving the way for sustained market growth.
This comprehensive report delves deep into the burgeoning Salt Substitute Market, a dynamic sector poised for significant expansion driven by rising health consciousness and evolving consumer preferences. With a study period spanning from 2019 to 2033, and a base and estimated year of 2025, this analysis provides critical insights into the historical period (2019–2024) and a robust forecast period (2025–2033). Discover actionable intelligence on market dynamics, key trends, leading segments, product innovations, growth drivers, challenges, emerging opportunities, and the strategic outlook for this vital industry. This report is your definitive guide to navigating the sodium reduction market, potassium chloride market, low-sodium ingredients, and healthy food alternatives.
Salt Substitute Industry Market Dynamics & Concentration
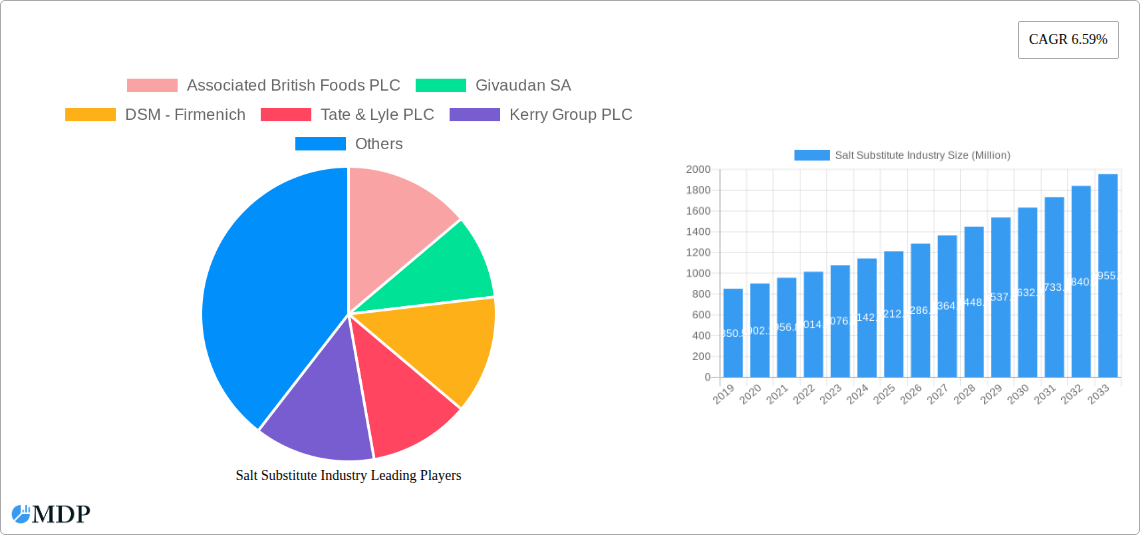
The Salt Substitute Industry exhibits a moderately concentrated market structure, with a few key players holding significant market share, estimated at over 60%. Innovation drivers are primarily focused on enhancing taste profiles to mimic traditional salt, improving the nutritional value of substitutes, and developing cost-effective production methods. Regulatory frameworks, particularly concerning health claims and ingredient safety, play a pivotal role in shaping market entry and product development. The increasing awareness of the detrimental health effects of excessive sodium intake fuels demand for alternatives, creating a strong end-user trend towards healthier food choices. Product substitutes, while growing, still face challenges in fully replicating the complex flavor and functional properties of sodium chloride. Mergers and acquisitions (M&A) activities are on the rise, with an estimated 5-7 significant M&A deals annually over the past three years, indicating a consolidation drive by larger entities to expand their product portfolios and market reach.
- Market Share: Leading companies collectively hold over 60% of the market.
- M&A Deal Count: An average of 5-7 significant M&A deals per year (2021-2023).
- Innovation Focus: Taste enhancement, nutritional fortification, and cost-effective production.
- Regulatory Impact: Crucial for market access and product claims.
Salt Substitute Industry Industry Trends & Analysis
The Salt Substitute Industry is experiencing robust growth, projected to achieve a Compound Annual Growth Rate (CAGR) of approximately 8.5% during the forecast period. This expansion is propelled by a confluence of factors, including the escalating global prevalence of lifestyle diseases such as hypertension and cardiovascular ailments, which directly correlate with high sodium consumption. Consumers are increasingly proactive in managing their health, actively seeking out food products and ingredients that contribute to a lower sodium intake. This burgeoning health consciousness translates into a significant shift in consumer preferences, with a growing demand for low-sodium food options, healthy savory ingredients, and salt alternatives for processed foods. Technological advancements are playing a crucial role, with ongoing research and development efforts focused on creating salt substitutes that offer superior taste, texture, and functionality, thereby minimizing the compromise often associated with traditional low-sodium products. Companies are investing heavily in R&D to develop novel compounds and blends that can effectively deliver a satisfying salty taste without the adverse health consequences of excessive sodium. For instance, the development of potassium-based salt substitutes and natural flavor enhancers are key areas of innovation. The competitive landscape is intensifying, with established food ingredient manufacturers and emerging startups alike vying for market share. This competitive pressure is driving innovation, encouraging product differentiation, and pushing down prices, making salt substitutes more accessible to a wider consumer base. Market penetration is steadily increasing across various food categories, from baked goods and snacks to processed meats and beverages, as manufacturers incorporate these ingredients to meet consumer demand for healthier options. The global salt reduction market is thus characterized by dynamic innovation and a strong consumer pull, setting the stage for sustained growth in the coming years.
Leading Markets & Segments in Salt Substitute Industry
The Mineral Salts segment, primarily driven by potassium chloride and its various formulations, is projected to dominate the Salt Substitute Industry in terms of market value. This dominance is attributed to its widespread availability, cost-effectiveness, and proven efficacy in providing a salty taste. The Bakery and Confectionery application segment is also a significant revenue generator, with manufacturers increasingly reformulating products to cater to health-conscious consumers seeking reduced sodium options without compromising on taste. Economic policies promoting healthier food choices and government initiatives to curb non-communicable diseases are key drivers in these segments.
- Dominant Segment (Type): Mineral Salts (e.g., Potassium Chloride, Magnesium Sulfate)
- Key Drivers:
- Cost-effectiveness and widespread availability.
- Proven efficacy in delivering salty taste.
- Government initiatives for sodium reduction.
- Versatility in various food formulations.
- Key Drivers:
- Dominant Segment (Application): Bakery and Confectionery
- Key Drivers:
- High consumer demand for healthier baked goods.
- Ease of integration into existing product lines.
- Ability to maintain product texture and shelf life.
- Growing trend of free-from claims.
- Key Drivers:
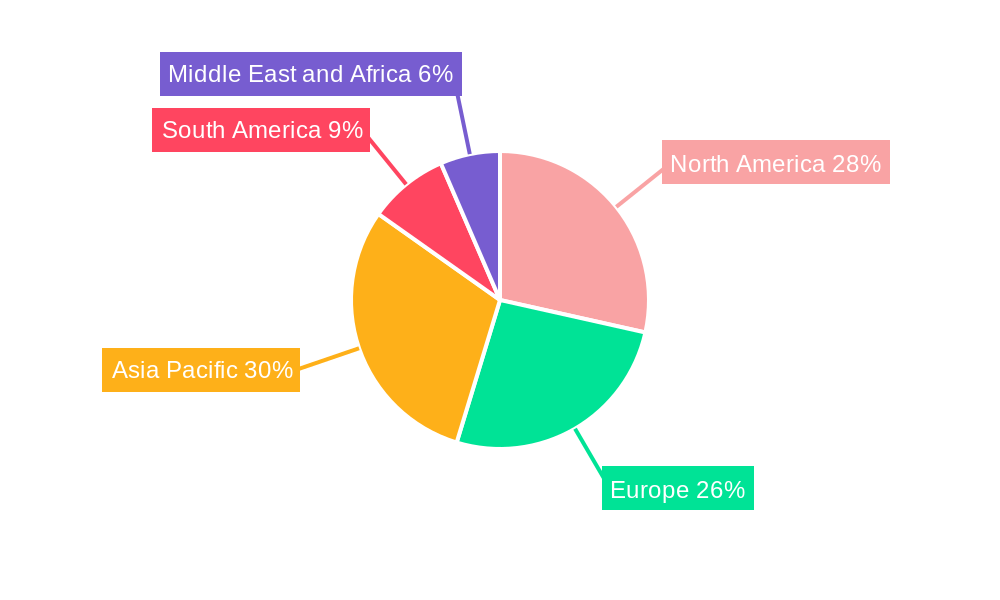
- Emerging Region: North America and Europe currently lead the market due to established regulatory frameworks and high consumer awareness regarding health and wellness. However, the Asia-Pacific region is expected to witness the fastest growth due to a rapidly expanding middle class, increasing disposable incomes, and a growing awareness of health issues related to high sodium intake.
- Key Country: The United States is a leading market, driven by strong consumer demand for low-sodium products and supportive government health initiatives.
Salt Substitute Industry Product Developments
Product innovation in the Salt Substitute Industry is rapidly advancing, focusing on creating a more authentic salty taste and improving nutritional profiles. Companies are leveraging cutting-edge technologies like microencapsulation and advanced blending techniques to mask the bitter aftertaste often associated with mineral-based substitutes and to enhance their solubility and performance in various food matrices. The development of natural and clean-label salt substitutes, derived from sources like yeast extracts and specialized fermentation processes, is a key trend. These innovations offer manufacturers a competitive advantage by enabling them to meet stringent consumer demands for healthier, more transparent ingredient lists without compromising on the sensory experience of their products.
Key Drivers of Salt Substitute Industry Growth
Several key factors are propelling the growth of the Salt Substitute Industry. The escalating global health consciousness, driven by rising rates of cardiovascular diseases and hypertension, is a primary catalyst. Government initiatives and public health campaigns promoting sodium reduction are further boosting demand. Technological advancements in ingredient formulation are enabling the creation of more palatable and functional salt substitutes. Furthermore, the growing demand for processed and convenience foods, coupled with a consumer desire for healthier options within these categories, presents a significant market opportunity. The increasing emphasis on clean labels and natural ingredients is also driving the development and adoption of salt substitutes derived from natural sources.
Challenges in the Salt Substitute Industry Market
Despite its promising growth, the Salt Substitute Industry faces several challenges. A primary hurdle is the often-perceived compromise in taste and texture compared to traditional sodium chloride. Developing substitutes that perfectly replicate the complex flavor profile and functional properties of salt remains an ongoing challenge. Regulatory hurdles, particularly concerning the approval and labeling of new ingredients in different regions, can also slow down market entry. Supply chain complexities and the cost of raw materials for certain advanced salt substitutes can impact their affordability and accessibility. Furthermore, intense competition from both established players and new entrants necessitates continuous innovation and aggressive pricing strategies.
Emerging Opportunities in Salt Substitute Industry
The Salt Substitute Industry is brimming with emerging opportunities. The growing demand for plant-based and vegan food products presents a significant avenue for innovation, as consumers seek naturally derived salt substitutes. Strategic partnerships between ingredient manufacturers and food product developers are crucial for accelerating the adoption of these substitutes in mainstream food products. Technological breakthroughs in areas like precision fermentation and biotechnology hold the potential to create novel, highly effective, and cost-efficient salt alternatives. Expansion into emerging economies, where awareness of health issues related to high sodium intake is growing, offers substantial untapped market potential.
Leading Players in the Salt Substitute Industry Sector
- Associated British Foods PLC
- Givaudan SA
- DSM - Firmenich
- Tate & Lyle PLC
- Kerry Group PLC
- Cargill Inc
- Corbion NV
- Angel Yeast Co Ltd
- Ajinomoto Co Inc
- Lallemand Inc
Key Milestones in Salt Substitute Industry Industry
- June 2024: DSM-Firmenich partnered with Deloitte to bolster sustainable food systems. Integrating with Deloitte's drive for innovative climate and nature-friendly solutions, this collaboration leverages DSM-Firmenich's Sustell platform. This platform is designed to gauge the environmental footprint of large-scale animal protein production accurately.
- May 2024: Corbion expanded its partnership with IMCD, a worldwide distributor and formulator of specialty chemicals and ingredients, to encompass Corbion's offerings tailored for Thailand's Food and Beverage sector.
- April 2024: Kerry Group launched TasteSense Salt, a sodium reduction solution that delivers a salty and savory taste without adding sodium to products. The product is used in processed food products.
Strategic Outlook for Salt Substitute Industry Market
The strategic outlook for the Salt Substitute Industry is highly positive, driven by an unwavering global focus on health and wellness. Key growth accelerators include the continued development of sophisticated, taste-mimicking salt substitutes and the expansion of applications across a wider range of food and beverage categories. Strategic alliances between ingredient suppliers and major food manufacturers will be critical in driving wider adoption and scaling production. Investment in research and development to explore novel sources of salt alternatives and enhance existing formulations will remain paramount. Furthermore, navigating evolving regulatory landscapes and capitalizing on the increasing consumer preference for clean-label ingredients will be crucial for long-term success. The market is poised for sustained growth as it plays an integral role in shaping healthier dietary habits worldwide.
Salt Substitute Industry Segmentation
-
1. Type
- 1.1. Mineral Salts
- 1.2. Amino Acids
- 1.3. Yeast Extracts
- 1.4. Hydrolyzed Vegetable Protein
- 1.5. Other Types
-
2. Application
- 2.1. Bakery and Confectionery
- 2.2. Snacks
- 2.3. Meat and Poultry
- 2.4. Beverages
- 2.5. Soups, Salads, Sauces, and Dressings
- 2.6. Other Applications
Salt Substitute Industry Segmentation By Geography
-
1. North America
- 1.1. United States
- 1.2. Canada
- 1.3. Mexico
- 1.4. Rest of North America
-
2. Europe
- 2.1. United Kingdom
- 2.2. Germany
- 2.3. France
- 2.4. Russia
- 2.5. Italy
- 2.6. Spain
- 2.7. Rest of Europe
-
3. Asia Pacific
- 3.1. India
- 3.2. China
- 3.3. Japan
- 3.4. Australia
- 3.5. Rest of Asia Pacific
-
4. South America
- 4.1. Brazil
- 4.2. Argentina
- 4.3. Rest of South America
-
5. Middle East and Africa
- 5.1. South Africa
- 5.2. Saudi Arabia
- 5.3. Rest of Middle East and Africa
Salt Substitute Industry REPORT HIGHLIGHTS
| Aspects | Details |
|---|---|
| Study Period | 2019-2033 |
| Base Year | 2024 |
| Estimated Year | 2025 |
| Forecast Period | 2025-2033 |
| Historical Period | 2019-2024 |
| Growth Rate | CAGR of 6.59% from 2019-2033 |
| Segmentation |
|
Table of Contents
- 1. Introduction
- 1.1. Research Scope
- 1.2. Market Segmentation
- 1.3. Research Methodology
- 1.4. Definitions and Assumptions
- 2. Executive Summary
- 2.1. Introduction
- 3. Market Dynamics
- 3.1. Introduction
- 3.2. Market Drivers
- 3.2.1. Surge In Hypertension
- 3.3. Market Restrains
- 3.3.1. Challenges And Opportunities In The Salt Substitute Market Amidst Rising Common Salt Production
- 3.4. Market Trends
- 3.4.1. Rising Hypertension Rates Drive Demand for Salt Substitutes on a Global Scale
- 4. Market Factor Analysis
- 4.1. Porters Five Forces
- 4.2. Supply/Value Chain
- 4.3. PESTEL analysis
- 4.4. Market Entropy
- 4.5. Patent/Trademark Analysis
- 5. Global Salt Substitute Industry Analysis, Insights and Forecast, 2019-2031
- 5.1. Market Analysis, Insights and Forecast - by Type
- 5.1.1. Mineral Salts
- 5.1.2. Amino Acids
- 5.1.3. Yeast Extracts
- 5.1.4. Hydrolyzed Vegetable Protein
- 5.1.5. Other Types
- 5.2. Market Analysis, Insights and Forecast - by Application
- 5.2.1. Bakery and Confectionery
- 5.2.2. Snacks
- 5.2.3. Meat and Poultry
- 5.2.4. Beverages
- 5.2.5. Soups, Salads, Sauces, and Dressings
- 5.2.6. Other Applications
- 5.3. Market Analysis, Insights and Forecast - by Region
- 5.3.1. North America
- 5.3.2. Europe
- 5.3.3. Asia Pacific
- 5.3.4. South America
- 5.3.5. Middle East and Africa
- 5.1. Market Analysis, Insights and Forecast - by Type
- 6. North America Salt Substitute Industry Analysis, Insights and Forecast, 2019-2031
- 6.1. Market Analysis, Insights and Forecast - by Type
- 6.1.1. Mineral Salts
- 6.1.2. Amino Acids
- 6.1.3. Yeast Extracts
- 6.1.4. Hydrolyzed Vegetable Protein
- 6.1.5. Other Types
- 6.2. Market Analysis, Insights and Forecast - by Application
- 6.2.1. Bakery and Confectionery
- 6.2.2. Snacks
- 6.2.3. Meat and Poultry
- 6.2.4. Beverages
- 6.2.5. Soups, Salads, Sauces, and Dressings
- 6.2.6. Other Applications
- 6.1. Market Analysis, Insights and Forecast - by Type
- 7. Europe Salt Substitute Industry Analysis, Insights and Forecast, 2019-2031
- 7.1. Market Analysis, Insights and Forecast - by Type
- 7.1.1. Mineral Salts
- 7.1.2. Amino Acids
- 7.1.3. Yeast Extracts
- 7.1.4. Hydrolyzed Vegetable Protein
- 7.1.5. Other Types
- 7.2. Market Analysis, Insights and Forecast - by Application
- 7.2.1. Bakery and Confectionery
- 7.2.2. Snacks
- 7.2.3. Meat and Poultry
- 7.2.4. Beverages
- 7.2.5. Soups, Salads, Sauces, and Dressings
- 7.2.6. Other Applications
- 7.1. Market Analysis, Insights and Forecast - by Type
- 8. Asia Pacific Salt Substitute Industry Analysis, Insights and Forecast, 2019-2031
- 8.1. Market Analysis, Insights and Forecast - by Type
- 8.1.1. Mineral Salts
- 8.1.2. Amino Acids
- 8.1.3. Yeast Extracts
- 8.1.4. Hydrolyzed Vegetable Protein
- 8.1.5. Other Types
- 8.2. Market Analysis, Insights and Forecast - by Application
- 8.2.1. Bakery and Confectionery
- 8.2.2. Snacks
- 8.2.3. Meat and Poultry
- 8.2.4. Beverages
- 8.2.5. Soups, Salads, Sauces, and Dressings
- 8.2.6. Other Applications
- 8.1. Market Analysis, Insights and Forecast - by Type
- 9. South America Salt Substitute Industry Analysis, Insights and Forecast, 2019-2031
- 9.1. Market Analysis, Insights and Forecast - by Type
- 9.1.1. Mineral Salts
- 9.1.2. Amino Acids
- 9.1.3. Yeast Extracts
- 9.1.4. Hydrolyzed Vegetable Protein
- 9.1.5. Other Types
- 9.2. Market Analysis, Insights and Forecast - by Application
- 9.2.1. Bakery and Confectionery
- 9.2.2. Snacks
- 9.2.3. Meat and Poultry
- 9.2.4. Beverages
- 9.2.5. Soups, Salads, Sauces, and Dressings
- 9.2.6. Other Applications
- 9.1. Market Analysis, Insights and Forecast - by Type
- 10. Middle East and Africa Salt Substitute Industry Analysis, Insights and Forecast, 2019-2031
- 10.1. Market Analysis, Insights and Forecast - by Type
- 10.1.1. Mineral Salts
- 10.1.2. Amino Acids
- 10.1.3. Yeast Extracts
- 10.1.4. Hydrolyzed Vegetable Protein
- 10.1.5. Other Types
- 10.2. Market Analysis, Insights and Forecast - by Application
- 10.2.1. Bakery and Confectionery
- 10.2.2. Snacks
- 10.2.3. Meat and Poultry
- 10.2.4. Beverages
- 10.2.5. Soups, Salads, Sauces, and Dressings
- 10.2.6. Other Applications
- 10.1. Market Analysis, Insights and Forecast - by Type
- 11. North America Salt Substitute Industry Analysis, Insights and Forecast, 2019-2031
- 11.1. Market Analysis, Insights and Forecast - By Country/Sub-region
- 11.1.1 United States
- 11.1.2 Canada
- 11.1.3 Mexico
- 11.1.4 Rest of North America
- 12. Europe Salt Substitute Industry Analysis, Insights and Forecast, 2019-2031
- 12.1. Market Analysis, Insights and Forecast - By Country/Sub-region
- 12.1.1 United Kingdom
- 12.1.2 Germany
- 12.1.3 France
- 12.1.4 Russia
- 12.1.5 Italy
- 12.1.6 Spain
- 12.1.7 Rest of Europe
- 13. Asia Pacific Salt Substitute Industry Analysis, Insights and Forecast, 2019-2031
- 13.1. Market Analysis, Insights and Forecast - By Country/Sub-region
- 13.1.1 India
- 13.1.2 China
- 13.1.3 Japan
- 13.1.4 Australia
- 13.1.5 Rest of Asia Pacific
- 14. South America Salt Substitute Industry Analysis, Insights and Forecast, 2019-2031
- 14.1. Market Analysis, Insights and Forecast - By Country/Sub-region
- 14.1.1 Brazil
- 14.1.2 Argentina
- 14.1.3 Rest of South America
- 15. Middle East and Africa Salt Substitute Industry Analysis, Insights and Forecast, 2019-2031
- 15.1. Market Analysis, Insights and Forecast - By Country/Sub-region
- 15.1.1 South Africa
- 15.1.2 Saudi Arabia
- 15.1.3 Rest of Middle East and Africa
- 16. Competitive Analysis
- 16.1. Global Market Share Analysis 2024
- 16.2. Company Profiles
- 16.2.1 Associated British Foods PLC
- 16.2.1.1. Overview
- 16.2.1.2. Products
- 16.2.1.3. SWOT Analysis
- 16.2.1.4. Recent Developments
- 16.2.1.5. Financials (Based on Availability)
- 16.2.2 Givaudan SA
- 16.2.2.1. Overview
- 16.2.2.2. Products
- 16.2.2.3. SWOT Analysis
- 16.2.2.4. Recent Developments
- 16.2.2.5. Financials (Based on Availability)
- 16.2.3 DSM - Firmenich
- 16.2.3.1. Overview
- 16.2.3.2. Products
- 16.2.3.3. SWOT Analysis
- 16.2.3.4. Recent Developments
- 16.2.3.5. Financials (Based on Availability)
- 16.2.4 Tate & Lyle PLC
- 16.2.4.1. Overview
- 16.2.4.2. Products
- 16.2.4.3. SWOT Analysis
- 16.2.4.4. Recent Developments
- 16.2.4.5. Financials (Based on Availability)
- 16.2.5 Kerry Group PLC
- 16.2.5.1. Overview
- 16.2.5.2. Products
- 16.2.5.3. SWOT Analysis
- 16.2.5.4. Recent Developments
- 16.2.5.5. Financials (Based on Availability)
- 16.2.6 Cargill Inc
- 16.2.6.1. Overview
- 16.2.6.2. Products
- 16.2.6.3. SWOT Analysis
- 16.2.6.4. Recent Developments
- 16.2.6.5. Financials (Based on Availability)
- 16.2.7 Corbion NV
- 16.2.7.1. Overview
- 16.2.7.2. Products
- 16.2.7.3. SWOT Analysis
- 16.2.7.4. Recent Developments
- 16.2.7.5. Financials (Based on Availability)
- 16.2.8 Angel Yeast Co Ltd
- 16.2.8.1. Overview
- 16.2.8.2. Products
- 16.2.8.3. SWOT Analysis
- 16.2.8.4. Recent Developments
- 16.2.8.5. Financials (Based on Availability)
- 16.2.9 Ajinomoto Co Inc *List Not Exhaustive
- 16.2.9.1. Overview
- 16.2.9.2. Products
- 16.2.9.3. SWOT Analysis
- 16.2.9.4. Recent Developments
- 16.2.9.5. Financials (Based on Availability)
- 16.2.10 Lallemand Inc
- 16.2.10.1. Overview
- 16.2.10.2. Products
- 16.2.10.3. SWOT Analysis
- 16.2.10.4. Recent Developments
- 16.2.10.5. Financials (Based on Availability)
- 16.2.1 Associated British Foods PLC
List of Figures
- Figure 1: Global Salt Substitute Industry Revenue Breakdown (Million, %) by Region 2024 & 2032
- Figure 2: North America Salt Substitute Industry Revenue (Million), by Country 2024 & 2032
- Figure 3: North America Salt Substitute Industry Revenue Share (%), by Country 2024 & 2032
- Figure 4: Europe Salt Substitute Industry Revenue (Million), by Country 2024 & 2032
- Figure 5: Europe Salt Substitute Industry Revenue Share (%), by Country 2024 & 2032
- Figure 6: Asia Pacific Salt Substitute Industry Revenue (Million), by Country 2024 & 2032
- Figure 7: Asia Pacific Salt Substitute Industry Revenue Share (%), by Country 2024 & 2032
- Figure 8: South America Salt Substitute Industry Revenue (Million), by Country 2024 & 2032
- Figure 9: South America Salt Substitute Industry Revenue Share (%), by Country 2024 & 2032
- Figure 10: Middle East and Africa Salt Substitute Industry Revenue (Million), by Country 2024 & 2032
- Figure 11: Middle East and Africa Salt Substitute Industry Revenue Share (%), by Country 2024 & 2032
- Figure 12: North America Salt Substitute Industry Revenue (Million), by Type 2024 & 2032
- Figure 13: North America Salt Substitute Industry Revenue Share (%), by Type 2024 & 2032
- Figure 14: North America Salt Substitute Industry Revenue (Million), by Application 2024 & 2032
- Figure 15: North America Salt Substitute Industry Revenue Share (%), by Application 2024 & 2032
- Figure 16: North America Salt Substitute Industry Revenue (Million), by Country 2024 & 2032
- Figure 17: North America Salt Substitute Industry Revenue Share (%), by Country 2024 & 2032
- Figure 18: Europe Salt Substitute Industry Revenue (Million), by Type 2024 & 2032
- Figure 19: Europe Salt Substitute Industry Revenue Share (%), by Type 2024 & 2032
- Figure 20: Europe Salt Substitute Industry Revenue (Million), by Application 2024 & 2032
- Figure 21: Europe Salt Substitute Industry Revenue Share (%), by Application 2024 & 2032
- Figure 22: Europe Salt Substitute Industry Revenue (Million), by Country 2024 & 2032
- Figure 23: Europe Salt Substitute Industry Revenue Share (%), by Country 2024 & 2032
- Figure 24: Asia Pacific Salt Substitute Industry Revenue (Million), by Type 2024 & 2032
- Figure 25: Asia Pacific Salt Substitute Industry Revenue Share (%), by Type 2024 & 2032
- Figure 26: Asia Pacific Salt Substitute Industry Revenue (Million), by Application 2024 & 2032
- Figure 27: Asia Pacific Salt Substitute Industry Revenue Share (%), by Application 2024 & 2032
- Figure 28: Asia Pacific Salt Substitute Industry Revenue (Million), by Country 2024 & 2032
- Figure 29: Asia Pacific Salt Substitute Industry Revenue Share (%), by Country 2024 & 2032
- Figure 30: South America Salt Substitute Industry Revenue (Million), by Type 2024 & 2032
- Figure 31: South America Salt Substitute Industry Revenue Share (%), by Type 2024 & 2032
- Figure 32: South America Salt Substitute Industry Revenue (Million), by Application 2024 & 2032
- Figure 33: South America Salt Substitute Industry Revenue Share (%), by Application 2024 & 2032
- Figure 34: South America Salt Substitute Industry Revenue (Million), by Country 2024 & 2032
- Figure 35: South America Salt Substitute Industry Revenue Share (%), by Country 2024 & 2032
- Figure 36: Middle East and Africa Salt Substitute Industry Revenue (Million), by Type 2024 & 2032
- Figure 37: Middle East and Africa Salt Substitute Industry Revenue Share (%), by Type 2024 & 2032
- Figure 38: Middle East and Africa Salt Substitute Industry Revenue (Million), by Application 2024 & 2032
- Figure 39: Middle East and Africa Salt Substitute Industry Revenue Share (%), by Application 2024 & 2032
- Figure 40: Middle East and Africa Salt Substitute Industry Revenue (Million), by Country 2024 & 2032
- Figure 41: Middle East and Africa Salt Substitute Industry Revenue Share (%), by Country 2024 & 2032
List of Tables
- Table 1: Global Salt Substitute Industry Revenue Million Forecast, by Region 2019 & 2032
- Table 2: Global Salt Substitute Industry Revenue Million Forecast, by Type 2019 & 2032
- Table 3: Global Salt Substitute Industry Revenue Million Forecast, by Application 2019 & 2032
- Table 4: Global Salt Substitute Industry Revenue Million Forecast, by Region 2019 & 2032
- Table 5: Global Salt Substitute Industry Revenue Million Forecast, by Country 2019 & 2032
- Table 6: United States Salt Substitute Industry Revenue (Million) Forecast, by Application 2019 & 2032
- Table 7: Canada Salt Substitute Industry Revenue (Million) Forecast, by Application 2019 & 2032
- Table 8: Mexico Salt Substitute Industry Revenue (Million) Forecast, by Application 2019 & 2032
- Table 9: Rest of North America Salt Substitute Industry Revenue (Million) Forecast, by Application 2019 & 2032
- Table 10: Global Salt Substitute Industry Revenue Million Forecast, by Country 2019 & 2032
- Table 11: United Kingdom Salt Substitute Industry Revenue (Million) Forecast, by Application 2019 & 2032
- Table 12: Germany Salt Substitute Industry Revenue (Million) Forecast, by Application 2019 & 2032
- Table 13: France Salt Substitute Industry Revenue (Million) Forecast, by Application 2019 & 2032
- Table 14: Russia Salt Substitute Industry Revenue (Million) Forecast, by Application 2019 & 2032
- Table 15: Italy Salt Substitute Industry Revenue (Million) Forecast, by Application 2019 & 2032
- Table 16: Spain Salt Substitute Industry Revenue (Million) Forecast, by Application 2019 & 2032
- Table 17: Rest of Europe Salt Substitute Industry Revenue (Million) Forecast, by Application 2019 & 2032
- Table 18: Global Salt Substitute Industry Revenue Million Forecast, by Country 2019 & 2032
- Table 19: India Salt Substitute Industry Revenue (Million) Forecast, by Application 2019 & 2032
- Table 20: China Salt Substitute Industry Revenue (Million) Forecast, by Application 2019 & 2032
- Table 21: Japan Salt Substitute Industry Revenue (Million) Forecast, by Application 2019 & 2032
- Table 22: Australia Salt Substitute Industry Revenue (Million) Forecast, by Application 2019 & 2032
- Table 23: Rest of Asia Pacific Salt Substitute Industry Revenue (Million) Forecast, by Application 2019 & 2032
- Table 24: Global Salt Substitute Industry Revenue Million Forecast, by Country 2019 & 2032
- Table 25: Brazil Salt Substitute Industry Revenue (Million) Forecast, by Application 2019 & 2032
- Table 26: Argentina Salt Substitute Industry Revenue (Million) Forecast, by Application 2019 & 2032
- Table 27: Rest of South America Salt Substitute Industry Revenue (Million) Forecast, by Application 2019 & 2032
- Table 28: Global Salt Substitute Industry Revenue Million Forecast, by Country 2019 & 2032
- Table 29: South Africa Salt Substitute Industry Revenue (Million) Forecast, by Application 2019 & 2032
- Table 30: Saudi Arabia Salt Substitute Industry Revenue (Million) Forecast, by Application 2019 & 2032
- Table 31: Rest of Middle East and Africa Salt Substitute Industry Revenue (Million) Forecast, by Application 2019 & 2032
- Table 32: Global Salt Substitute Industry Revenue Million Forecast, by Type 2019 & 2032
- Table 33: Global Salt Substitute Industry Revenue Million Forecast, by Application 2019 & 2032
- Table 34: Global Salt Substitute Industry Revenue Million Forecast, by Country 2019 & 2032
- Table 35: United States Salt Substitute Industry Revenue (Million) Forecast, by Application 2019 & 2032
- Table 36: Canada Salt Substitute Industry Revenue (Million) Forecast, by Application 2019 & 2032
- Table 37: Mexico Salt Substitute Industry Revenue (Million) Forecast, by Application 2019 & 2032
- Table 38: Rest of North America Salt Substitute Industry Revenue (Million) Forecast, by Application 2019 & 2032
- Table 39: Global Salt Substitute Industry Revenue Million Forecast, by Type 2019 & 2032
- Table 40: Global Salt Substitute Industry Revenue Million Forecast, by Application 2019 & 2032
- Table 41: Global Salt Substitute Industry Revenue Million Forecast, by Country 2019 & 2032
- Table 42: United Kingdom Salt Substitute Industry Revenue (Million) Forecast, by Application 2019 & 2032
- Table 43: Germany Salt Substitute Industry Revenue (Million) Forecast, by Application 2019 & 2032
- Table 44: France Salt Substitute Industry Revenue (Million) Forecast, by Application 2019 & 2032
- Table 45: Russia Salt Substitute Industry Revenue (Million) Forecast, by Application 2019 & 2032
- Table 46: Italy Salt Substitute Industry Revenue (Million) Forecast, by Application 2019 & 2032
- Table 47: Spain Salt Substitute Industry Revenue (Million) Forecast, by Application 2019 & 2032
- Table 48: Rest of Europe Salt Substitute Industry Revenue (Million) Forecast, by Application 2019 & 2032
- Table 49: Global Salt Substitute Industry Revenue Million Forecast, by Type 2019 & 2032
- Table 50: Global Salt Substitute Industry Revenue Million Forecast, by Application 2019 & 2032
- Table 51: Global Salt Substitute Industry Revenue Million Forecast, by Country 2019 & 2032
- Table 52: India Salt Substitute Industry Revenue (Million) Forecast, by Application 2019 & 2032
- Table 53: China Salt Substitute Industry Revenue (Million) Forecast, by Application 2019 & 2032
- Table 54: Japan Salt Substitute Industry Revenue (Million) Forecast, by Application 2019 & 2032
- Table 55: Australia Salt Substitute Industry Revenue (Million) Forecast, by Application 2019 & 2032
- Table 56: Rest of Asia Pacific Salt Substitute Industry Revenue (Million) Forecast, by Application 2019 & 2032
- Table 57: Global Salt Substitute Industry Revenue Million Forecast, by Type 2019 & 2032
- Table 58: Global Salt Substitute Industry Revenue Million Forecast, by Application 2019 & 2032
- Table 59: Global Salt Substitute Industry Revenue Million Forecast, by Country 2019 & 2032
- Table 60: Brazil Salt Substitute Industry Revenue (Million) Forecast, by Application 2019 & 2032
- Table 61: Argentina Salt Substitute Industry Revenue (Million) Forecast, by Application 2019 & 2032
- Table 62: Rest of South America Salt Substitute Industry Revenue (Million) Forecast, by Application 2019 & 2032
- Table 63: Global Salt Substitute Industry Revenue Million Forecast, by Type 2019 & 2032
- Table 64: Global Salt Substitute Industry Revenue Million Forecast, by Application 2019 & 2032
- Table 65: Global Salt Substitute Industry Revenue Million Forecast, by Country 2019 & 2032
- Table 66: South Africa Salt Substitute Industry Revenue (Million) Forecast, by Application 2019 & 2032
- Table 67: Saudi Arabia Salt Substitute Industry Revenue (Million) Forecast, by Application 2019 & 2032
- Table 68: Rest of Middle East and Africa Salt Substitute Industry Revenue (Million) Forecast, by Application 2019 & 2032
Frequently Asked Questions
1. What is the projected Compound Annual Growth Rate (CAGR) of the Salt Substitute Industry?
The projected CAGR is approximately 6.59%.
2. Which companies are prominent players in the Salt Substitute Industry?
Key companies in the market include Associated British Foods PLC, Givaudan SA, DSM - Firmenich, Tate & Lyle PLC, Kerry Group PLC, Cargill Inc, Corbion NV, Angel Yeast Co Ltd, Ajinomoto Co Inc *List Not Exhaustive, Lallemand Inc .
3. What are the main segments of the Salt Substitute Industry?
The market segments include Type, Application.
4. Can you provide details about the market size?
The market size is estimated to be USD 1.30 Million as of 2022.
5. What are some drivers contributing to market growth?
Surge In Hypertension: A Catalyst For The Salt Substitute Market; Salt: A Key Ingredient In Convenience Food.
6. What are the notable trends driving market growth?
Rising Hypertension Rates Drive Demand for Salt Substitutes on a Global Scale.
7. Are there any restraints impacting market growth?
Challenges And Opportunities In The Salt Substitute Market Amidst Rising Common Salt Production.
8. Can you provide examples of recent developments in the market?
June 2024: DSM-Firmenich partnered with Deloitte to bolster sustainable food systems. Integrating with Deloitte's drive for innovative climate and nature-friendly solutions, this collaboration leverages DSM-Firmenich's Sustell platform. This platform is designed to gauge the environmental footprint of large-scale animal protein production accurately.
9. What pricing options are available for accessing the report?
Pricing options include single-user, multi-user, and enterprise licenses priced at USD 4750, USD 5250, and USD 8750 respectively.
10. Is the market size provided in terms of value or volume?
The market size is provided in terms of value, measured in Million.
11. Are there any specific market keywords associated with the report?
Yes, the market keyword associated with the report is "Salt Substitute Industry," which aids in identifying and referencing the specific market segment covered.
12. How do I determine which pricing option suits my needs best?
The pricing options vary based on user requirements and access needs. Individual users may opt for single-user licenses, while businesses requiring broader access may choose multi-user or enterprise licenses for cost-effective access to the report.
13. Are there any additional resources or data provided in the Salt Substitute Industry report?
While the report offers comprehensive insights, it's advisable to review the specific contents or supplementary materials provided to ascertain if additional resources or data are available.
14. How can I stay updated on further developments or reports in the Salt Substitute Industry?
To stay informed about further developments, trends, and reports in the Salt Substitute Industry, consider subscribing to industry newsletters, following relevant companies and organizations, or regularly checking reputable industry news sources and publications.
Methodology
Step 1 - Identification of Relevant Samples Size from Population Database


Step 2 - Approaches for Defining Global Market Size (Value, Volume* & Price*)

Note*: In applicable scenarios
Step 3 - Data Sources
Primary Research
- Web Analytics
- Survey Reports
- Research Institute
- Latest Research Reports
- Opinion Leaders
Secondary Research
- Annual Reports
- White Paper
- Latest Press Release
- Industry Association
- Paid Database
- Investor Presentations

Step 4 - Data Triangulation
Involves using different sources of information in order to increase the validity of a study
These sources are likely to be stakeholders in a program - participants, other researchers, program staff, other community members, and so on.
Then we put all data in single framework & apply various statistical tools to find out the dynamic on the market.
During the analysis stage, feedback from the stakeholder groups would be compared to determine areas of agreement as well as areas of divergence
