

Key Insights
The rigid trays packaging market is exhibiting strong expansion, propelled by escalating demand for convenient and sustainable packaging across diverse industries. Key growth drivers include the rising popularity of ready-to-eat meals, the burgeoning e-commerce sector necessitating secure product transit, and heightened consumer preference for environmentally conscious packaging. This surge has spurred innovations in materials, such as biodegradable and recyclable plastics, alongside advancements in tray designs for optimized automated filling and sealing. The market is projected to reach $220.2 billion by 2025, with a Compound Annual Growth Rate (CAGR) of 3.6% from the 2025 base year through 2033.
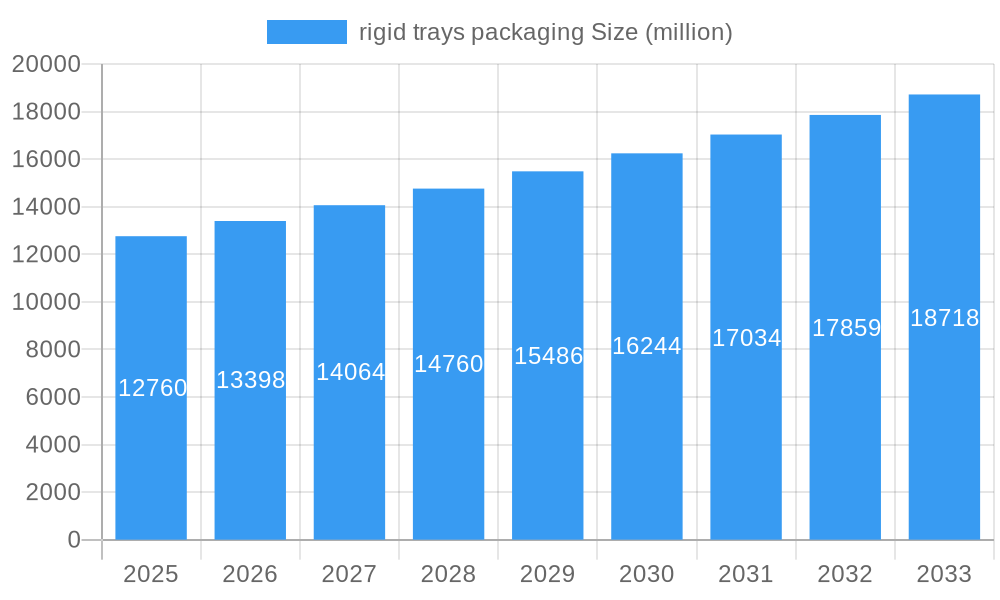
rigid trays packaging Market Size (In Billion)
Despite challenges such as raw material price volatility and stringent environmental regulations, the rigid trays packaging market is poised for substantial growth. Innovations in material science, automated packaging systems, and increasing demand from the food & beverage, pharmaceutical, and electronics sectors will fuel this expansion. The competitive landscape is dynamic, marked by established players and emerging companies, driving a continuous pursuit of innovation through strategic partnerships and product development to secure market share.
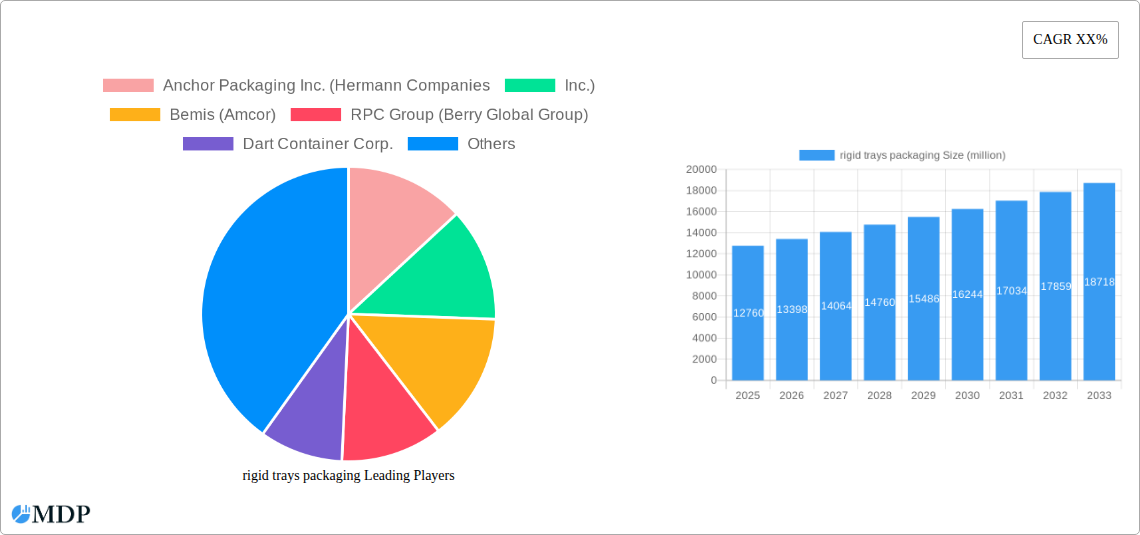
rigid trays packaging Company Market Share
Rigid Trays Packaging Market Report: A Comprehensive Analysis (2019-2033)
This comprehensive report provides an in-depth analysis of the global rigid trays packaging market, offering invaluable insights for industry stakeholders, investors, and strategic decision-makers. With a study period spanning 2019-2033, a base year of 2025, and a forecast period of 2025-2033, this report leverages extensive market research and data analysis to present a clear and actionable picture of this dynamic sector. The market is projected to reach $XX million by 2033, representing a substantial growth opportunity.
Rigid Trays Packaging Market Dynamics & Concentration
The global rigid trays packaging market is characterized by a moderately concentrated landscape, with a handful of major players commanding significant market share. The top ten companies – Anchor Packaging Inc. (Hermann Companies,Inc.), Bemis (Amcor), RPC Group (Berry Global Group), Dart Container Corp., DS Smith, Genpak LLC, Tekni-Plex Inc., Placon, Winpak Ltd., and Sonoco Products – collectively hold an estimated 60% market share in 2025. Market concentration is influenced by factors such as economies of scale in manufacturing, extensive distribution networks, and strong brand recognition. However, the market also witnesses significant competition from smaller regional players and emerging innovators.
Innovation is a key driver, with companies continuously developing sustainable and high-performance materials, such as recycled plastics and biodegradable options, to meet evolving consumer preferences and regulatory requirements. Stringent environmental regulations, particularly concerning plastic waste reduction, are reshaping the industry landscape, pushing companies to invest in eco-friendly solutions. The market also experiences competition from alternative packaging solutions, such as flexible films and paperboard cartons. Mergers and acquisitions (M&A) activity has been significant in recent years, with approximately XX major M&A deals reported between 2019 and 2024, further consolidating the market. These transactions aim to expand product portfolios, enhance geographical reach, and strengthen market positions.
- Market Share (2025 Estimate): Top 10 players: 60%; Others: 40%
- M&A Deal Count (2019-2024): XX
- Key Innovation Drivers: Sustainability, material innovation, automation.
- Major Regulatory Influences: Plastic waste reduction policies, food safety standards.
Rigid Trays Packaging Industry Trends & Analysis
The rigid trays packaging market exhibits robust growth, driven by several key factors. The rising demand for convenient and protective packaging across diverse end-use sectors, including food and beverages, pharmaceuticals, and electronics, fuels significant market expansion. Technological advancements, including automation in manufacturing and improved material science, contribute to enhanced efficiency and cost-effectiveness. Consumer preference for sustainable and recyclable packaging is also a major driver, prompting manufacturers to invest in eco-friendly options. The CAGR for the period 2025-2033 is projected to be XX%, with a significant market penetration expected in emerging economies. Competitive dynamics are intense, with companies competing on price, quality, innovation, and sustainability. Brand loyalty, however, plays a smaller role compared to other factors. The market is also impacted by fluctuating raw material prices and global economic conditions.
Leading Markets & Segments in Rigid Trays Packaging
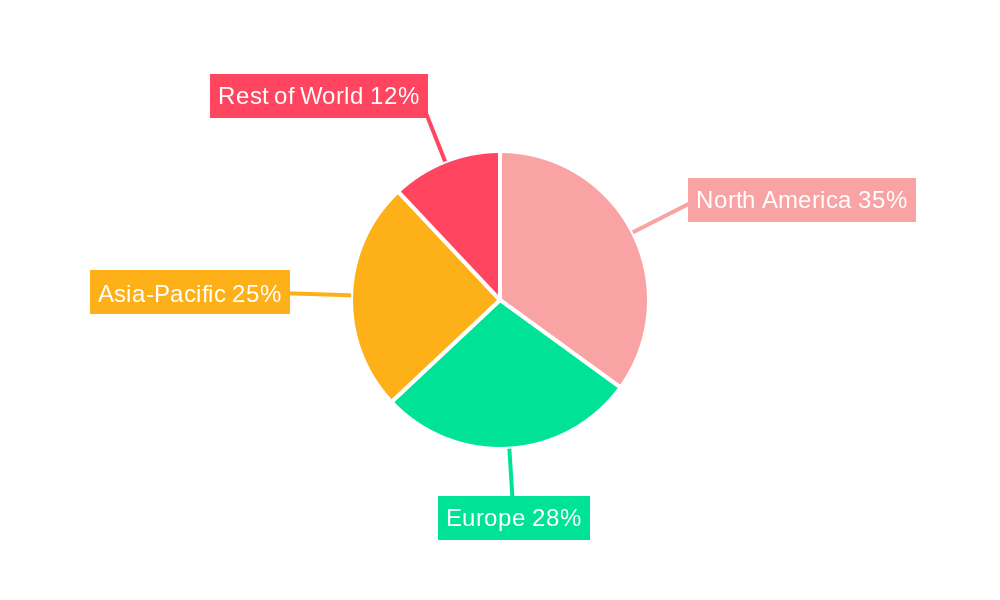
The North American region currently dominates the rigid trays packaging market, accounting for an estimated XX million in revenue in 2025. This dominance is attributed to several key factors:
- Robust Consumer Demand: High consumption of packaged goods, particularly in the food and beverage sector.
- Advanced Manufacturing Infrastructure: Well-established manufacturing base and technological capabilities.
- Favorable Economic Conditions: Strong economic growth and high disposable incomes.
- Stringent Regulatory Frameworks: Driving the adoption of sustainable packaging solutions.
The food and beverage segment represents the largest application area, accounting for an estimated XX million in 2025 revenue, due to the increasing demand for ready-to-eat meals and convenience foods. Europe and Asia Pacific are also significant markets, with considerable growth potential driven by rising disposable incomes and expanding middle-class populations.
Rigid Trays Packaging Product Developments
Recent advancements in rigid trays packaging focus on incorporating sustainable materials, enhancing product protection, and improving manufacturing efficiency. Innovations include the use of recycled plastics and plant-based materials, along with the development of lighter-weight trays for reduced material consumption and transportation costs. Improved barrier properties are also being incorporated to extend product shelf life and prevent contamination. These developments cater to the growing demand for eco-friendly and high-performance packaging solutions across various applications.
Key Drivers of Rigid Trays Packaging Growth
The growth of the rigid trays packaging market is propelled by several key factors. First, the rising demand for convenient and tamper-evident packaging across various industries is a major driver. Second, technological advancements in material science and manufacturing processes contribute to cost-efficiency and enhanced product protection. Third, stringent regulatory frameworks related to environmental sustainability are pushing the adoption of eco-friendly solutions. Finally, economic growth, especially in developing nations, is significantly expanding the market's addressable audience.
Challenges in the Rigid Trays Packaging Market
The rigid trays packaging market faces several significant challenges. Fluctuating raw material prices, especially for plastics, can significantly impact manufacturing costs and profitability. Competition from alternative packaging solutions, such as flexible packaging and paperboard cartons, poses a significant threat. Stringent environmental regulations, while driving innovation, can also increase compliance costs for manufacturers. Furthermore, supply chain disruptions can lead to production delays and increased costs, impacting market stability. These challenges can collectively impact the market’s growth trajectory and lead to increased price volatility.
Emerging Opportunities in Rigid Trays Packaging
The long-term growth of the rigid trays packaging market is fueled by several emerging opportunities. The increasing adoption of sustainable materials, such as recycled plastics and bioplastics, presents a significant growth area. Strategic partnerships between packaging manufacturers and brand owners are driving innovation and enhancing supply chain efficiency. Expansion into emerging markets, particularly in Asia Pacific and Africa, offers significant potential for growth, driven by rising consumption and evolving consumer preferences. Further technological advancements, such as improved automation and smart packaging solutions, will also unlock new opportunities.
Leading Players in the rigid trays packaging Sector
- Anchor Packaging Inc. (Hermann Companies,Inc.)
- Bemis (Amcor)
- RPC Group (Berry Global Group)
- Dart Container Corp.
- DS Smith
- Genpak LLC
- Tekni-Plex Inc.
- Placon
- Winpak Ltd.
- Sonoco Products
- Cambro
- Huhtamaki
- Pactiv
- GY Packaging
- East Coast Packaging
- LINPAC Packaging
- TEMMA SHIKI
- Quinn Packaging
Key Milestones in rigid trays packaging Industry
- 2020: Increased focus on sustainable packaging solutions due to growing environmental concerns.
- 2021: Several major players announced investments in new manufacturing facilities equipped with advanced technologies.
- 2022: Launch of several innovative rigid trays using recycled and bio-based materials.
- 2023: Increased M&A activity within the industry, leading to market consolidation.
- 2024: Several key players launched new product lines focusing on improved barrier properties and extended shelf life.
Strategic Outlook for rigid trays packaging Market
The future of the rigid trays packaging market appears promising, driven by continuous innovation in sustainable materials, automation, and product design. The market is expected to witness robust growth in the coming years, fueled by increasing demand across various end-use sectors and expansion into emerging markets. Strategic partnerships, investments in research and development, and a strong focus on sustainability will be crucial for companies to maintain their competitive advantage and capture the significant growth opportunities in this dynamic market.
rigid trays packaging Segmentation
-
1. Application
- 1.1. Pharmaceutical
- 1.2. Food
- 1.3. Electrical & Electronics
- 1.4. Consumer Goods
- 1.5. Healthcare
- 1.6. Others
-
2. Types
- 2.1. Plastic Rigid Trays Packaging
- 2.2. Metal Rigid Trays Packaging
- 2.3. Paper Rigid Trays Packaging
rigid trays packaging Segmentation By Geography
-
1. North America
- 1.1. United States
- 1.2. Canada
- 1.3. Mexico
-
2. South America
- 2.1. Brazil
- 2.2. Argentina
- 2.3. Rest of South America
-
3. Europe
- 3.1. United Kingdom
- 3.2. Germany
- 3.3. France
- 3.4. Italy
- 3.5. Spain
- 3.6. Russia
- 3.7. Benelux
- 3.8. Nordics
- 3.9. Rest of Europe
-
4. Middle East & Africa
- 4.1. Turkey
- 4.2. Israel
- 4.3. GCC
- 4.4. North Africa
- 4.5. South Africa
- 4.6. Rest of Middle East & Africa
-
5. Asia Pacific
- 5.1. China
- 5.2. India
- 5.3. Japan
- 5.4. South Korea
- 5.5. ASEAN
- 5.6. Oceania
- 5.7. Rest of Asia Pacific
rigid trays packaging Regional Market Share
Geographic Coverage of rigid trays packaging
rigid trays packaging REPORT HIGHLIGHTS
| Aspects | Details |
|---|---|
| Study Period | 2020-2034 |
| Base Year | 2025 |
| Estimated Year | 2026 |
| Forecast Period | 2026-2034 |
| Historical Period | 2020-2025 |
| Growth Rate | CAGR of 3.6% from 2020-2034 |
| Segmentation |
|
Table of Contents
- 1. Introduction
- 1.1. Research Scope
- 1.2. Market Segmentation
- 1.3. Research Methodology
- 1.4. Definitions and Assumptions
- 2. Executive Summary
- 2.1. Introduction
- 3. Market Dynamics
- 3.1. Introduction
- 3.2. Market Drivers
- 3.3. Market Restrains
- 3.4. Market Trends
- 4. Market Factor Analysis
- 4.1. Porters Five Forces
- 4.2. Supply/Value Chain
- 4.3. PESTEL analysis
- 4.4. Market Entropy
- 4.5. Patent/Trademark Analysis
- 5. Global rigid trays packaging Analysis, Insights and Forecast, 2020-2032
- 5.1. Market Analysis, Insights and Forecast - by Application
- 5.1.1. Pharmaceutical
- 5.1.2. Food
- 5.1.3. Electrical & Electronics
- 5.1.4. Consumer Goods
- 5.1.5. Healthcare
- 5.1.6. Others
- 5.2. Market Analysis, Insights and Forecast - by Types
- 5.2.1. Plastic Rigid Trays Packaging
- 5.2.2. Metal Rigid Trays Packaging
- 5.2.3. Paper Rigid Trays Packaging
- 5.3. Market Analysis, Insights and Forecast - by Region
- 5.3.1. North America
- 5.3.2. South America
- 5.3.3. Europe
- 5.3.4. Middle East & Africa
- 5.3.5. Asia Pacific
- 5.1. Market Analysis, Insights and Forecast - by Application
- 6. North America rigid trays packaging Analysis, Insights and Forecast, 2020-2032
- 6.1. Market Analysis, Insights and Forecast - by Application
- 6.1.1. Pharmaceutical
- 6.1.2. Food
- 6.1.3. Electrical & Electronics
- 6.1.4. Consumer Goods
- 6.1.5. Healthcare
- 6.1.6. Others
- 6.2. Market Analysis, Insights and Forecast - by Types
- 6.2.1. Plastic Rigid Trays Packaging
- 6.2.2. Metal Rigid Trays Packaging
- 6.2.3. Paper Rigid Trays Packaging
- 6.1. Market Analysis, Insights and Forecast - by Application
- 7. South America rigid trays packaging Analysis, Insights and Forecast, 2020-2032
- 7.1. Market Analysis, Insights and Forecast - by Application
- 7.1.1. Pharmaceutical
- 7.1.2. Food
- 7.1.3. Electrical & Electronics
- 7.1.4. Consumer Goods
- 7.1.5. Healthcare
- 7.1.6. Others
- 7.2. Market Analysis, Insights and Forecast - by Types
- 7.2.1. Plastic Rigid Trays Packaging
- 7.2.2. Metal Rigid Trays Packaging
- 7.2.3. Paper Rigid Trays Packaging
- 7.1. Market Analysis, Insights and Forecast - by Application
- 8. Europe rigid trays packaging Analysis, Insights and Forecast, 2020-2032
- 8.1. Market Analysis, Insights and Forecast - by Application
- 8.1.1. Pharmaceutical
- 8.1.2. Food
- 8.1.3. Electrical & Electronics
- 8.1.4. Consumer Goods
- 8.1.5. Healthcare
- 8.1.6. Others
- 8.2. Market Analysis, Insights and Forecast - by Types
- 8.2.1. Plastic Rigid Trays Packaging
- 8.2.2. Metal Rigid Trays Packaging
- 8.2.3. Paper Rigid Trays Packaging
- 8.1. Market Analysis, Insights and Forecast - by Application
- 9. Middle East & Africa rigid trays packaging Analysis, Insights and Forecast, 2020-2032
- 9.1. Market Analysis, Insights and Forecast - by Application
- 9.1.1. Pharmaceutical
- 9.1.2. Food
- 9.1.3. Electrical & Electronics
- 9.1.4. Consumer Goods
- 9.1.5. Healthcare
- 9.1.6. Others
- 9.2. Market Analysis, Insights and Forecast - by Types
- 9.2.1. Plastic Rigid Trays Packaging
- 9.2.2. Metal Rigid Trays Packaging
- 9.2.3. Paper Rigid Trays Packaging
- 9.1. Market Analysis, Insights and Forecast - by Application
- 10. Asia Pacific rigid trays packaging Analysis, Insights and Forecast, 2020-2032
- 10.1. Market Analysis, Insights and Forecast - by Application
- 10.1.1. Pharmaceutical
- 10.1.2. Food
- 10.1.3. Electrical & Electronics
- 10.1.4. Consumer Goods
- 10.1.5. Healthcare
- 10.1.6. Others
- 10.2. Market Analysis, Insights and Forecast - by Types
- 10.2.1. Plastic Rigid Trays Packaging
- 10.2.2. Metal Rigid Trays Packaging
- 10.2.3. Paper Rigid Trays Packaging
- 10.1. Market Analysis, Insights and Forecast - by Application
- 11. Competitive Analysis
- 11.1. Global Market Share Analysis 2025
- 11.2. Company Profiles
- 11.2.1 Anchor Packaging Inc. (Hermann Companies
- 11.2.1.1. Overview
- 11.2.1.2. Products
- 11.2.1.3. SWOT Analysis
- 11.2.1.4. Recent Developments
- 11.2.1.5. Financials (Based on Availability)
- 11.2.2 Inc.)
- 11.2.2.1. Overview
- 11.2.2.2. Products
- 11.2.2.3. SWOT Analysis
- 11.2.2.4. Recent Developments
- 11.2.2.5. Financials (Based on Availability)
- 11.2.3 Bemis (Amcor)
- 11.2.3.1. Overview
- 11.2.3.2. Products
- 11.2.3.3. SWOT Analysis
- 11.2.3.4. Recent Developments
- 11.2.3.5. Financials (Based on Availability)
- 11.2.4 RPC Group (Berry Global Group)
- 11.2.4.1. Overview
- 11.2.4.2. Products
- 11.2.4.3. SWOT Analysis
- 11.2.4.4. Recent Developments
- 11.2.4.5. Financials (Based on Availability)
- 11.2.5 Dart Container Corp.
- 11.2.5.1. Overview
- 11.2.5.2. Products
- 11.2.5.3. SWOT Analysis
- 11.2.5.4. Recent Developments
- 11.2.5.5. Financials (Based on Availability)
- 11.2.6 DS Smith
- 11.2.6.1. Overview
- 11.2.6.2. Products
- 11.2.6.3. SWOT Analysis
- 11.2.6.4. Recent Developments
- 11.2.6.5. Financials (Based on Availability)
- 11.2.7 Genpak LLC
- 11.2.7.1. Overview
- 11.2.7.2. Products
- 11.2.7.3. SWOT Analysis
- 11.2.7.4. Recent Developments
- 11.2.7.5. Financials (Based on Availability)
- 11.2.8 Tekni-Plex Inc.
- 11.2.8.1. Overview
- 11.2.8.2. Products
- 11.2.8.3. SWOT Analysis
- 11.2.8.4. Recent Developments
- 11.2.8.5. Financials (Based on Availability)
- 11.2.9 Placon
- 11.2.9.1. Overview
- 11.2.9.2. Products
- 11.2.9.3. SWOT Analysis
- 11.2.9.4. Recent Developments
- 11.2.9.5. Financials (Based on Availability)
- 11.2.10 Winpak Ltd.
- 11.2.10.1. Overview
- 11.2.10.2. Products
- 11.2.10.3. SWOT Analysis
- 11.2.10.4. Recent Developments
- 11.2.10.5. Financials (Based on Availability)
- 11.2.11 Sonoco Products
- 11.2.11.1. Overview
- 11.2.11.2. Products
- 11.2.11.3. SWOT Analysis
- 11.2.11.4. Recent Developments
- 11.2.11.5. Financials (Based on Availability)
- 11.2.12 Cambro
- 11.2.12.1. Overview
- 11.2.12.2. Products
- 11.2.12.3. SWOT Analysis
- 11.2.12.4. Recent Developments
- 11.2.12.5. Financials (Based on Availability)
- 11.2.13 Huhtamaki
- 11.2.13.1. Overview
- 11.2.13.2. Products
- 11.2.13.3. SWOT Analysis
- 11.2.13.4. Recent Developments
- 11.2.13.5. Financials (Based on Availability)
- 11.2.14 Pactiv
- 11.2.14.1. Overview
- 11.2.14.2. Products
- 11.2.14.3. SWOT Analysis
- 11.2.14.4. Recent Developments
- 11.2.14.5. Financials (Based on Availability)
- 11.2.15 GY Packaging
- 11.2.15.1. Overview
- 11.2.15.2. Products
- 11.2.15.3. SWOT Analysis
- 11.2.15.4. Recent Developments
- 11.2.15.5. Financials (Based on Availability)
- 11.2.16 East Coast Packaging
- 11.2.16.1. Overview
- 11.2.16.2. Products
- 11.2.16.3. SWOT Analysis
- 11.2.16.4. Recent Developments
- 11.2.16.5. Financials (Based on Availability)
- 11.2.17 LINPAC Packaging
- 11.2.17.1. Overview
- 11.2.17.2. Products
- 11.2.17.3. SWOT Analysis
- 11.2.17.4. Recent Developments
- 11.2.17.5. Financials (Based on Availability)
- 11.2.18 TEMMA SHIKI
- 11.2.18.1. Overview
- 11.2.18.2. Products
- 11.2.18.3. SWOT Analysis
- 11.2.18.4. Recent Developments
- 11.2.18.5. Financials (Based on Availability)
- 11.2.19 Quinn Packaging
- 11.2.19.1. Overview
- 11.2.19.2. Products
- 11.2.19.3. SWOT Analysis
- 11.2.19.4. Recent Developments
- 11.2.19.5. Financials (Based on Availability)
- 11.2.1 Anchor Packaging Inc. (Hermann Companies
List of Figures
- Figure 1: Global rigid trays packaging Revenue Breakdown (billion, %) by Region 2025 & 2033
- Figure 2: Global rigid trays packaging Volume Breakdown (K, %) by Region 2025 & 2033
- Figure 3: North America rigid trays packaging Revenue (billion), by Application 2025 & 2033
- Figure 4: North America rigid trays packaging Volume (K), by Application 2025 & 2033
- Figure 5: North America rigid trays packaging Revenue Share (%), by Application 2025 & 2033
- Figure 6: North America rigid trays packaging Volume Share (%), by Application 2025 & 2033
- Figure 7: North America rigid trays packaging Revenue (billion), by Types 2025 & 2033
- Figure 8: North America rigid trays packaging Volume (K), by Types 2025 & 2033
- Figure 9: North America rigid trays packaging Revenue Share (%), by Types 2025 & 2033
- Figure 10: North America rigid trays packaging Volume Share (%), by Types 2025 & 2033
- Figure 11: North America rigid trays packaging Revenue (billion), by Country 2025 & 2033
- Figure 12: North America rigid trays packaging Volume (K), by Country 2025 & 2033
- Figure 13: North America rigid trays packaging Revenue Share (%), by Country 2025 & 2033
- Figure 14: North America rigid trays packaging Volume Share (%), by Country 2025 & 2033
- Figure 15: South America rigid trays packaging Revenue (billion), by Application 2025 & 2033
- Figure 16: South America rigid trays packaging Volume (K), by Application 2025 & 2033
- Figure 17: South America rigid trays packaging Revenue Share (%), by Application 2025 & 2033
- Figure 18: South America rigid trays packaging Volume Share (%), by Application 2025 & 2033
- Figure 19: South America rigid trays packaging Revenue (billion), by Types 2025 & 2033
- Figure 20: South America rigid trays packaging Volume (K), by Types 2025 & 2033
- Figure 21: South America rigid trays packaging Revenue Share (%), by Types 2025 & 2033
- Figure 22: South America rigid trays packaging Volume Share (%), by Types 2025 & 2033
- Figure 23: South America rigid trays packaging Revenue (billion), by Country 2025 & 2033
- Figure 24: South America rigid trays packaging Volume (K), by Country 2025 & 2033
- Figure 25: South America rigid trays packaging Revenue Share (%), by Country 2025 & 2033
- Figure 26: South America rigid trays packaging Volume Share (%), by Country 2025 & 2033
- Figure 27: Europe rigid trays packaging Revenue (billion), by Application 2025 & 2033
- Figure 28: Europe rigid trays packaging Volume (K), by Application 2025 & 2033
- Figure 29: Europe rigid trays packaging Revenue Share (%), by Application 2025 & 2033
- Figure 30: Europe rigid trays packaging Volume Share (%), by Application 2025 & 2033
- Figure 31: Europe rigid trays packaging Revenue (billion), by Types 2025 & 2033
- Figure 32: Europe rigid trays packaging Volume (K), by Types 2025 & 2033
- Figure 33: Europe rigid trays packaging Revenue Share (%), by Types 2025 & 2033
- Figure 34: Europe rigid trays packaging Volume Share (%), by Types 2025 & 2033
- Figure 35: Europe rigid trays packaging Revenue (billion), by Country 2025 & 2033
- Figure 36: Europe rigid trays packaging Volume (K), by Country 2025 & 2033
- Figure 37: Europe rigid trays packaging Revenue Share (%), by Country 2025 & 2033
- Figure 38: Europe rigid trays packaging Volume Share (%), by Country 2025 & 2033
- Figure 39: Middle East & Africa rigid trays packaging Revenue (billion), by Application 2025 & 2033
- Figure 40: Middle East & Africa rigid trays packaging Volume (K), by Application 2025 & 2033
- Figure 41: Middle East & Africa rigid trays packaging Revenue Share (%), by Application 2025 & 2033
- Figure 42: Middle East & Africa rigid trays packaging Volume Share (%), by Application 2025 & 2033
- Figure 43: Middle East & Africa rigid trays packaging Revenue (billion), by Types 2025 & 2033
- Figure 44: Middle East & Africa rigid trays packaging Volume (K), by Types 2025 & 2033
- Figure 45: Middle East & Africa rigid trays packaging Revenue Share (%), by Types 2025 & 2033
- Figure 46: Middle East & Africa rigid trays packaging Volume Share (%), by Types 2025 & 2033
- Figure 47: Middle East & Africa rigid trays packaging Revenue (billion), by Country 2025 & 2033
- Figure 48: Middle East & Africa rigid trays packaging Volume (K), by Country 2025 & 2033
- Figure 49: Middle East & Africa rigid trays packaging Revenue Share (%), by Country 2025 & 2033
- Figure 50: Middle East & Africa rigid trays packaging Volume Share (%), by Country 2025 & 2033
- Figure 51: Asia Pacific rigid trays packaging Revenue (billion), by Application 2025 & 2033
- Figure 52: Asia Pacific rigid trays packaging Volume (K), by Application 2025 & 2033
- Figure 53: Asia Pacific rigid trays packaging Revenue Share (%), by Application 2025 & 2033
- Figure 54: Asia Pacific rigid trays packaging Volume Share (%), by Application 2025 & 2033
- Figure 55: Asia Pacific rigid trays packaging Revenue (billion), by Types 2025 & 2033
- Figure 56: Asia Pacific rigid trays packaging Volume (K), by Types 2025 & 2033
- Figure 57: Asia Pacific rigid trays packaging Revenue Share (%), by Types 2025 & 2033
- Figure 58: Asia Pacific rigid trays packaging Volume Share (%), by Types 2025 & 2033
- Figure 59: Asia Pacific rigid trays packaging Revenue (billion), by Country 2025 & 2033
- Figure 60: Asia Pacific rigid trays packaging Volume (K), by Country 2025 & 2033
- Figure 61: Asia Pacific rigid trays packaging Revenue Share (%), by Country 2025 & 2033
- Figure 62: Asia Pacific rigid trays packaging Volume Share (%), by Country 2025 & 2033
List of Tables
- Table 1: Global rigid trays packaging Revenue billion Forecast, by Application 2020 & 2033
- Table 2: Global rigid trays packaging Volume K Forecast, by Application 2020 & 2033
- Table 3: Global rigid trays packaging Revenue billion Forecast, by Types 2020 & 2033
- Table 4: Global rigid trays packaging Volume K Forecast, by Types 2020 & 2033
- Table 5: Global rigid trays packaging Revenue billion Forecast, by Region 2020 & 2033
- Table 6: Global rigid trays packaging Volume K Forecast, by Region 2020 & 2033
- Table 7: Global rigid trays packaging Revenue billion Forecast, by Application 2020 & 2033
- Table 8: Global rigid trays packaging Volume K Forecast, by Application 2020 & 2033
- Table 9: Global rigid trays packaging Revenue billion Forecast, by Types 2020 & 2033
- Table 10: Global rigid trays packaging Volume K Forecast, by Types 2020 & 2033
- Table 11: Global rigid trays packaging Revenue billion Forecast, by Country 2020 & 2033
- Table 12: Global rigid trays packaging Volume K Forecast, by Country 2020 & 2033
- Table 13: United States rigid trays packaging Revenue (billion) Forecast, by Application 2020 & 2033
- Table 14: United States rigid trays packaging Volume (K) Forecast, by Application 2020 & 2033
- Table 15: Canada rigid trays packaging Revenue (billion) Forecast, by Application 2020 & 2033
- Table 16: Canada rigid trays packaging Volume (K) Forecast, by Application 2020 & 2033
- Table 17: Mexico rigid trays packaging Revenue (billion) Forecast, by Application 2020 & 2033
- Table 18: Mexico rigid trays packaging Volume (K) Forecast, by Application 2020 & 2033
- Table 19: Global rigid trays packaging Revenue billion Forecast, by Application 2020 & 2033
- Table 20: Global rigid trays packaging Volume K Forecast, by Application 2020 & 2033
- Table 21: Global rigid trays packaging Revenue billion Forecast, by Types 2020 & 2033
- Table 22: Global rigid trays packaging Volume K Forecast, by Types 2020 & 2033
- Table 23: Global rigid trays packaging Revenue billion Forecast, by Country 2020 & 2033
- Table 24: Global rigid trays packaging Volume K Forecast, by Country 2020 & 2033
- Table 25: Brazil rigid trays packaging Revenue (billion) Forecast, by Application 2020 & 2033
- Table 26: Brazil rigid trays packaging Volume (K) Forecast, by Application 2020 & 2033
- Table 27: Argentina rigid trays packaging Revenue (billion) Forecast, by Application 2020 & 2033
- Table 28: Argentina rigid trays packaging Volume (K) Forecast, by Application 2020 & 2033
- Table 29: Rest of South America rigid trays packaging Revenue (billion) Forecast, by Application 2020 & 2033
- Table 30: Rest of South America rigid trays packaging Volume (K) Forecast, by Application 2020 & 2033
- Table 31: Global rigid trays packaging Revenue billion Forecast, by Application 2020 & 2033
- Table 32: Global rigid trays packaging Volume K Forecast, by Application 2020 & 2033
- Table 33: Global rigid trays packaging Revenue billion Forecast, by Types 2020 & 2033
- Table 34: Global rigid trays packaging Volume K Forecast, by Types 2020 & 2033
- Table 35: Global rigid trays packaging Revenue billion Forecast, by Country 2020 & 2033
- Table 36: Global rigid trays packaging Volume K Forecast, by Country 2020 & 2033
- Table 37: United Kingdom rigid trays packaging Revenue (billion) Forecast, by Application 2020 & 2033
- Table 38: United Kingdom rigid trays packaging Volume (K) Forecast, by Application 2020 & 2033
- Table 39: Germany rigid trays packaging Revenue (billion) Forecast, by Application 2020 & 2033
- Table 40: Germany rigid trays packaging Volume (K) Forecast, by Application 2020 & 2033
- Table 41: France rigid trays packaging Revenue (billion) Forecast, by Application 2020 & 2033
- Table 42: France rigid trays packaging Volume (K) Forecast, by Application 2020 & 2033
- Table 43: Italy rigid trays packaging Revenue (billion) Forecast, by Application 2020 & 2033
- Table 44: Italy rigid trays packaging Volume (K) Forecast, by Application 2020 & 2033
- Table 45: Spain rigid trays packaging Revenue (billion) Forecast, by Application 2020 & 2033
- Table 46: Spain rigid trays packaging Volume (K) Forecast, by Application 2020 & 2033
- Table 47: Russia rigid trays packaging Revenue (billion) Forecast, by Application 2020 & 2033
- Table 48: Russia rigid trays packaging Volume (K) Forecast, by Application 2020 & 2033
- Table 49: Benelux rigid trays packaging Revenue (billion) Forecast, by Application 2020 & 2033
- Table 50: Benelux rigid trays packaging Volume (K) Forecast, by Application 2020 & 2033
- Table 51: Nordics rigid trays packaging Revenue (billion) Forecast, by Application 2020 & 2033
- Table 52: Nordics rigid trays packaging Volume (K) Forecast, by Application 2020 & 2033
- Table 53: Rest of Europe rigid trays packaging Revenue (billion) Forecast, by Application 2020 & 2033
- Table 54: Rest of Europe rigid trays packaging Volume (K) Forecast, by Application 2020 & 2033
- Table 55: Global rigid trays packaging Revenue billion Forecast, by Application 2020 & 2033
- Table 56: Global rigid trays packaging Volume K Forecast, by Application 2020 & 2033
- Table 57: Global rigid trays packaging Revenue billion Forecast, by Types 2020 & 2033
- Table 58: Global rigid trays packaging Volume K Forecast, by Types 2020 & 2033
- Table 59: Global rigid trays packaging Revenue billion Forecast, by Country 2020 & 2033
- Table 60: Global rigid trays packaging Volume K Forecast, by Country 2020 & 2033
- Table 61: Turkey rigid trays packaging Revenue (billion) Forecast, by Application 2020 & 2033
- Table 62: Turkey rigid trays packaging Volume (K) Forecast, by Application 2020 & 2033
- Table 63: Israel rigid trays packaging Revenue (billion) Forecast, by Application 2020 & 2033
- Table 64: Israel rigid trays packaging Volume (K) Forecast, by Application 2020 & 2033
- Table 65: GCC rigid trays packaging Revenue (billion) Forecast, by Application 2020 & 2033
- Table 66: GCC rigid trays packaging Volume (K) Forecast, by Application 2020 & 2033
- Table 67: North Africa rigid trays packaging Revenue (billion) Forecast, by Application 2020 & 2033
- Table 68: North Africa rigid trays packaging Volume (K) Forecast, by Application 2020 & 2033
- Table 69: South Africa rigid trays packaging Revenue (billion) Forecast, by Application 2020 & 2033
- Table 70: South Africa rigid trays packaging Volume (K) Forecast, by Application 2020 & 2033
- Table 71: Rest of Middle East & Africa rigid trays packaging Revenue (billion) Forecast, by Application 2020 & 2033
- Table 72: Rest of Middle East & Africa rigid trays packaging Volume (K) Forecast, by Application 2020 & 2033
- Table 73: Global rigid trays packaging Revenue billion Forecast, by Application 2020 & 2033
- Table 74: Global rigid trays packaging Volume K Forecast, by Application 2020 & 2033
- Table 75: Global rigid trays packaging Revenue billion Forecast, by Types 2020 & 2033
- Table 76: Global rigid trays packaging Volume K Forecast, by Types 2020 & 2033
- Table 77: Global rigid trays packaging Revenue billion Forecast, by Country 2020 & 2033
- Table 78: Global rigid trays packaging Volume K Forecast, by Country 2020 & 2033
- Table 79: China rigid trays packaging Revenue (billion) Forecast, by Application 2020 & 2033
- Table 80: China rigid trays packaging Volume (K) Forecast, by Application 2020 & 2033
- Table 81: India rigid trays packaging Revenue (billion) Forecast, by Application 2020 & 2033
- Table 82: India rigid trays packaging Volume (K) Forecast, by Application 2020 & 2033
- Table 83: Japan rigid trays packaging Revenue (billion) Forecast, by Application 2020 & 2033
- Table 84: Japan rigid trays packaging Volume (K) Forecast, by Application 2020 & 2033
- Table 85: South Korea rigid trays packaging Revenue (billion) Forecast, by Application 2020 & 2033
- Table 86: South Korea rigid trays packaging Volume (K) Forecast, by Application 2020 & 2033
- Table 87: ASEAN rigid trays packaging Revenue (billion) Forecast, by Application 2020 & 2033
- Table 88: ASEAN rigid trays packaging Volume (K) Forecast, by Application 2020 & 2033
- Table 89: Oceania rigid trays packaging Revenue (billion) Forecast, by Application 2020 & 2033
- Table 90: Oceania rigid trays packaging Volume (K) Forecast, by Application 2020 & 2033
- Table 91: Rest of Asia Pacific rigid trays packaging Revenue (billion) Forecast, by Application 2020 & 2033
- Table 92: Rest of Asia Pacific rigid trays packaging Volume (K) Forecast, by Application 2020 & 2033
Frequently Asked Questions
1. What is the projected Compound Annual Growth Rate (CAGR) of the rigid trays packaging?
The projected CAGR is approximately 3.6%.
2. Which companies are prominent players in the rigid trays packaging?
Key companies in the market include Anchor Packaging Inc. (Hermann Companies, Inc.), Bemis (Amcor), RPC Group (Berry Global Group), Dart Container Corp., DS Smith, Genpak LLC, Tekni-Plex Inc., Placon, Winpak Ltd., Sonoco Products, Cambro, Huhtamaki, Pactiv, GY Packaging, East Coast Packaging, LINPAC Packaging, TEMMA SHIKI, Quinn Packaging.
3. What are the main segments of the rigid trays packaging?
The market segments include Application, Types.
4. Can you provide details about the market size?
The market size is estimated to be USD 220.2 billion as of 2022.
5. What are some drivers contributing to market growth?
N/A
6. What are the notable trends driving market growth?
N/A
7. Are there any restraints impacting market growth?
N/A
8. Can you provide examples of recent developments in the market?
N/A
9. What pricing options are available for accessing the report?
Pricing options include single-user, multi-user, and enterprise licenses priced at USD 4350.00, USD 6525.00, and USD 8700.00 respectively.
10. Is the market size provided in terms of value or volume?
The market size is provided in terms of value, measured in billion and volume, measured in K.
11. Are there any specific market keywords associated with the report?
Yes, the market keyword associated with the report is "rigid trays packaging," which aids in identifying and referencing the specific market segment covered.
12. How do I determine which pricing option suits my needs best?
The pricing options vary based on user requirements and access needs. Individual users may opt for single-user licenses, while businesses requiring broader access may choose multi-user or enterprise licenses for cost-effective access to the report.
13. Are there any additional resources or data provided in the rigid trays packaging report?
While the report offers comprehensive insights, it's advisable to review the specific contents or supplementary materials provided to ascertain if additional resources or data are available.
14. How can I stay updated on further developments or reports in the rigid trays packaging?
To stay informed about further developments, trends, and reports in the rigid trays packaging, consider subscribing to industry newsletters, following relevant companies and organizations, or regularly checking reputable industry news sources and publications.
Methodology
Step 1 - Identification of Relevant Samples Size from Population Database


Step 2 - Approaches for Defining Global Market Size (Value, Volume* & Price*)

Note*: In applicable scenarios
Step 3 - Data Sources
Primary Research
- Web Analytics
- Survey Reports
- Research Institute
- Latest Research Reports
- Opinion Leaders
Secondary Research
- Annual Reports
- White Paper
- Latest Press Release
- Industry Association
- Paid Database
- Investor Presentations

Step 4 - Data Triangulation
Involves using different sources of information in order to increase the validity of a study
These sources are likely to be stakeholders in a program - participants, other researchers, program staff, other community members, and so on.
Then we put all data in single framework & apply various statistical tools to find out the dynamic on the market.
During the analysis stage, feedback from the stakeholder groups would be compared to determine areas of agreement as well as areas of divergence