

Key Insights
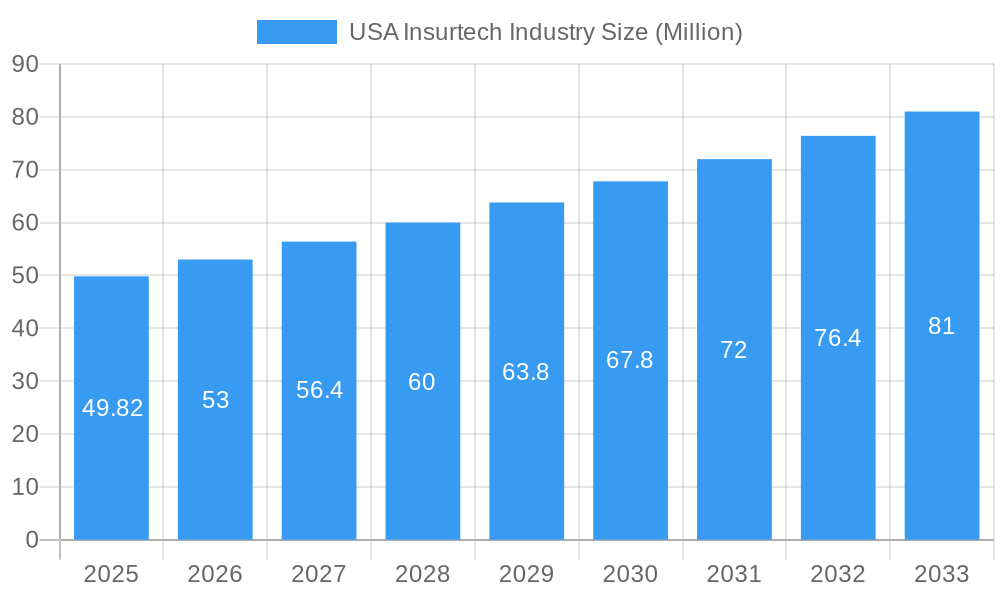
The United States Insurtech market is poised for significant expansion, with an estimated market size of $49.82 million in 2025, projected to grow at a robust CAGR exceeding 6.00% through 2033. This growth trajectory is fueled by a confluence of technological advancements and evolving consumer expectations. Key drivers include the increasing adoption of AI and machine learning for risk assessment and claims processing, the proliferation of mobile-first solutions, and the demand for personalized insurance products. The industry is witnessing a surge in digitally native companies and established insurers investing heavily in innovative platforms to enhance customer experience, streamline operations, and reduce costs. The shift towards proactive risk management and the growing awareness of cyber threats are further catalyzing Insurtech adoption across various insurance types, including life and non-life segments. This dynamic environment is creating new business models, such as those focused on enabling technology and distribution channels, catering to a diverse range of market needs.
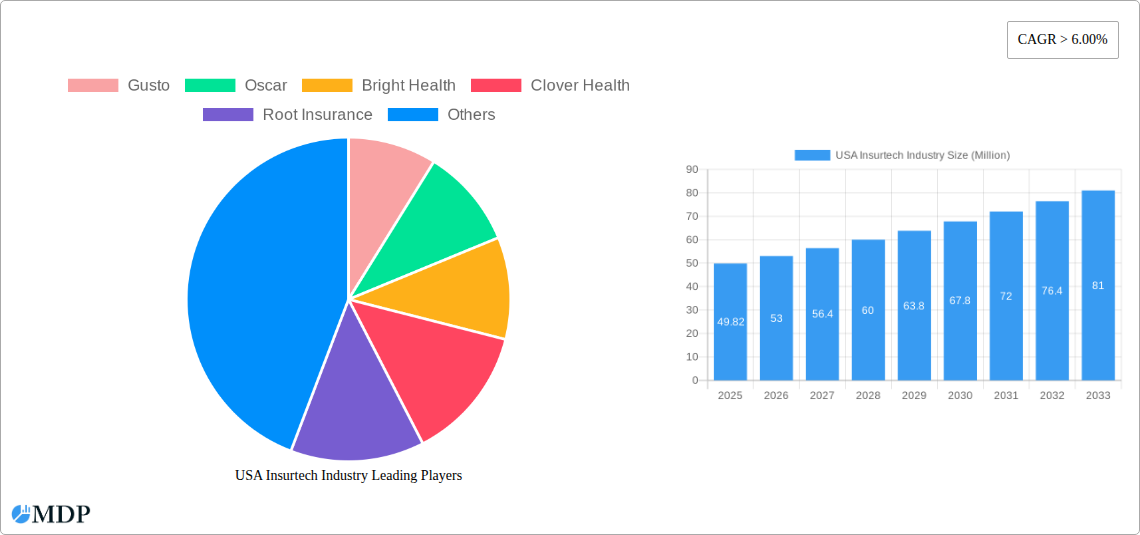
USA Insurtech Industry Market Size (In Million)
The competitive landscape is characterized by a blend of agile startups and legacy players leveraging technology to disrupt traditional insurance models. Companies like Gusto, Oscar, Bright Health, Clover Health, Root Insurance, American Well, Lemonade, Outsystems, Next Insurance, and Metromile are at the forefront, offering innovative solutions that range from on-demand insurance to AI-powered underwriting. While growth is widespread, North America, particularly the United States, represents a dominant and dynamic market within the global Insurtech ecosystem. Emerging trends include the integration of IoT devices for data collection, the rise of parametric insurance, and a greater focus on embedded insurance solutions within other digital ecosystems. However, challenges such as regulatory hurdles, data privacy concerns, and the need for widespread digital literacy among consumers may temper rapid adoption in certain segments. Nonetheless, the overall outlook for the US Insurtech market remains exceptionally strong, driven by a persistent push for efficiency, customer-centricity, and innovative product offerings.
USA Insurtech Industry Company Market Share
USA Insurtech Industry Market Dynamics & Concentration
The USA Insurtech industry is characterized by a dynamic market landscape and evolving concentration. Innovation drivers, such as the demand for personalized customer experiences, increased operational efficiency through AI and machine learning, and the adoption of telematics for usage-based insurance, are profoundly shaping the sector. Regulatory frameworks, while offering a degree of protection, also present complexities that insurtech companies must navigate. The threat of product substitutes, including traditional insurance models that are slowly integrating digital solutions, necessitates continuous innovation. End-user trends reveal a growing preference for digital channels, on-demand policies, and transparent pricing, particularly among younger demographics. Mergers and acquisitions (M&A) are a significant indicator of market concentration, with notable deals such as Duck Creek Technologies' acquisition by Vista Equity Partners in March 2023, indicating consolidation and strategic growth among established players. Encora's acquisition of Excellarate in January 2023 further highlights the trend of enhanced technological capabilities driving M&A activity. The market share distribution remains fragmented, with both established carriers venturing into insurtech and agile startups gaining traction. M&A deal counts are on an upward trajectory, signaling a maturing market where scale and technological integration are paramount for sustained growth and competitive advantage.
USA Insurtech Industry Industry Trends & Analysis
The USA Insurtech industry is poised for significant expansion, driven by a confluence of technological advancements, shifting consumer expectations, and strategic market plays. The market is projected to grow at a robust Compound Annual Growth Rate (CAGR) of approximately 18%, reaching an estimated market size of over $100 billion by 2033. This growth is fueled by several key trends. Firstly, the increasing penetration of digital technologies across all sectors of the economy has created fertile ground for insurtech solutions. Consumers, accustomed to seamless digital experiences in other industries, now demand similar convenience and personalization from their insurance providers. This has led to the rise of direct-to-consumer (D2C) models and the adoption of AI-powered chatbots and virtual assistants for policy inquiries and claims processing.
Secondly, technological disruptions are at the core of this transformation. The integration of Artificial Intelligence (AI) and Machine Learning (ML) is revolutionizing risk assessment, fraud detection, and personalized product offerings. Telematics, powered by IoT devices, is enabling usage-based insurance (UBI) models, particularly in auto insurance, where premiums are tailored to actual driving behavior. Blockchain technology is being explored for its potential to enhance transparency, security, and efficiency in claims handling and contract management. Furthermore, the proliferation of Big Data analytics allows insurtech companies to gain deeper insights into customer behavior and market trends, enabling them to develop more targeted and competitive products.
Consumer preferences are rapidly evolving. There is a growing demand for on-demand insurance, allowing individuals to purchase coverage for specific periods or events. The younger demographic, often referred to as "digital natives," is particularly receptive to these innovative models, prioritizing ease of use, transparency, and value for money. This has pushed traditional insurers to accelerate their digital transformation efforts and partner with insurtech firms to stay competitive. The competitive dynamics are intense, with a blend of well-funded startups, established insurance giants undergoing digital overhauls, and technology providers offering specialized solutions. The market penetration of insurtech is steadily increasing, as more consumers recognize the benefits of digital-first insurance solutions, leading to a paradigm shift in how insurance is bought, sold, and managed.
Leading Markets & Segments in USA Insurtech Industry
The USA Insurtech industry exhibits distinct leadership across various segments, with a notable dominance in Non-Life Insurance and the Enabler business model. Geographically, the United States itself is the primary market, driven by its large consumer base, advanced technological infrastructure, and a culture that embraces digital innovation. Within the Non-Life Insurance segment, Auto, Homeowners, and Commercial Property & Casualty (P&C) insurance are leading the charge. The availability of telematics data for auto insurance allows for sophisticated risk assessment and personalized pricing, driving significant adoption of insurtech solutions in this area. Similarly, the inherent complexity and risk associated with property insurance, coupled with the potential for technological enhancements in claims processing and damage assessment through AI and drone technology, positions it as a fertile ground for insurtech innovation.
The Enabler business model plays a crucial role in the ecosystem. These companies provide the underlying technology, data analytics, AI capabilities, and API integrations that empower both traditional insurers and other insurtech startups to develop and deploy innovative products and services. Their focus on scalable and adaptable platforms makes them indispensable partners in the digital transformation of the insurance industry. Key drivers for the dominance of Enablers include the high cost and complexity of legacy systems within traditional insurers, creating a strong demand for modern, cloud-based solutions. Furthermore, the increasing need for specialized insurtech functionalities, such as advanced fraud detection or personalized customer onboarding, drives the growth of specialized Enabler companies.
In the Distributor segment, digital platforms and online brokers are gaining significant traction, offering consumers simplified comparison and purchase experiences. The Carrier model is also evolving, with established insurers increasingly adopting insurtech principles and launching their own digital-first brands or acquiring innovative startups. However, the agility and customer-centric approach of many Enabler and Distributor models provide them with a competitive edge in capturing market share and driving innovation across the broader insurtech landscape. The interplay between these segments, facilitated by strategic partnerships and M&A activities, is shaping a more efficient, accessible, and customer-focused insurance market in the USA.
USA Insurtech Industry Product Developments
Recent product developments in the USA Insurtech industry are heavily influenced by advancements in AI, machine learning, and data analytics. Companies are innovating in areas like personalized underwriting, offering more accurate risk assessments and tailored policy premiums based on individual data. Predictive analytics is being employed to proactively identify and mitigate potential risks for policyholders. The development of seamless digital customer journeys, from quote generation to claims filing, is a key focus, often utilizing intuitive mobile applications and AI-powered chatbots for instant support. Furthermore, there's a growing trend towards embedded insurance, where coverage is integrated into the purchase of other products or services, making insurance more accessible and convenient.
Key Drivers of USA Insurtech Industry Growth
Several key drivers are propelling the growth of the USA Insurtech industry. Technological Advancements are paramount, with the widespread adoption of AI, machine learning, big data analytics, and IoT devices enabling more efficient underwriting, personalized customer experiences, and innovative product development. Shifting Consumer Preferences are equally crucial; consumers increasingly demand digital-first solutions that offer convenience, transparency, and on-demand access. Regulatory Support for innovation and data utilization, while evolving, is also contributing positively. The increasing volume of Data Availability provides a rich resource for insurtech companies to refine their algorithms and offer more accurate pricing and risk management. Finally, Investment and Funding in the insurtech sector continue to be strong, fueling research, development, and market expansion.
Challenges in the USA Insurtech Industry Market
Despite robust growth, the USA Insurtech industry faces significant challenges. Regulatory Hurdles remain a primary concern, with varying state-by-state regulations and the need to adapt to evolving data privacy laws, such as CCPA, creating complexity. Cybersecurity Threats are a constant risk, as handling vast amounts of sensitive customer data makes insurtech firms attractive targets for cyberattacks. Legacy System Integration for traditional insurers looking to adopt new technologies can be a costly and time-consuming process, hindering rapid digital transformation. Customer Adoption and Trust also present a challenge, as some consumers remain hesitant to fully embrace digital insurance platforms, preferring traditional channels. Finally, Intense Competition from both established players and emerging startups necessitates continuous innovation and efficient operational models to maintain market share.
Emerging Opportunities in USA Insurtech Industry
Emerging opportunities in the USA Insurtech industry are driven by several catalysts. Expansion into New Insurance Verticals presents a significant avenue for growth, moving beyond traditional auto and home to niche markets like pet insurance, cyber insurance, and parametric insurance. Strategic Partnerships between insurtech startups and established insurance carriers are becoming increasingly vital, allowing for the leveraging of distribution networks and technological expertise. The continued development and adoption of AI and IoT technologies will unlock further potential for hyper-personalization, predictive risk management, and efficient claims processing. Furthermore, Embedded Insurance Models, seamlessly integrated into other consumer transactions, offer a powerful channel for reaching new customer segments. The growing demand for ESG (Environmental, Social, and Governance) compliant insurance products also presents a burgeoning opportunity for innovative solutions.
Leading Players in the USA Insurtech Industry Sector
- Gusto
- Oscar
- Bright Health
- Clover Health
- Root Insurance
- American Well
- Lemonade
- Outsystems
- Next Insurance
- Metromile
- Hippo
Key Milestones in USA Insurtech Industry Industry
- March 2023: Duck Creek Technologies, the intelligent solutions provider defining the future of property and casualty (P&C) and general insurance acquired by Vista Equity Partners, a leading global investment firm. This acquisition signifies consolidation and strategic investment in core insurtech infrastructure.
- January 2023: Encora, a global next-gen product engineering provider, acquired Excellarate, a global technology solutions and services company. The acquisition enhances Encora's capabilities in AI, Analytics, and Automation and deepens Encora's industry expertise in HealthTech, FinTech, and InsurTech, signaling a trend towards enhancing advanced technological competencies within the insurtech ecosystem.
Strategic Outlook for USA Insurtech Industry Market
The strategic outlook for the USA Insurtech industry is characterized by continued innovation and market maturation. Growth accelerators will be driven by the deeper integration of AI and machine learning to enhance predictive analytics and personalize customer experiences further. Strategic partnerships between insurtech startups and traditional insurers will continue to be crucial for leveraging established distribution channels and building trust. The expansion of embedded insurance, offering seamless integration of coverage into everyday transactions, will unlock significant market potential. Furthermore, a focus on sustainability and ESG-compliant insurance products is poised to become a major growth area, aligning with evolving consumer and regulatory expectations. The industry is expected to witness further consolidation and specialization, with companies focusing on niche markets and advanced technological solutions to maintain a competitive edge.
USA Insurtech Industry Segmentation
-
1. Business Model
- 1.1. Carrier
- 1.2. Enabler
- 1.3. Distributor
-
2. Insurance Type
- 2.1. Life Insurance
- 2.2. Non-Life Insurance
USA Insurtech Industry Segmentation By Geography
-
1. North America
- 1.1. United States
- 1.2. Canada
- 1.3. Mexico
-
2. South America
- 2.1. Brazil
- 2.2. Argentina
- 2.3. Rest of South America
-
3. Europe
- 3.1. United Kingdom
- 3.2. Germany
- 3.3. France
- 3.4. Italy
- 3.5. Spain
- 3.6. Russia
- 3.7. Benelux
- 3.8. Nordics
- 3.9. Rest of Europe
-
4. Middle East & Africa
- 4.1. Turkey
- 4.2. Israel
- 4.3. GCC
- 4.4. North Africa
- 4.5. South Africa
- 4.6. Rest of Middle East & Africa
-
5. Asia Pacific
- 5.1. China
- 5.2. India
- 5.3. Japan
- 5.4. South Korea
- 5.5. ASEAN
- 5.6. Oceania
- 5.7. Rest of Asia Pacific
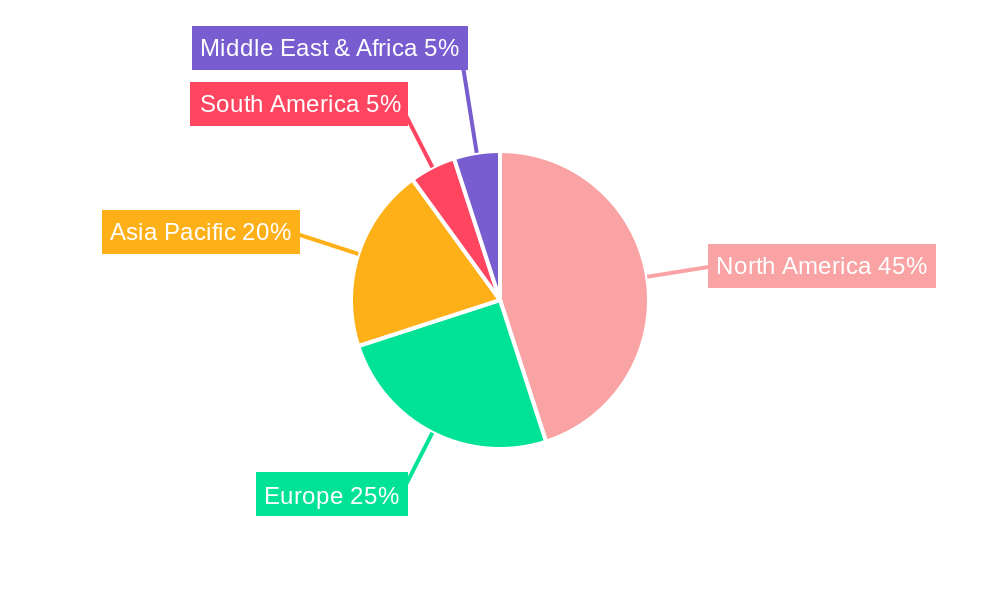
USA Insurtech Industry Regional Market Share
Geographic Coverage of USA Insurtech Industry
USA Insurtech Industry REPORT HIGHLIGHTS
| Aspects | Details |
|---|---|
| Study Period | 2020-2034 |
| Base Year | 2025 |
| Estimated Year | 2026 |
| Forecast Period | 2026-2034 |
| Historical Period | 2020-2025 |
| Growth Rate | CAGR of > 6.00% from 2020-2034 |
| Segmentation |
|
Table of Contents
- 1. Introduction
- 1.1. Research Scope
- 1.2. Market Segmentation
- 1.3. Research Objective
- 1.4. Definitions and Assumptions
- 2. Executive Summary
- 2.1. Market Snapshot
- 3. Market Dynamics
- 3.1. Market Drivers
- 3.2. Market Restrains
- 3.3. Market Trends
- 3.4. Market Opportunities
- 4. Market Factor Analysis
- 4.1. Porters Five Forces
- 4.1.1. Bargaining Power of Suppliers
- 4.1.2. Bargaining Power of Buyers
- 4.1.3. Threat of New Entrants
- 4.1.4. Threat of Substitutes
- 4.1.5. Competitive Rivalry
- 4.2. PESTEL analysis
- 4.3. BCG Analysis
- 4.3.1. Stars (High Growth, High Market Share)
- 4.3.2. Cash Cows (Low Growth, High Market Share)
- 4.3.3. Question Mark (High Growth, Low Market Share)
- 4.3.4. Dogs (Low Growth, Low Market Share)
- 4.4. Ansoff Matrix Analysis
- 4.5. Supply Chain Analysis
- 4.6. Regulatory Landscape
- 4.7. Current Market Potential and Opportunity Assessment (TAM–SAM–SOM Framework)
- 4.8. MDP Analyst Note
- 4.1. Porters Five Forces
- 5. Market Analysis, Insights and Forecast 2021-2033
- 5.1. Market Analysis, Insights and Forecast - by Business Model
- 5.1.1. Carrier
- 5.1.2. Enabler
- 5.1.3. Distributor
- 5.2. Market Analysis, Insights and Forecast - by Insurance Type
- 5.2.1. Life Insurance
- 5.2.2. Non-Life Insurance
- 5.3. Market Analysis, Insights and Forecast - by Region
- 5.3.1. North America
- 5.3.2. South America
- 5.3.3. Europe
- 5.3.4. Middle East & Africa
- 5.3.5. Asia Pacific
- 5.1. Market Analysis, Insights and Forecast - by Business Model
- 6. Global USA Insurtech Industry Analysis, Insights and Forecast, 2021-2033
- 6.1. Market Analysis, Insights and Forecast - by Business Model
- 6.1.1. Carrier
- 6.1.2. Enabler
- 6.1.3. Distributor
- 6.2. Market Analysis, Insights and Forecast - by Insurance Type
- 6.2.1. Life Insurance
- 6.2.2. Non-Life Insurance
- 6.1. Market Analysis, Insights and Forecast - by Business Model
- 7. North America USA Insurtech Industry Analysis, Insights and Forecast, 2020-2032
- 7.1. Market Analysis, Insights and Forecast - by Business Model
- 7.1.1. Carrier
- 7.1.2. Enabler
- 7.1.3. Distributor
- 7.2. Market Analysis, Insights and Forecast - by Insurance Type
- 7.2.1. Life Insurance
- 7.2.2. Non-Life Insurance
- 7.1. Market Analysis, Insights and Forecast - by Business Model
- 8. South America USA Insurtech Industry Analysis, Insights and Forecast, 2020-2032
- 8.1. Market Analysis, Insights and Forecast - by Business Model
- 8.1.1. Carrier
- 8.1.2. Enabler
- 8.1.3. Distributor
- 8.2. Market Analysis, Insights and Forecast - by Insurance Type
- 8.2.1. Life Insurance
- 8.2.2. Non-Life Insurance
- 8.1. Market Analysis, Insights and Forecast - by Business Model
- 9. Europe USA Insurtech Industry Analysis, Insights and Forecast, 2020-2032
- 9.1. Market Analysis, Insights and Forecast - by Business Model
- 9.1.1. Carrier
- 9.1.2. Enabler
- 9.1.3. Distributor
- 9.2. Market Analysis, Insights and Forecast - by Insurance Type
- 9.2.1. Life Insurance
- 9.2.2. Non-Life Insurance
- 9.1. Market Analysis, Insights and Forecast - by Business Model
- 10. Middle East & Africa USA Insurtech Industry Analysis, Insights and Forecast, 2020-2032
- 10.1. Market Analysis, Insights and Forecast - by Business Model
- 10.1.1. Carrier
- 10.1.2. Enabler
- 10.1.3. Distributor
- 10.2. Market Analysis, Insights and Forecast - by Insurance Type
- 10.2.1. Life Insurance
- 10.2.2. Non-Life Insurance
- 10.1. Market Analysis, Insights and Forecast - by Business Model
- 11. Asia Pacific USA Insurtech Industry Analysis, Insights and Forecast, 2020-2032
- 11.1. Market Analysis, Insights and Forecast - by Business Model
- 11.1.1. Carrier
- 11.1.2. Enabler
- 11.1.3. Distributor
- 11.2. Market Analysis, Insights and Forecast - by Insurance Type
- 11.2.1. Life Insurance
- 11.2.2. Non-Life Insurance
- 11.1. Market Analysis, Insights and Forecast - by Business Model
- 12. Competitive Analysis
- 12.1. Company Profiles
- 12.1.1 Gusto
- 12.1.1.1. Company Overview
- 12.1.1.2. Products
- 12.1.1.3. Company Financials
- 12.1.1.4. SWOT Analysis
- 12.1.2 Oscar
- 12.1.2.1. Company Overview
- 12.1.2.2. Products
- 12.1.2.3. Company Financials
- 12.1.2.4. SWOT Analysis
- 12.1.3 Bright Health
- 12.1.3.1. Company Overview
- 12.1.3.2. Products
- 12.1.3.3. Company Financials
- 12.1.3.4. SWOT Analysis
- 12.1.4 Clover Health
- 12.1.4.1. Company Overview
- 12.1.4.2. Products
- 12.1.4.3. Company Financials
- 12.1.4.4. SWOT Analysis
- 12.1.5 Root Insurance
- 12.1.5.1. Company Overview
- 12.1.5.2. Products
- 12.1.5.3. Company Financials
- 12.1.5.4. SWOT Analysis
- 12.1.6 American Well
- 12.1.6.1. Company Overview
- 12.1.6.2. Products
- 12.1.6.3. Company Financials
- 12.1.6.4. SWOT Analysis
- 12.1.7 Lemonade
- 12.1.7.1. Company Overview
- 12.1.7.2. Products
- 12.1.7.3. Company Financials
- 12.1.7.4. SWOT Analysis
- 12.1.8 Outsystems
- 12.1.8.1. Company Overview
- 12.1.8.2. Products
- 12.1.8.3. Company Financials
- 12.1.8.4. SWOT Analysis
- 12.1.9 Next Insurance
- 12.1.9.1. Company Overview
- 12.1.9.2. Products
- 12.1.9.3. Company Financials
- 12.1.9.4. SWOT Analysis
- 12.1.10 Metromile
- 12.1.10.1. Company Overview
- 12.1.10.2. Products
- 12.1.10.3. Company Financials
- 12.1.10.4. SWOT Analysis
- 12.1.11 Hippo**List Not Exhaustive
- 12.1.11.1. Company Overview
- 12.1.11.2. Products
- 12.1.11.3. Company Financials
- 12.1.11.4. SWOT Analysis
- 12.1.1 Gusto
- 12.2. Market Entropy
- 12.2.1 Company's Key Areas Served
- 12.2.2 Recent Developments
- 12.3. Company Market Share Analysis 2025
- 12.3.1 Top 5 Companies Market Share Analysis
- 12.3.2 Top 3 Companies Market Share Analysis
- 12.4. List of Potential Customers
- 13. Research Methodology
List of Figures
- Figure 1: Global USA Insurtech Industry Revenue Breakdown (Million, %) by Region 2025 & 2033
- Figure 2: Global USA Insurtech Industry Volume Breakdown (Billion, %) by Region 2025 & 2033
- Figure 3: North America USA Insurtech Industry Revenue (Million), by Business Model 2025 & 2033
- Figure 4: North America USA Insurtech Industry Volume (Billion), by Business Model 2025 & 2033
- Figure 5: North America USA Insurtech Industry Revenue Share (%), by Business Model 2025 & 2033
- Figure 6: North America USA Insurtech Industry Volume Share (%), by Business Model 2025 & 2033
- Figure 7: North America USA Insurtech Industry Revenue (Million), by Insurance Type 2025 & 2033
- Figure 8: North America USA Insurtech Industry Volume (Billion), by Insurance Type 2025 & 2033
- Figure 9: North America USA Insurtech Industry Revenue Share (%), by Insurance Type 2025 & 2033
- Figure 10: North America USA Insurtech Industry Volume Share (%), by Insurance Type 2025 & 2033
- Figure 11: North America USA Insurtech Industry Revenue (Million), by Country 2025 & 2033
- Figure 12: North America USA Insurtech Industry Volume (Billion), by Country 2025 & 2033
- Figure 13: North America USA Insurtech Industry Revenue Share (%), by Country 2025 & 2033
- Figure 14: North America USA Insurtech Industry Volume Share (%), by Country 2025 & 2033
- Figure 15: South America USA Insurtech Industry Revenue (Million), by Business Model 2025 & 2033
- Figure 16: South America USA Insurtech Industry Volume (Billion), by Business Model 2025 & 2033
- Figure 17: South America USA Insurtech Industry Revenue Share (%), by Business Model 2025 & 2033
- Figure 18: South America USA Insurtech Industry Volume Share (%), by Business Model 2025 & 2033
- Figure 19: South America USA Insurtech Industry Revenue (Million), by Insurance Type 2025 & 2033
- Figure 20: South America USA Insurtech Industry Volume (Billion), by Insurance Type 2025 & 2033
- Figure 21: South America USA Insurtech Industry Revenue Share (%), by Insurance Type 2025 & 2033
- Figure 22: South America USA Insurtech Industry Volume Share (%), by Insurance Type 2025 & 2033
- Figure 23: South America USA Insurtech Industry Revenue (Million), by Country 2025 & 2033
- Figure 24: South America USA Insurtech Industry Volume (Billion), by Country 2025 & 2033
- Figure 25: South America USA Insurtech Industry Revenue Share (%), by Country 2025 & 2033
- Figure 26: South America USA Insurtech Industry Volume Share (%), by Country 2025 & 2033
- Figure 27: Europe USA Insurtech Industry Revenue (Million), by Business Model 2025 & 2033
- Figure 28: Europe USA Insurtech Industry Volume (Billion), by Business Model 2025 & 2033
- Figure 29: Europe USA Insurtech Industry Revenue Share (%), by Business Model 2025 & 2033
- Figure 30: Europe USA Insurtech Industry Volume Share (%), by Business Model 2025 & 2033
- Figure 31: Europe USA Insurtech Industry Revenue (Million), by Insurance Type 2025 & 2033
- Figure 32: Europe USA Insurtech Industry Volume (Billion), by Insurance Type 2025 & 2033
- Figure 33: Europe USA Insurtech Industry Revenue Share (%), by Insurance Type 2025 & 2033
- Figure 34: Europe USA Insurtech Industry Volume Share (%), by Insurance Type 2025 & 2033
- Figure 35: Europe USA Insurtech Industry Revenue (Million), by Country 2025 & 2033
- Figure 36: Europe USA Insurtech Industry Volume (Billion), by Country 2025 & 2033
- Figure 37: Europe USA Insurtech Industry Revenue Share (%), by Country 2025 & 2033
- Figure 38: Europe USA Insurtech Industry Volume Share (%), by Country 2025 & 2033
- Figure 39: Middle East & Africa USA Insurtech Industry Revenue (Million), by Business Model 2025 & 2033
- Figure 40: Middle East & Africa USA Insurtech Industry Volume (Billion), by Business Model 2025 & 2033
- Figure 41: Middle East & Africa USA Insurtech Industry Revenue Share (%), by Business Model 2025 & 2033
- Figure 42: Middle East & Africa USA Insurtech Industry Volume Share (%), by Business Model 2025 & 2033
- Figure 43: Middle East & Africa USA Insurtech Industry Revenue (Million), by Insurance Type 2025 & 2033
- Figure 44: Middle East & Africa USA Insurtech Industry Volume (Billion), by Insurance Type 2025 & 2033
- Figure 45: Middle East & Africa USA Insurtech Industry Revenue Share (%), by Insurance Type 2025 & 2033
- Figure 46: Middle East & Africa USA Insurtech Industry Volume Share (%), by Insurance Type 2025 & 2033
- Figure 47: Middle East & Africa USA Insurtech Industry Revenue (Million), by Country 2025 & 2033
- Figure 48: Middle East & Africa USA Insurtech Industry Volume (Billion), by Country 2025 & 2033
- Figure 49: Middle East & Africa USA Insurtech Industry Revenue Share (%), by Country 2025 & 2033
- Figure 50: Middle East & Africa USA Insurtech Industry Volume Share (%), by Country 2025 & 2033
- Figure 51: Asia Pacific USA Insurtech Industry Revenue (Million), by Business Model 2025 & 2033
- Figure 52: Asia Pacific USA Insurtech Industry Volume (Billion), by Business Model 2025 & 2033
- Figure 53: Asia Pacific USA Insurtech Industry Revenue Share (%), by Business Model 2025 & 2033
- Figure 54: Asia Pacific USA Insurtech Industry Volume Share (%), by Business Model 2025 & 2033
- Figure 55: Asia Pacific USA Insurtech Industry Revenue (Million), by Insurance Type 2025 & 2033
- Figure 56: Asia Pacific USA Insurtech Industry Volume (Billion), by Insurance Type 2025 & 2033
- Figure 57: Asia Pacific USA Insurtech Industry Revenue Share (%), by Insurance Type 2025 & 2033
- Figure 58: Asia Pacific USA Insurtech Industry Volume Share (%), by Insurance Type 2025 & 2033
- Figure 59: Asia Pacific USA Insurtech Industry Revenue (Million), by Country 2025 & 2033
- Figure 60: Asia Pacific USA Insurtech Industry Volume (Billion), by Country 2025 & 2033
- Figure 61: Asia Pacific USA Insurtech Industry Revenue Share (%), by Country 2025 & 2033
- Figure 62: Asia Pacific USA Insurtech Industry Volume Share (%), by Country 2025 & 2033
List of Tables
- Table 1: Global USA Insurtech Industry Revenue Million Forecast, by Business Model 2020 & 2033
- Table 2: Global USA Insurtech Industry Volume Billion Forecast, by Business Model 2020 & 2033
- Table 3: Global USA Insurtech Industry Revenue Million Forecast, by Insurance Type 2020 & 2033
- Table 4: Global USA Insurtech Industry Volume Billion Forecast, by Insurance Type 2020 & 2033
- Table 5: Global USA Insurtech Industry Revenue Million Forecast, by Region 2020 & 2033
- Table 6: Global USA Insurtech Industry Volume Billion Forecast, by Region 2020 & 2033
- Table 7: Global USA Insurtech Industry Revenue Million Forecast, by Business Model 2020 & 2033
- Table 8: Global USA Insurtech Industry Volume Billion Forecast, by Business Model 2020 & 2033
- Table 9: Global USA Insurtech Industry Revenue Million Forecast, by Insurance Type 2020 & 2033
- Table 10: Global USA Insurtech Industry Volume Billion Forecast, by Insurance Type 2020 & 2033
- Table 11: Global USA Insurtech Industry Revenue Million Forecast, by Country 2020 & 2033
- Table 12: Global USA Insurtech Industry Volume Billion Forecast, by Country 2020 & 2033
- Table 13: United States USA Insurtech Industry Revenue (Million) Forecast, by Application 2020 & 2033
- Table 14: United States USA Insurtech Industry Volume (Billion) Forecast, by Application 2020 & 2033
- Table 15: Canada USA Insurtech Industry Revenue (Million) Forecast, by Application 2020 & 2033
- Table 16: Canada USA Insurtech Industry Volume (Billion) Forecast, by Application 2020 & 2033
- Table 17: Mexico USA Insurtech Industry Revenue (Million) Forecast, by Application 2020 & 2033
- Table 18: Mexico USA Insurtech Industry Volume (Billion) Forecast, by Application 2020 & 2033
- Table 19: Global USA Insurtech Industry Revenue Million Forecast, by Business Model 2020 & 2033
- Table 20: Global USA Insurtech Industry Volume Billion Forecast, by Business Model 2020 & 2033
- Table 21: Global USA Insurtech Industry Revenue Million Forecast, by Insurance Type 2020 & 2033
- Table 22: Global USA Insurtech Industry Volume Billion Forecast, by Insurance Type 2020 & 2033
- Table 23: Global USA Insurtech Industry Revenue Million Forecast, by Country 2020 & 2033
- Table 24: Global USA Insurtech Industry Volume Billion Forecast, by Country 2020 & 2033
- Table 25: Brazil USA Insurtech Industry Revenue (Million) Forecast, by Application 2020 & 2033
- Table 26: Brazil USA Insurtech Industry Volume (Billion) Forecast, by Application 2020 & 2033
- Table 27: Argentina USA Insurtech Industry Revenue (Million) Forecast, by Application 2020 & 2033
- Table 28: Argentina USA Insurtech Industry Volume (Billion) Forecast, by Application 2020 & 2033
- Table 29: Rest of South America USA Insurtech Industry Revenue (Million) Forecast, by Application 2020 & 2033
- Table 30: Rest of South America USA Insurtech Industry Volume (Billion) Forecast, by Application 2020 & 2033
- Table 31: Global USA Insurtech Industry Revenue Million Forecast, by Business Model 2020 & 2033
- Table 32: Global USA Insurtech Industry Volume Billion Forecast, by Business Model 2020 & 2033
- Table 33: Global USA Insurtech Industry Revenue Million Forecast, by Insurance Type 2020 & 2033
- Table 34: Global USA Insurtech Industry Volume Billion Forecast, by Insurance Type 2020 & 2033
- Table 35: Global USA Insurtech Industry Revenue Million Forecast, by Country 2020 & 2033
- Table 36: Global USA Insurtech Industry Volume Billion Forecast, by Country 2020 & 2033
- Table 37: United Kingdom USA Insurtech Industry Revenue (Million) Forecast, by Application 2020 & 2033
- Table 38: United Kingdom USA Insurtech Industry Volume (Billion) Forecast, by Application 2020 & 2033
- Table 39: Germany USA Insurtech Industry Revenue (Million) Forecast, by Application 2020 & 2033
- Table 40: Germany USA Insurtech Industry Volume (Billion) Forecast, by Application 2020 & 2033
- Table 41: France USA Insurtech Industry Revenue (Million) Forecast, by Application 2020 & 2033
- Table 42: France USA Insurtech Industry Volume (Billion) Forecast, by Application 2020 & 2033
- Table 43: Italy USA Insurtech Industry Revenue (Million) Forecast, by Application 2020 & 2033
- Table 44: Italy USA Insurtech Industry Volume (Billion) Forecast, by Application 2020 & 2033
- Table 45: Spain USA Insurtech Industry Revenue (Million) Forecast, by Application 2020 & 2033
- Table 46: Spain USA Insurtech Industry Volume (Billion) Forecast, by Application 2020 & 2033
- Table 47: Russia USA Insurtech Industry Revenue (Million) Forecast, by Application 2020 & 2033
- Table 48: Russia USA Insurtech Industry Volume (Billion) Forecast, by Application 2020 & 2033
- Table 49: Benelux USA Insurtech Industry Revenue (Million) Forecast, by Application 2020 & 2033
- Table 50: Benelux USA Insurtech Industry Volume (Billion) Forecast, by Application 2020 & 2033
- Table 51: Nordics USA Insurtech Industry Revenue (Million) Forecast, by Application 2020 & 2033
- Table 52: Nordics USA Insurtech Industry Volume (Billion) Forecast, by Application 2020 & 2033
- Table 53: Rest of Europe USA Insurtech Industry Revenue (Million) Forecast, by Application 2020 & 2033
- Table 54: Rest of Europe USA Insurtech Industry Volume (Billion) Forecast, by Application 2020 & 2033
- Table 55: Global USA Insurtech Industry Revenue Million Forecast, by Business Model 2020 & 2033
- Table 56: Global USA Insurtech Industry Volume Billion Forecast, by Business Model 2020 & 2033
- Table 57: Global USA Insurtech Industry Revenue Million Forecast, by Insurance Type 2020 & 2033
- Table 58: Global USA Insurtech Industry Volume Billion Forecast, by Insurance Type 2020 & 2033
- Table 59: Global USA Insurtech Industry Revenue Million Forecast, by Country 2020 & 2033
- Table 60: Global USA Insurtech Industry Volume Billion Forecast, by Country 2020 & 2033
- Table 61: Turkey USA Insurtech Industry Revenue (Million) Forecast, by Application 2020 & 2033
- Table 62: Turkey USA Insurtech Industry Volume (Billion) Forecast, by Application 2020 & 2033
- Table 63: Israel USA Insurtech Industry Revenue (Million) Forecast, by Application 2020 & 2033
- Table 64: Israel USA Insurtech Industry Volume (Billion) Forecast, by Application 2020 & 2033
- Table 65: GCC USA Insurtech Industry Revenue (Million) Forecast, by Application 2020 & 2033
- Table 66: GCC USA Insurtech Industry Volume (Billion) Forecast, by Application 2020 & 2033
- Table 67: North Africa USA Insurtech Industry Revenue (Million) Forecast, by Application 2020 & 2033
- Table 68: North Africa USA Insurtech Industry Volume (Billion) Forecast, by Application 2020 & 2033
- Table 69: South Africa USA Insurtech Industry Revenue (Million) Forecast, by Application 2020 & 2033
- Table 70: South Africa USA Insurtech Industry Volume (Billion) Forecast, by Application 2020 & 2033
- Table 71: Rest of Middle East & Africa USA Insurtech Industry Revenue (Million) Forecast, by Application 2020 & 2033
- Table 72: Rest of Middle East & Africa USA Insurtech Industry Volume (Billion) Forecast, by Application 2020 & 2033
- Table 73: Global USA Insurtech Industry Revenue Million Forecast, by Business Model 2020 & 2033
- Table 74: Global USA Insurtech Industry Volume Billion Forecast, by Business Model 2020 & 2033
- Table 75: Global USA Insurtech Industry Revenue Million Forecast, by Insurance Type 2020 & 2033
- Table 76: Global USA Insurtech Industry Volume Billion Forecast, by Insurance Type 2020 & 2033
- Table 77: Global USA Insurtech Industry Revenue Million Forecast, by Country 2020 & 2033
- Table 78: Global USA Insurtech Industry Volume Billion Forecast, by Country 2020 & 2033
- Table 79: China USA Insurtech Industry Revenue (Million) Forecast, by Application 2020 & 2033
- Table 80: China USA Insurtech Industry Volume (Billion) Forecast, by Application 2020 & 2033
- Table 81: India USA Insurtech Industry Revenue (Million) Forecast, by Application 2020 & 2033
- Table 82: India USA Insurtech Industry Volume (Billion) Forecast, by Application 2020 & 2033
- Table 83: Japan USA Insurtech Industry Revenue (Million) Forecast, by Application 2020 & 2033
- Table 84: Japan USA Insurtech Industry Volume (Billion) Forecast, by Application 2020 & 2033
- Table 85: South Korea USA Insurtech Industry Revenue (Million) Forecast, by Application 2020 & 2033
- Table 86: South Korea USA Insurtech Industry Volume (Billion) Forecast, by Application 2020 & 2033
- Table 87: ASEAN USA Insurtech Industry Revenue (Million) Forecast, by Application 2020 & 2033
- Table 88: ASEAN USA Insurtech Industry Volume (Billion) Forecast, by Application 2020 & 2033
- Table 89: Oceania USA Insurtech Industry Revenue (Million) Forecast, by Application 2020 & 2033
- Table 90: Oceania USA Insurtech Industry Volume (Billion) Forecast, by Application 2020 & 2033
- Table 91: Rest of Asia Pacific USA Insurtech Industry Revenue (Million) Forecast, by Application 2020 & 2033
- Table 92: Rest of Asia Pacific USA Insurtech Industry Volume (Billion) Forecast, by Application 2020 & 2033
Frequently Asked Questions
1. What is the projected Compound Annual Growth Rate (CAGR) of the USA Insurtech Industry?
The projected CAGR is approximately > 6.00%.
2. Which companies are prominent players in the USA Insurtech Industry?
Key companies in the market include Gusto, Oscar, Bright Health, Clover Health, Root Insurance, American Well, Lemonade, Outsystems, Next Insurance, Metromile, Hippo**List Not Exhaustive.
3. What are the main segments of the USA Insurtech Industry?
The market segments include Business Model, Insurance Type.
4. Can you provide details about the market size?
The market size is estimated to be USD 49.82 Million as of 2022.
5. What are some drivers contributing to market growth?
Growing Demand for Data Analytics and Artificial Intelligence; Increasing Adoption of Digital Technologies.
6. What are the notable trends driving market growth?
Surged Funding towards Insurtech Companies.
7. Are there any restraints impacting market growth?
Growing Demand for Data Analytics and Artificial Intelligence; Increasing Adoption of Digital Technologies.
8. Can you provide examples of recent developments in the market?
March 2023: Duck Creek Technologies, the intelligent solutions provider defining the future of property and casualty (P&C) and general insurance acquired by Vista Equity Partners, a leading global investment firm.
9. What pricing options are available for accessing the report?
Pricing options include single-user, multi-user, and enterprise licenses priced at USD 3800, USD 4500, and USD 5800 respectively.
10. Is the market size provided in terms of value or volume?
The market size is provided in terms of value, measured in Million and volume, measured in Billion.
11. Are there any specific market keywords associated with the report?
Yes, the market keyword associated with the report is "USA Insurtech Industry," which aids in identifying and referencing the specific market segment covered.
12. How do I determine which pricing option suits my needs best?
The pricing options vary based on user requirements and access needs. Individual users may opt for single-user licenses, while businesses requiring broader access may choose multi-user or enterprise licenses for cost-effective access to the report.
13. Are there any additional resources or data provided in the USA Insurtech Industry report?
While the report offers comprehensive insights, it's advisable to review the specific contents or supplementary materials provided to ascertain if additional resources or data are available.
14. How can I stay updated on further developments or reports in the USA Insurtech Industry?
To stay informed about further developments, trends, and reports in the USA Insurtech Industry, consider subscribing to industry newsletters, following relevant companies and organizations, or regularly checking reputable industry news sources and publications.
Methodology
Step 1 - Identification of Relevant Samples Size from Population Database


Step 2 - Approaches for Defining Global Market Size (Value, Volume* & Price*)

Note*: In applicable scenarios
Step 3 - Data Sources
Primary Research
- Web Analytics
- Survey Reports
- Research Institute
- Latest Research Reports
- Opinion Leaders
Secondary Research
- Annual Reports
- White Paper
- Latest Press Release
- Industry Association
- Paid Database
- Investor Presentations

Step 4 - Data Triangulation
Involves using different sources of information in order to increase the validity of a study
These sources are likely to be stakeholders in a program - participants, other researchers, program staff, other community members, and so on.
Then we put all data in single framework & apply various statistical tools to find out the dynamic on the market.
During the analysis stage, feedback from the stakeholder groups would be compared to determine areas of agreement as well as areas of divergence