

Key Insights
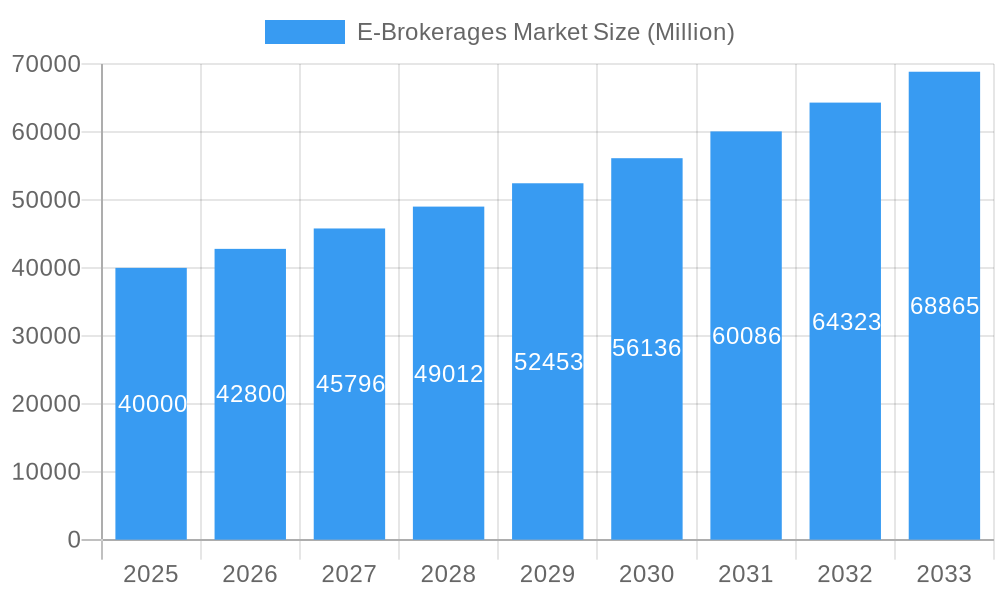
The E-Brokerages Market is poised for significant expansion, projected to reach a substantial market size of approximately $40 billion by the end of the base year 2025. This growth is fueled by a robust Compound Annual Growth Rate (CAGR) exceeding 6.50% throughout the forecast period of 2025-2033. The market's dynamism is driven by a confluence of factors, most notably the increasing digitization of financial services and the rising adoption of online trading platforms by both retail and institutional investors. Furthermore, the proliferation of accessible and user-friendly trading applications, coupled with enhanced market transparency and a growing understanding of investment opportunities, are actively attracting a wider demographic to the e-brokerage landscape. The increasing availability of sophisticated trading tools and analytical resources is also playing a pivotal role in empowering investors, leading to greater engagement and sustained market activity.
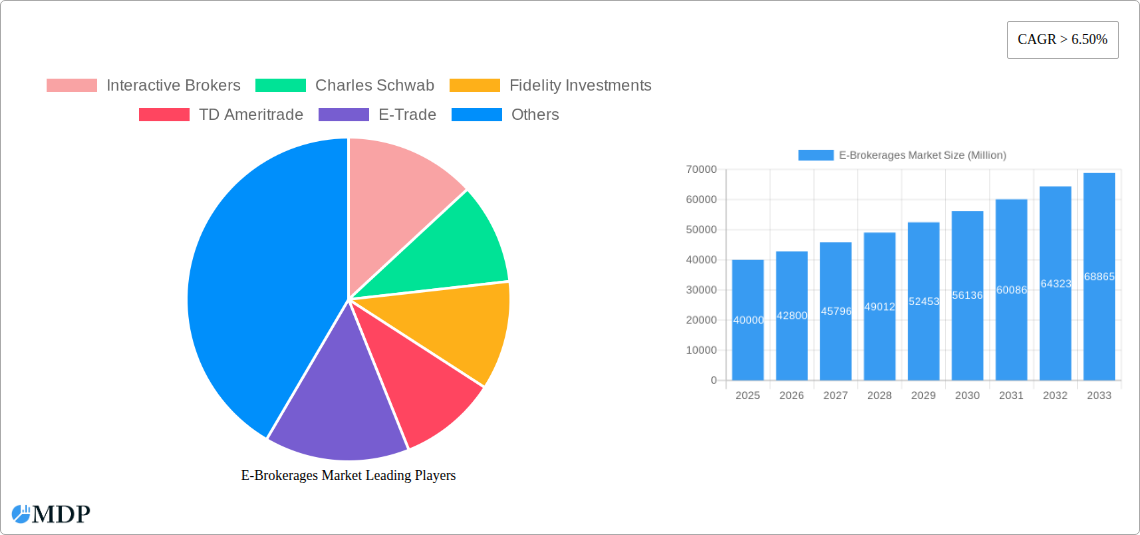
E-Brokerages Market Market Size (In Billion)
Several key trends are shaping the evolution of the e-brokerages market. The advent of commission-free trading models has democratized access to financial markets, significantly lowering the barrier to entry for new investors. This has been a major catalyst for growth, particularly among younger, tech-savvy demographics. The ongoing development and integration of Artificial Intelligence (AI) and Machine Learning (ML) are enhancing personalized investment advice, algorithmic trading capabilities, and fraud detection, thereby improving the overall trading experience and operational efficiency for brokerage firms. Moreover, the increasing demand for diverse investment instruments, including cryptocurrencies and exchange-traded funds (ETFs), is compelling e-brokerages to expand their product offerings. While the market is experiencing robust growth, certain restraints such as evolving regulatory landscapes, cybersecurity threats, and the need for continuous technological innovation to stay competitive, will require strategic navigation by market players to ensure sustained success and investor confidence.
E-Brokerages Market Company Market Share
E-Brokerages Market: Comprehensive Analysis and Growth Forecast (2019-2033)
Uncover the dynamic forces shaping the global E-Brokerages Market, a rapidly evolving sector driven by digital transformation and shifting investor behaviors. This in-depth report, spanning from 2019 to a forecast period extending to 2033, provides critical insights into market dynamics, industry trends, leading players, and future opportunities for stakeholders. With a base year of 2025 and detailed analysis for the historical period 2019-2024, this report is an indispensable resource for understanding market concentration, innovation drivers, regulatory impacts, and emerging growth avenues. Gain actionable intelligence on market share, CAGR, penetration rates, and key strategic moves by industry titans like Interactive Brokers, Charles Schwab, and Fidelity Investments.
E-Brokerages Market Market Dynamics & Concentration
The E-Brokerages Market exhibits a moderate to high concentration, with a few dominant players capturing significant market share. Key innovation drivers include the relentless pursuit of user-friendly platforms, advanced trading tools, and lower commission fees. Regulatory frameworks, though evolving, continue to be a critical factor influencing market entry and operational strategies. Product substitutes are increasingly prevalent, ranging from robo-advisors to decentralized finance (DeFi) platforms, pushing traditional e-brokerages to innovate. End-user trends show a growing preference for mobile-first trading experiences, educational resources, and socially integrated investment communities. Mergers and acquisitions (M&A) activities are a significant aspect of market dynamics, facilitating consolidation and expansion of service offerings. For instance, the acquisition of TD Ameritrade by Charles Schwab in 2020 was a monumental event, reshaping the competitive landscape. M&A deal counts are projected to remain robust as firms seek to acquire technological capabilities or expand their customer base. Market share analysis indicates that companies like Interactive Brokers, Charles Schwab, and Fidelity Investments command substantial portions of the global market, particularly in developed economies.
- Market Concentration: Moderate to High, with key players dominating.
- Innovation Drivers: User experience (UX), advanced analytics, fee reduction, mobile accessibility.
- Regulatory Frameworks: Significant influence on operational compliance and new product development.
- Product Substitutes: Robo-advisors, DeFi platforms, alternative investment channels.
- End-User Trends: Mobile trading, financial education, social investing, ESG focus.
- M&A Activities: Strategic acquisitions for market expansion and technological integration.
E-Brokerages Market Industry Trends & Analysis
The E-Brokerages Market is experiencing robust growth, driven by several interconnected trends and technological advancements. A key growth driver is the increasing democratization of investing, enabled by accessible online platforms and reduced trading costs. The compound annual growth rate (CAGR) for the E-Brokerages Market is projected to be robust, fueled by a growing population of digitally native investors and increasing disposable incomes. Technological disruptions are at the forefront, with the integration of Artificial Intelligence (AI) and Machine Learning (ML) for personalized investment advice, algorithmic trading, and fraud detection. Blockchain technology also holds promise for enhancing transparency and security in transactions. Consumer preferences are rapidly shifting towards intuitive, mobile-first interfaces, seamless onboarding processes, and a wide array of investment products, including cryptocurrencies and alternative assets. The competitive dynamics are intense, with established players investing heavily in platform enhancements and new entrants challenging incumbents with disruptive business models. Market penetration is steadily increasing, especially in emerging economies, as financial literacy improves and access to technology expands. The shift towards commission-free trading has fundamentally altered revenue models, pushing firms to focus on subscription services, payment for order flow, and value-added services. The rise of social trading platforms has also introduced a new dimension to market engagement, allowing users to follow and replicate trades of experienced investors. This has democratized investment strategies and lowered the barrier to entry for novice traders. The ongoing evolution of financial regulations, while sometimes posing challenges, also creates opportunities for compliant and innovative e-brokerage solutions. The demand for sustainable and ethical investment options (ESG) is also a growing trend, prompting e-brokerages to offer dedicated ESG-focused portfolios and screening tools. The integration of open banking initiatives is further facilitating seamless money management and investment within a single digital ecosystem. The continuous development of APIs is enabling third-party developers to build innovative applications on top of e-brokerage platforms, fostering a richer user experience and expanding the ecosystem.
Leading Markets & Segments in E-Brokerages Market
The North America region currently dominates the E-Brokerages Market, driven by a mature financial infrastructure, high levels of digital adoption, and a significant retail investor base. Within this region, the United States stands out as the leading country due to the presence of major global e-brokerage firms and a favorable regulatory environment for financial innovation.
Segment Dominance Analysis:
Client Segment:
- Retailers: This segment represents the largest and fastest-growing portion of the E-Brokerages Market. Factors contributing to this dominance include the increasing accessibility of trading platforms, a surge in individual investing driven by market events and social media influence, and a growing desire for financial independence among younger demographics. The ease of use offered by mobile applications and the availability of educational resources are crucial for attracting and retaining retail clients.
- Institutional: While smaller in number, institutional clients contribute significantly to trading volumes and revenue. This segment includes hedge funds, asset managers, and proprietary trading firms. They demand advanced trading tools, robust analytical capabilities, institutional-grade research, and competitive execution pricing.
Services Provided Segment:
- Discounted Brokers: This segment has experienced explosive growth due to the widespread adoption of zero-commission trading models. These brokers primarily focus on providing low-cost execution of trades, attracting a vast number of price-sensitive retail investors. Their competitive advantage lies in their ability to offer a streamlined trading experience at minimal cost.
- Full Time Brokers: While the "full-time broker" model as traditionally understood is evolving, this segment encompasses e-brokerages that offer a comprehensive suite of services beyond just trade execution. This includes in-depth research, financial advisory services, portfolio management tools, and personalized support. They often cater to more sophisticated investors or those seeking a more guided investment journey.
Ownership Segment:
- Publicly Held: Publicly held e-brokerages, such as Charles Schwab and Interactive Brokers, benefit from greater access to capital markets for funding growth and acquisitions. Their transparency and regulatory compliance are often viewed favorably by a broad investor base. They are subject to greater public scrutiny and reporting requirements.
- Privately Held: Privately held firms, like eToro in its earlier stages, can often exhibit greater agility and a longer-term strategic vision, free from the short-term pressures of quarterly earnings reports. They may focus on specific niche markets or innovative technologies before seeking public funding or being acquired.
Key Drivers of Dominance in Leading Markets & Segments:
- Economic Policies: Favorable interest rates and economic growth stimulate investment activity.
- Infrastructure: Robust internet connectivity and widespread smartphone penetration are crucial for digital brokerage services.
- Financial Literacy: Increasing awareness and education about investing empower more individuals to participate in the market.
- Technological Innovation: The rapid development and adoption of user-friendly trading platforms and mobile applications are key differentiators.
- Regulatory Environment: Clear and supportive regulations encourage market participation and innovation.
E-Brokerages Market Product Developments
Product development in the E-Brokerages Market is characterized by an intense focus on enhancing user experience and expanding investment options. Innovations include AI-powered trading assistants offering personalized recommendations and market insights, advanced charting tools with real-time data feeds, and seamless integration with third-party financial management applications. The competitive advantage for e-brokerages now lies in their ability to provide a holistic digital financial ecosystem. This includes offering a diverse range of assets, from traditional stocks and bonds to cryptocurrencies and fractional shares, alongside educational resources and social trading features. The emphasis is on building intuitive, mobile-first platforms that cater to both novice and experienced traders, fostering engagement and loyalty through continuous feature updates and a user-centric design philosophy.
Key Drivers of E-Brokerages Market Growth
The E-Brokerages Market is propelled by a confluence of powerful growth drivers. Technological advancements, particularly in AI and mobile computing, have made investing more accessible and user-friendly than ever before. The increasing digital literacy and adoption of smartphones globally are expanding the potential investor base. Favorable economic conditions, including periods of low interest rates and economic expansion, encourage individuals to seek higher returns through market investments. Regulatory changes that reduce trading barriers and promote competition also play a vital role. Furthermore, a growing desire for financial independence and wealth creation among younger demographics acts as a significant catalyst.
Challenges in the E-Brokerages Market Market
Despite its growth, the E-Brokerages Market faces several significant challenges. Intensifying competition from both established players and new fintech disruptors leads to pressure on fees and necessitates continuous innovation, impacting profitability. Evolving regulatory landscapes can introduce compliance burdens and operational complexities, requiring significant investment in legal and technical infrastructure. Cybersecurity threats pose a constant risk, demanding robust measures to protect client data and assets. Market volatility and economic downturns can deter new investors and lead to increased trading activity from existing ones, requiring sophisticated risk management. Customer acquisition costs can be high in a crowded market, and retaining clients demands ongoing value provision.
Emerging Opportunities in E-Brokerages Market
The E-Brokerages Market is ripe with emerging opportunities that promise long-term growth. The expansion into emerging markets presents a vast untapped potential as digital infrastructure and financial literacy improve. Technological breakthroughs such as decentralized finance (DeFi) and the metaverse could create entirely new investment avenues and trading experiences. Strategic partnerships with FinTech companies, data providers, and financial education platforms can enhance service offerings and reach. The growing demand for Environmental, Social, and Governance (ESG) investing offers a significant niche for specialized products and services. Furthermore, the development of AI-driven personalized financial advice and automated portfolio management can cater to a broader spectrum of investor needs, fostering deeper customer engagement.
Leading Players in the E-Brokerages Market Sector
- Interactive Brokers
- Charles Schwab
- Fidelity Investments
- TD Ameritrade
- E-Trade
- TastyWorks
- Etoro
- X-Trade Brokers
- IC Markets
- Eoption
- First Prudential Markets
Key Milestones in E-Brokerages Market Industry
- May 2022: Interactive Brokers partnered with TradingView, enabling clients to trade directly from TradingView workspaces and charts.
- May 2022: Fidelity International partnered with Canadian FinTech company, Conquest, becoming the exclusive distributor of its financial planning software in the UK independent advice market.
- August 2022: eToro agreed to acquire Gatsby, a fintech firm, for USD 50 million in cash and common shares.
Strategic Outlook for E-Brokerages Market Market
The strategic outlook for the E-Brokerages Market is exceptionally positive, characterized by continuous innovation and market expansion. Growth accelerators will include the further integration of AI and machine learning for hyper-personalized customer experiences and sophisticated trading tools. The expansion into new geographical markets, particularly in Asia and Latin America, will be a key focus. Strategic partnerships and potential acquisitions will continue to shape the competitive landscape, enabling firms to broaden their product offerings and technological capabilities. The increasing demand for integrated financial wellness solutions, encompassing investing, banking, and budgeting, presents a significant opportunity for e-brokerages to become central hubs for users' financial lives. The development of specialized platforms catering to specific investor segments, such as crypto-native traders or ESG-focused investors, will also drive market growth.
E-Brokerages Market Segmentation
-
1. Client
- 1.1. Retailers
- 1.2. Institutional
-
2. Services Provided
- 2.1. Full Time Brokers
- 2.2. Discounted Brokers
-
3. Ownership
- 3.1. Privately Held
- 3.2. Publicly Held
E-Brokerages Market Segmentation By Geography
- 1. North America
- 2. Europe
- 3. Asia Pacific
- 4. South America
- 5. Middle East and Africa
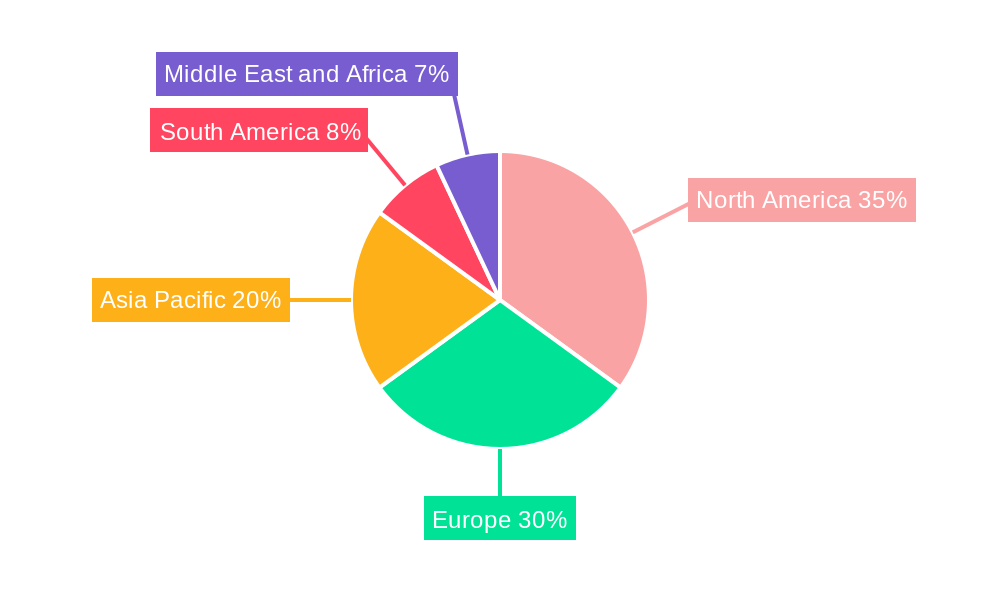
E-Brokerages Market Regional Market Share
Geographic Coverage of E-Brokerages Market
E-Brokerages Market REPORT HIGHLIGHTS
| Aspects | Details |
|---|---|
| Study Period | 2020-2034 |
| Base Year | 2025 |
| Estimated Year | 2026 |
| Forecast Period | 2026-2034 |
| Historical Period | 2020-2025 |
| Growth Rate | CAGR of > 6.50% from 2020-2034 |
| Segmentation |
|
Table of Contents
- 1. Introduction
- 1.1. Research Scope
- 1.2. Market Segmentation
- 1.3. Research Objective
- 1.4. Definitions and Assumptions
- 2. Executive Summary
- 2.1. Market Snapshot
- 3. Market Dynamics
- 3.1. Market Drivers
- 3.2. Market Restrains
- 3.3. Market Trends
- 3.4. Market Opportunities
- 4. Market Factor Analysis
- 4.1. Porters Five Forces
- 4.1.1. Bargaining Power of Suppliers
- 4.1.2. Bargaining Power of Buyers
- 4.1.3. Threat of New Entrants
- 4.1.4. Threat of Substitutes
- 4.1.5. Competitive Rivalry
- 4.2. PESTEL analysis
- 4.3. BCG Analysis
- 4.3.1. Stars (High Growth, High Market Share)
- 4.3.2. Cash Cows (Low Growth, High Market Share)
- 4.3.3. Question Mark (High Growth, Low Market Share)
- 4.3.4. Dogs (Low Growth, Low Market Share)
- 4.4. Ansoff Matrix Analysis
- 4.5. Supply Chain Analysis
- 4.6. Regulatory Landscape
- 4.7. Current Market Potential and Opportunity Assessment (TAM–SAM–SOM Framework)
- 4.8. MDP Analyst Note
- 4.1. Porters Five Forces
- 5. Market Analysis, Insights and Forecast 2021-2033
- 5.1. Market Analysis, Insights and Forecast - by Client
- 5.1.1. Retailers
- 5.1.2. Institutional
- 5.2. Market Analysis, Insights and Forecast - by Services Provided
- 5.2.1. Full Time Brokers
- 5.2.2. Discounted Brokers
- 5.3. Market Analysis, Insights and Forecast - by Ownership
- 5.3.1. Privately Held
- 5.3.2. Publicly Held
- 5.4. Market Analysis, Insights and Forecast - by Region
- 5.4.1. North America
- 5.4.2. Europe
- 5.4.3. Asia Pacific
- 5.4.4. South America
- 5.4.5. Middle East and Africa
- 5.1. Market Analysis, Insights and Forecast - by Client
- 6. Global E-Brokerages Market Analysis, Insights and Forecast, 2021-2033
- 6.1. Market Analysis, Insights and Forecast - by Client
- 6.1.1. Retailers
- 6.1.2. Institutional
- 6.2. Market Analysis, Insights and Forecast - by Services Provided
- 6.2.1. Full Time Brokers
- 6.2.2. Discounted Brokers
- 6.3. Market Analysis, Insights and Forecast - by Ownership
- 6.3.1. Privately Held
- 6.3.2. Publicly Held
- 6.1. Market Analysis, Insights and Forecast - by Client
- 7. North America E-Brokerages Market Analysis, Insights and Forecast, 2020-2032
- 7.1. Market Analysis, Insights and Forecast - by Client
- 7.1.1. Retailers
- 7.1.2. Institutional
- 7.2. Market Analysis, Insights and Forecast - by Services Provided
- 7.2.1. Full Time Brokers
- 7.2.2. Discounted Brokers
- 7.3. Market Analysis, Insights and Forecast - by Ownership
- 7.3.1. Privately Held
- 7.3.2. Publicly Held
- 7.1. Market Analysis, Insights and Forecast - by Client
- 8. Europe E-Brokerages Market Analysis, Insights and Forecast, 2020-2032
- 8.1. Market Analysis, Insights and Forecast - by Client
- 8.1.1. Retailers
- 8.1.2. Institutional
- 8.2. Market Analysis, Insights and Forecast - by Services Provided
- 8.2.1. Full Time Brokers
- 8.2.2. Discounted Brokers
- 8.3. Market Analysis, Insights and Forecast - by Ownership
- 8.3.1. Privately Held
- 8.3.2. Publicly Held
- 8.1. Market Analysis, Insights and Forecast - by Client
- 9. Asia Pacific E-Brokerages Market Analysis, Insights and Forecast, 2020-2032
- 9.1. Market Analysis, Insights and Forecast - by Client
- 9.1.1. Retailers
- 9.1.2. Institutional
- 9.2. Market Analysis, Insights and Forecast - by Services Provided
- 9.2.1. Full Time Brokers
- 9.2.2. Discounted Brokers
- 9.3. Market Analysis, Insights and Forecast - by Ownership
- 9.3.1. Privately Held
- 9.3.2. Publicly Held
- 9.1. Market Analysis, Insights and Forecast - by Client
- 10. South America E-Brokerages Market Analysis, Insights and Forecast, 2020-2032
- 10.1. Market Analysis, Insights and Forecast - by Client
- 10.1.1. Retailers
- 10.1.2. Institutional
- 10.2. Market Analysis, Insights and Forecast - by Services Provided
- 10.2.1. Full Time Brokers
- 10.2.2. Discounted Brokers
- 10.3. Market Analysis, Insights and Forecast - by Ownership
- 10.3.1. Privately Held
- 10.3.2. Publicly Held
- 10.1. Market Analysis, Insights and Forecast - by Client
- 11. Middle East and Africa E-Brokerages Market Analysis, Insights and Forecast, 2020-2032
- 11.1. Market Analysis, Insights and Forecast - by Client
- 11.1.1. Retailers
- 11.1.2. Institutional
- 11.2. Market Analysis, Insights and Forecast - by Services Provided
- 11.2.1. Full Time Brokers
- 11.2.2. Discounted Brokers
- 11.3. Market Analysis, Insights and Forecast - by Ownership
- 11.3.1. Privately Held
- 11.3.2. Publicly Held
- 11.1. Market Analysis, Insights and Forecast - by Client
- 12. Competitive Analysis
- 12.1. Company Profiles
- 12.1.1 Interactive Brokers
- 12.1.1.1. Company Overview
- 12.1.1.2. Products
- 12.1.1.3. Company Financials
- 12.1.1.4. SWOT Analysis
- 12.1.2 Charles Schwab
- 12.1.2.1. Company Overview
- 12.1.2.2. Products
- 12.1.2.3. Company Financials
- 12.1.2.4. SWOT Analysis
- 12.1.3 Fidelity Investments
- 12.1.3.1. Company Overview
- 12.1.3.2. Products
- 12.1.3.3. Company Financials
- 12.1.3.4. SWOT Analysis
- 12.1.4 TD Ameritrade
- 12.1.4.1. Company Overview
- 12.1.4.2. Products
- 12.1.4.3. Company Financials
- 12.1.4.4. SWOT Analysis
- 12.1.5 E-Trade
- 12.1.5.1. Company Overview
- 12.1.5.2. Products
- 12.1.5.3. Company Financials
- 12.1.5.4. SWOT Analysis
- 12.1.6 TastyWorks
- 12.1.6.1. Company Overview
- 12.1.6.2. Products
- 12.1.6.3. Company Financials
- 12.1.6.4. SWOT Analysis
- 12.1.7 Etoro
- 12.1.7.1. Company Overview
- 12.1.7.2. Products
- 12.1.7.3. Company Financials
- 12.1.7.4. SWOT Analysis
- 12.1.8 X-Trade Brokers
- 12.1.8.1. Company Overview
- 12.1.8.2. Products
- 12.1.8.3. Company Financials
- 12.1.8.4. SWOT Analysis
- 12.1.9 IC Markets
- 12.1.9.1. Company Overview
- 12.1.9.2. Products
- 12.1.9.3. Company Financials
- 12.1.9.4. SWOT Analysis
- 12.1.10 Eoption
- 12.1.10.1. Company Overview
- 12.1.10.2. Products
- 12.1.10.3. Company Financials
- 12.1.10.4. SWOT Analysis
- 12.1.11 First Prudential Markets**List Not Exhaustive
- 12.1.11.1. Company Overview
- 12.1.11.2. Products
- 12.1.11.3. Company Financials
- 12.1.11.4. SWOT Analysis
- 12.1.1 Interactive Brokers
- 12.2. Market Entropy
- 12.2.1 Company's Key Areas Served
- 12.2.2 Recent Developments
- 12.3. Company Market Share Analysis 2025
- 12.3.1 Top 5 Companies Market Share Analysis
- 12.3.2 Top 3 Companies Market Share Analysis
- 12.4. List of Potential Customers
- 13. Research Methodology
List of Figures
- Figure 1: Global E-Brokerages Market Revenue Breakdown (Million, %) by Region 2025 & 2033
- Figure 2: North America E-Brokerages Market Revenue (Million), by Client 2025 & 2033
- Figure 3: North America E-Brokerages Market Revenue Share (%), by Client 2025 & 2033
- Figure 4: North America E-Brokerages Market Revenue (Million), by Services Provided 2025 & 2033
- Figure 5: North America E-Brokerages Market Revenue Share (%), by Services Provided 2025 & 2033
- Figure 6: North America E-Brokerages Market Revenue (Million), by Ownership 2025 & 2033
- Figure 7: North America E-Brokerages Market Revenue Share (%), by Ownership 2025 & 2033
- Figure 8: North America E-Brokerages Market Revenue (Million), by Country 2025 & 2033
- Figure 9: North America E-Brokerages Market Revenue Share (%), by Country 2025 & 2033
- Figure 10: Europe E-Brokerages Market Revenue (Million), by Client 2025 & 2033
- Figure 11: Europe E-Brokerages Market Revenue Share (%), by Client 2025 & 2033
- Figure 12: Europe E-Brokerages Market Revenue (Million), by Services Provided 2025 & 2033
- Figure 13: Europe E-Brokerages Market Revenue Share (%), by Services Provided 2025 & 2033
- Figure 14: Europe E-Brokerages Market Revenue (Million), by Ownership 2025 & 2033
- Figure 15: Europe E-Brokerages Market Revenue Share (%), by Ownership 2025 & 2033
- Figure 16: Europe E-Brokerages Market Revenue (Million), by Country 2025 & 2033
- Figure 17: Europe E-Brokerages Market Revenue Share (%), by Country 2025 & 2033
- Figure 18: Asia Pacific E-Brokerages Market Revenue (Million), by Client 2025 & 2033
- Figure 19: Asia Pacific E-Brokerages Market Revenue Share (%), by Client 2025 & 2033
- Figure 20: Asia Pacific E-Brokerages Market Revenue (Million), by Services Provided 2025 & 2033
- Figure 21: Asia Pacific E-Brokerages Market Revenue Share (%), by Services Provided 2025 & 2033
- Figure 22: Asia Pacific E-Brokerages Market Revenue (Million), by Ownership 2025 & 2033
- Figure 23: Asia Pacific E-Brokerages Market Revenue Share (%), by Ownership 2025 & 2033
- Figure 24: Asia Pacific E-Brokerages Market Revenue (Million), by Country 2025 & 2033
- Figure 25: Asia Pacific E-Brokerages Market Revenue Share (%), by Country 2025 & 2033
- Figure 26: South America E-Brokerages Market Revenue (Million), by Client 2025 & 2033
- Figure 27: South America E-Brokerages Market Revenue Share (%), by Client 2025 & 2033
- Figure 28: South America E-Brokerages Market Revenue (Million), by Services Provided 2025 & 2033
- Figure 29: South America E-Brokerages Market Revenue Share (%), by Services Provided 2025 & 2033
- Figure 30: South America E-Brokerages Market Revenue (Million), by Ownership 2025 & 2033
- Figure 31: South America E-Brokerages Market Revenue Share (%), by Ownership 2025 & 2033
- Figure 32: South America E-Brokerages Market Revenue (Million), by Country 2025 & 2033
- Figure 33: South America E-Brokerages Market Revenue Share (%), by Country 2025 & 2033
- Figure 34: Middle East and Africa E-Brokerages Market Revenue (Million), by Client 2025 & 2033
- Figure 35: Middle East and Africa E-Brokerages Market Revenue Share (%), by Client 2025 & 2033
- Figure 36: Middle East and Africa E-Brokerages Market Revenue (Million), by Services Provided 2025 & 2033
- Figure 37: Middle East and Africa E-Brokerages Market Revenue Share (%), by Services Provided 2025 & 2033
- Figure 38: Middle East and Africa E-Brokerages Market Revenue (Million), by Ownership 2025 & 2033
- Figure 39: Middle East and Africa E-Brokerages Market Revenue Share (%), by Ownership 2025 & 2033
- Figure 40: Middle East and Africa E-Brokerages Market Revenue (Million), by Country 2025 & 2033
- Figure 41: Middle East and Africa E-Brokerages Market Revenue Share (%), by Country 2025 & 2033
List of Tables
- Table 1: Global E-Brokerages Market Revenue Million Forecast, by Client 2020 & 2033
- Table 2: Global E-Brokerages Market Revenue Million Forecast, by Services Provided 2020 & 2033
- Table 3: Global E-Brokerages Market Revenue Million Forecast, by Ownership 2020 & 2033
- Table 4: Global E-Brokerages Market Revenue Million Forecast, by Region 2020 & 2033
- Table 5: Global E-Brokerages Market Revenue Million Forecast, by Client 2020 & 2033
- Table 6: Global E-Brokerages Market Revenue Million Forecast, by Services Provided 2020 & 2033
- Table 7: Global E-Brokerages Market Revenue Million Forecast, by Ownership 2020 & 2033
- Table 8: Global E-Brokerages Market Revenue Million Forecast, by Country 2020 & 2033
- Table 9: Global E-Brokerages Market Revenue Million Forecast, by Client 2020 & 2033
- Table 10: Global E-Brokerages Market Revenue Million Forecast, by Services Provided 2020 & 2033
- Table 11: Global E-Brokerages Market Revenue Million Forecast, by Ownership 2020 & 2033
- Table 12: Global E-Brokerages Market Revenue Million Forecast, by Country 2020 & 2033
- Table 13: Global E-Brokerages Market Revenue Million Forecast, by Client 2020 & 2033
- Table 14: Global E-Brokerages Market Revenue Million Forecast, by Services Provided 2020 & 2033
- Table 15: Global E-Brokerages Market Revenue Million Forecast, by Ownership 2020 & 2033
- Table 16: Global E-Brokerages Market Revenue Million Forecast, by Country 2020 & 2033
- Table 17: Global E-Brokerages Market Revenue Million Forecast, by Client 2020 & 2033
- Table 18: Global E-Brokerages Market Revenue Million Forecast, by Services Provided 2020 & 2033
- Table 19: Global E-Brokerages Market Revenue Million Forecast, by Ownership 2020 & 2033
- Table 20: Global E-Brokerages Market Revenue Million Forecast, by Country 2020 & 2033
- Table 21: Global E-Brokerages Market Revenue Million Forecast, by Client 2020 & 2033
- Table 22: Global E-Brokerages Market Revenue Million Forecast, by Services Provided 2020 & 2033
- Table 23: Global E-Brokerages Market Revenue Million Forecast, by Ownership 2020 & 2033
- Table 24: Global E-Brokerages Market Revenue Million Forecast, by Country 2020 & 2033
Frequently Asked Questions
1. What is the projected Compound Annual Growth Rate (CAGR) of the E-Brokerages Market?
The projected CAGR is approximately > 6.50%.
2. Which companies are prominent players in the E-Brokerages Market?
Key companies in the market include Interactive Brokers, Charles Schwab, Fidelity Investments, TD Ameritrade, E-Trade, TastyWorks, Etoro, X-Trade Brokers, IC Markets, Eoption, First Prudential Markets**List Not Exhaustive.
3. What are the main segments of the E-Brokerages Market?
The market segments include Client, Services Provided, Ownership.
4. Can you provide details about the market size?
The market size is estimated to be USD XX Million as of 2022.
5. What are some drivers contributing to market growth?
N/A
6. What are the notable trends driving market growth?
Zero commission in United States equity markets change market dynamics.
7. Are there any restraints impacting market growth?
N/A
8. Can you provide examples of recent developments in the market?
May 2022: Interactive Brokers partnered with TradingView. The new partnership was like a win-win for all parties, particularly for Interactive broker clients as they were now trading directly from their TradingView workspaces and charts.
9. What pricing options are available for accessing the report?
Pricing options include single-user, multi-user, and enterprise licenses priced at USD 4750, USD 5250, and USD 8750 respectively.
10. Is the market size provided in terms of value or volume?
The market size is provided in terms of value, measured in Million.
11. Are there any specific market keywords associated with the report?
Yes, the market keyword associated with the report is "E-Brokerages Market," which aids in identifying and referencing the specific market segment covered.
12. How do I determine which pricing option suits my needs best?
The pricing options vary based on user requirements and access needs. Individual users may opt for single-user licenses, while businesses requiring broader access may choose multi-user or enterprise licenses for cost-effective access to the report.
13. Are there any additional resources or data provided in the E-Brokerages Market report?
While the report offers comprehensive insights, it's advisable to review the specific contents or supplementary materials provided to ascertain if additional resources or data are available.
14. How can I stay updated on further developments or reports in the E-Brokerages Market?
To stay informed about further developments, trends, and reports in the E-Brokerages Market, consider subscribing to industry newsletters, following relevant companies and organizations, or regularly checking reputable industry news sources and publications.
Methodology
Step 1 - Identification of Relevant Samples Size from Population Database


Step 2 - Approaches for Defining Global Market Size (Value, Volume* & Price*)

Note*: In applicable scenarios
Step 3 - Data Sources
Primary Research
- Web Analytics
- Survey Reports
- Research Institute
- Latest Research Reports
- Opinion Leaders
Secondary Research
- Annual Reports
- White Paper
- Latest Press Release
- Industry Association
- Paid Database
- Investor Presentations

Step 4 - Data Triangulation
Involves using different sources of information in order to increase the validity of a study
These sources are likely to be stakeholders in a program - participants, other researchers, program staff, other community members, and so on.
Then we put all data in single framework & apply various statistical tools to find out the dynamic on the market.
During the analysis stage, feedback from the stakeholder groups would be compared to determine areas of agreement as well as areas of divergence