

Key Insights
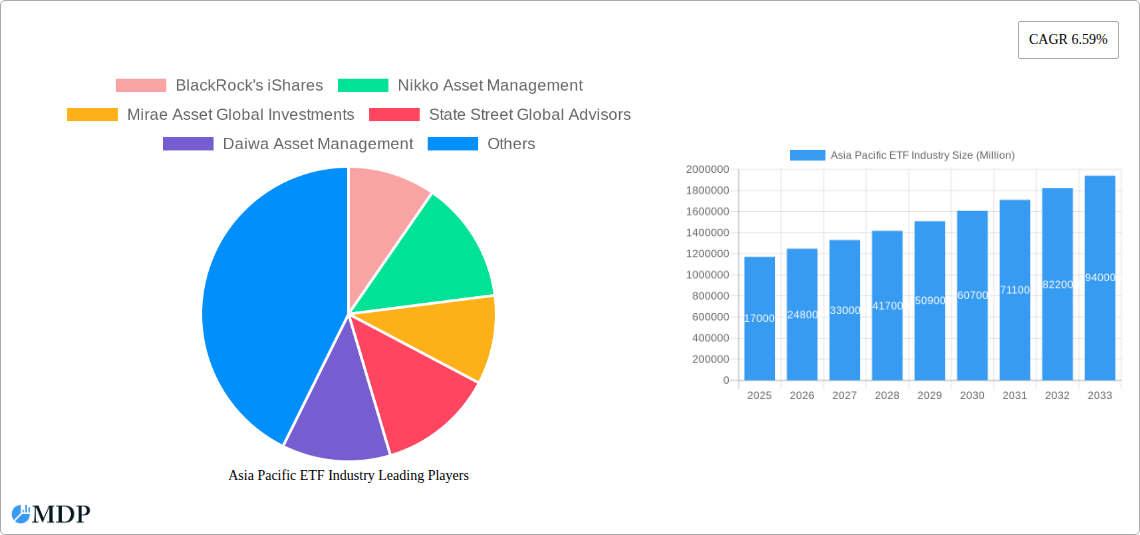
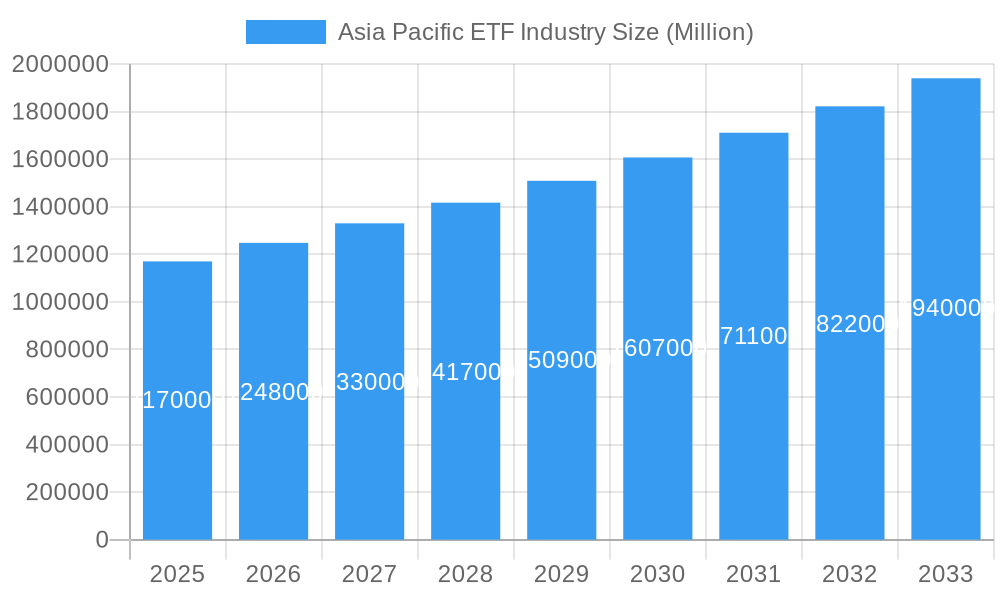
The Asia-Pacific exchange-traded fund (ETF) industry is experiencing robust growth, projected to reach a market size of $1.17 trillion in 2025, exhibiting a Compound Annual Growth Rate (CAGR) of 6.59% from 2019 to 2033. This expansion is driven by several key factors. Increasing investor sophistication and a growing preference for passive investment strategies are fueling demand for ETFs. Furthermore, the region's burgeoning middle class, coupled with rising levels of disposable income, are contributing to a larger pool of potential investors. Regulatory reforms promoting ETF accessibility and increased market transparency are also positively impacting market growth. The industry is witnessing a surge in the adoption of thematic and actively managed ETFs, catering to the evolving investment preferences of sophisticated investors seeking diversification and targeted exposure to specific sectors or themes. Competition among major players like BlackRock's iShares, Nikko Asset Management, and others, is fostering innovation and product diversification, further driving market expansion.
Asia Pacific ETF Industry Market Size (In Million)
However, certain challenges remain. Geopolitical uncertainties within the Asia-Pacific region and fluctuations in global market conditions can introduce volatility. Additionally, education and awareness around ETFs remain crucial for broadening investor participation, especially in less developed markets. The increasing popularity of alternative investment vehicles will also influence the growth rate as investors shift their asset allocation. Nonetheless, the long-term outlook for the Asia-Pacific ETF market remains positive, driven by favorable demographics, regulatory advancements, and the continued adoption of passive investment strategies. The forecast period of 2025-2033 anticipates sustained growth, underpinned by the factors outlined above and the increasing integration of the Asia-Pacific region into the global financial market.
Asia Pacific ETF Industry Company Market Share
Asia Pacific ETF Industry: A Comprehensive Market Report (2019-2033)
This in-depth report provides a comprehensive analysis of the Asia Pacific ETF industry, covering market dynamics, leading players, emerging trends, and future growth prospects from 2019 to 2033. With a base year of 2025 and a forecast period extending to 2033, this report is an invaluable resource for investors, industry stakeholders, and strategic decision-makers seeking to understand and capitalize on the opportunities within this rapidly evolving market. The report leverages extensive data analysis to provide actionable insights and projections, encompassing key market segments and dominant players. The total market size is estimated at xx Million in 2025.
Asia Pacific ETF Industry Market Dynamics & Concentration
The Asia Pacific ETF market exhibits a dynamic interplay of concentration, innovation, and regulatory influence. While a few major players dominate, the market also shows pockets of emerging players and niche offerings. The market share of the top 5 players is estimated at xx%, showing a moderately concentrated landscape in 2025.
Market Concentration: BlackRock's iShares, Nikko Asset Management, Mirae Asset Global Investments, and State Street Global Advisors hold significant market share, indicating a consolidated yet competitive landscape. Smaller players contribute significantly to innovation and niche product development.
Innovation Drivers: Technological advancements, particularly in algorithmic trading and data analytics, are driving product innovation and efficiency gains within the industry.
Regulatory Frameworks: Varying regulatory landscapes across different Asia Pacific nations impact market access and product development. Recent regulatory changes have led to increased transparency and investor protection, fostering market growth.
Product Substitutes: Mutual funds and other investment vehicles remain substitutes, although ETFs' inherent advantages in terms of transparency, cost-efficiency, and ease of trading are driving market shift towards ETF adoption.
End-User Trends: Growing retail investor participation, coupled with increasing awareness of ETFs’ benefits, is fueling demand. Institutional investors also see ETFs as efficient tools for portfolio diversification and risk management.
M&A Activities: The number of M&A deals in the Asia Pacific ETF market between 2019 and 2024 averaged xx per year, reflecting both consolidation and strategic expansion efforts within the industry.
Asia Pacific ETF Industry Industry Trends & Analysis
The Asia Pacific ETF industry is experiencing robust growth, driven by several key factors. The Compound Annual Growth Rate (CAGR) is projected at xx% from 2025 to 2033, indicating significant expansion potential. Market penetration, currently at xx%, is expected to increase steadily as investor awareness and acceptance continue to rise.
Technological disruptions, such as the increased use of robo-advisors and fintech platforms, have streamlined access to ETFs and lowered the barriers to entry for retail investors. This has led to a surge in the popularity of passively managed ETFs. Consumer preferences are increasingly shifting toward low-cost, transparent, and diversified investment options, further boosting ETF adoption. Competitive dynamics are characterized by both fierce competition among established players and the emergence of new entrants, resulting in continuous innovation and product diversification.
Leading Markets & Segments in Asia Pacific ETF Industry
Japan, Australia, and South Korea emerge as leading markets, driven by factors including strong regulatory frameworks, developed capital markets, and a growing investor base. Within the industry, equity ETFs constitute the largest segment, followed by fixed-income and commodity ETFs.
Key Drivers for Japan: Mature financial markets, investor sophistication, and proactive government policies supporting capital market development.
Key Drivers for Australia: Robust regulatory environment, relatively high per capita wealth, and rising demand for diversified investment products.
Key Drivers for South Korea: Expanding capital markets, increasing retail investor participation, and government initiatives to promote financial inclusion.
The dominance of these markets is largely attributed to their relatively mature economies, high levels of financial literacy, and supportive regulatory frameworks. However, other countries within the Asia Pacific region, particularly those experiencing rapid economic growth and expanding middle classes, present significant opportunities for future market expansion.
Asia Pacific ETF Industry Product Developments
Recent product innovations focus on niche strategies such as thematic ETFs (e.g., focusing on ESG, technology, and specific industry sectors), actively managed ETFs, and currency-hedged ETFs catering to specific investor needs. These developments are enhancing product differentiation and expanding the overall appeal of ETFs to a wider spectrum of investors. The growing integration of technology into ETF trading and portfolio management is further enhancing the user experience and improving efficiency.
Key Drivers of Asia Pacific ETF Industry Growth
Several factors contribute to the projected growth of the Asia Pacific ETF industry. Firstly, the region's expanding middle class is increasing the number of potential investors seeking diversified investment options. Secondly, regulatory advancements are improving market transparency and investor protection, fostering confidence and trust. Thirdly, technological innovation continues to improve access and affordability of ETFs, leading to higher adoption rates.
Challenges in the Asia Pacific ETF Industry Market
Despite the significant growth potential, certain challenges hinder broader market adoption. Regulatory inconsistencies across different jurisdictions create complexities for ETF issuers. Supply chain disruptions related to data and technology can affect the overall efficiency of the ETF ecosystem. Furthermore, intense competition among established players and the emergence of new players maintain competitive pressures.
Emerging Opportunities in Asia Pacific ETF Industry
The Asia Pacific ETF market is poised for continued growth, fueled by factors such as rising retail participation, technological advancements in trading and portfolio management platforms, and increasing cross-border investment flows within the region. Strategic partnerships between established ETF providers and local financial institutions are further expanding market reach and accessibility.
Leading Players in the Asia Pacific ETF Industry Sector
- BlackRock's iShares
- Nikko Asset Management
- Mirae Asset Global Investments
- State Street Global Advisors
- Daiwa Asset Management
- Mitsubishi UFJ Financial Group
- Samsung Asset Management
- Fortune SG Fund Management
- China Asset Management
- Nomura Asset Management Co Ltd (List Not Exhaustive)
Key Milestones in Asia Pacific ETF Industry Industry
- December 2022: Nikko Asset Management Co. Ltd launched a new ETF-listed index fund, US Equity (Dow Average), on the Tokyo Stock Exchange, featuring no currency hedge.
- May 2023: Nomura Investor Relations Co. Ltd and Nomura Securities Co. Ltd partnered with QUICK Corp. to operate a sponsored research company, potentially influencing market research and analysis within the industry.
Strategic Outlook for Asia Pacific ETF Industry Market
The Asia Pacific ETF market presents significant long-term growth potential, driven by increasing investor awareness, technological advancements, and supportive regulatory environments. Strategic partnerships, product diversification, and expansion into less-penetrated markets offer significant opportunities for both established and emerging players to achieve sustainable growth and market share gains.
Asia Pacific ETF Industry Segmentation
-
1. Types of ETFs
- 1.1. Fixed Income ETFs
- 1.2. Equity ETFs
- 1.3. Commodity ETFs
- 1.4. Currency ETFs
- 1.5. Real Estate ETFs
- 1.6. Specialty ETFs
Asia Pacific ETF Industry Segmentation By Geography
-
1. Asia Pacific
- 1.1. China
- 1.2. Japan
- 1.3. South Korea
- 1.4. India
- 1.5. Australia
- 1.6. New Zealand
- 1.7. Indonesia
- 1.8. Malaysia
- 1.9. Singapore
- 1.10. Thailand
- 1.11. Vietnam
- 1.12. Philippines
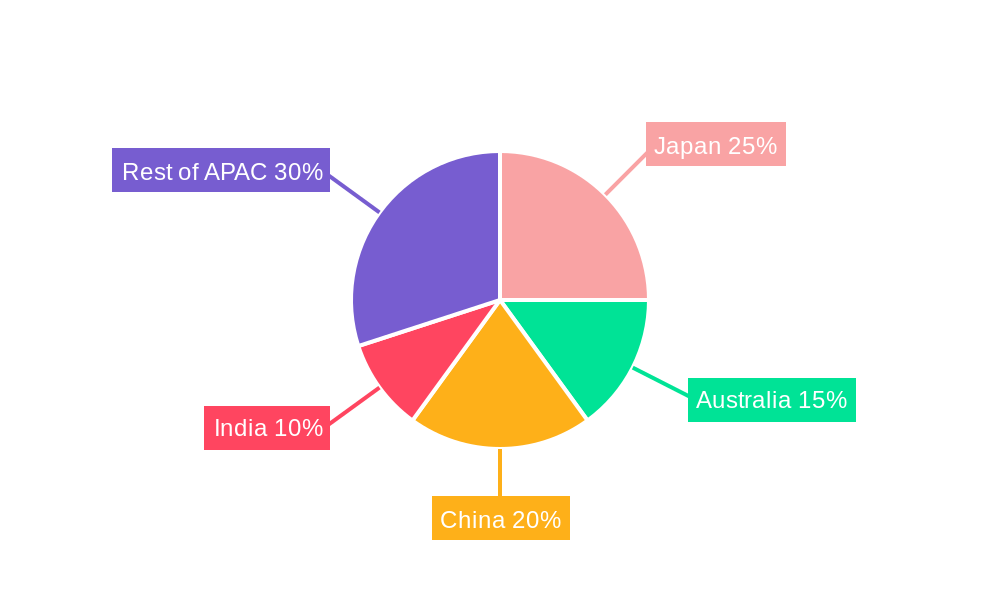
Asia Pacific ETF Industry Regional Market Share
Geographic Coverage of Asia Pacific ETF Industry
Asia Pacific ETF Industry REPORT HIGHLIGHTS
| Aspects | Details |
|---|---|
| Study Period | 2020-2034 |
| Base Year | 2025 |
| Estimated Year | 2026 |
| Forecast Period | 2026-2034 |
| Historical Period | 2020-2025 |
| Growth Rate | CAGR of 6.59% from 2020-2034 |
| Segmentation |
|
Table of Contents
- 1. Introduction
- 1.1. Research Scope
- 1.2. Market Segmentation
- 1.3. Research Objective
- 1.4. Definitions and Assumptions
- 2. Executive Summary
- 2.1. Market Snapshot
- 3. Market Dynamics
- 3.1. Market Drivers
- 3.2. Market Restrains
- 3.3. Market Trends
- 3.4. Market Opportunities
- 4. Market Factor Analysis
- 4.1. Porters Five Forces
- 4.1.1. Bargaining Power of Suppliers
- 4.1.2. Bargaining Power of Buyers
- 4.1.3. Threat of New Entrants
- 4.1.4. Threat of Substitutes
- 4.1.5. Competitive Rivalry
- 4.2. PESTEL analysis
- 4.3. BCG Analysis
- 4.3.1. Stars (High Growth, High Market Share)
- 4.3.2. Cash Cows (Low Growth, High Market Share)
- 4.3.3. Question Mark (High Growth, Low Market Share)
- 4.3.4. Dogs (Low Growth, Low Market Share)
- 4.4. Ansoff Matrix Analysis
- 4.5. Supply Chain Analysis
- 4.6. Regulatory Landscape
- 4.7. Current Market Potential and Opportunity Assessment (TAM–SAM–SOM Framework)
- 4.8. MDP Analyst Note
- 4.1. Porters Five Forces
- 5. Market Analysis, Insights and Forecast 2021-2033
- 5.1. Market Analysis, Insights and Forecast - by Types of ETFs
- 5.1.1. Fixed Income ETFs
- 5.1.2. Equity ETFs
- 5.1.3. Commodity ETFs
- 5.1.4. Currency ETFs
- 5.1.5. Real Estate ETFs
- 5.1.6. Specialty ETFs
- 5.2. Market Analysis, Insights and Forecast - by Region
- 5.2.1. Asia Pacific
- 5.1. Market Analysis, Insights and Forecast - by Types of ETFs
- 6. Asia Pacific ETF Industry Analysis, Insights and Forecast, 2021-2033
- 6.1. Market Analysis, Insights and Forecast - by Types of ETFs
- 6.1.1. Fixed Income ETFs
- 6.1.2. Equity ETFs
- 6.1.3. Commodity ETFs
- 6.1.4. Currency ETFs
- 6.1.5. Real Estate ETFs
- 6.1.6. Specialty ETFs
- 6.1. Market Analysis, Insights and Forecast - by Types of ETFs
- 7. Competitive Analysis
- 7.1. Company Profiles
- 7.1.1 BlackRock's iShares
- 7.1.1.1. Company Overview
- 7.1.1.2. Products
- 7.1.1.3. Company Financials
- 7.1.1.4. SWOT Analysis
- 7.1.2 Nikko Asset Management
- 7.1.2.1. Company Overview
- 7.1.2.2. Products
- 7.1.2.3. Company Financials
- 7.1.2.4. SWOT Analysis
- 7.1.3 Mirae Asset Global Investments
- 7.1.3.1. Company Overview
- 7.1.3.2. Products
- 7.1.3.3. Company Financials
- 7.1.3.4. SWOT Analysis
- 7.1.4 State Street Global Advisors
- 7.1.4.1. Company Overview
- 7.1.4.2. Products
- 7.1.4.3. Company Financials
- 7.1.4.4. SWOT Analysis
- 7.1.5 Daiwa Asset Management
- 7.1.5.1. Company Overview
- 7.1.5.2. Products
- 7.1.5.3. Company Financials
- 7.1.5.4. SWOT Analysis
- 7.1.6 Mitsubishi UFJ Financial Group
- 7.1.6.1. Company Overview
- 7.1.6.2. Products
- 7.1.6.3. Company Financials
- 7.1.6.4. SWOT Analysis
- 7.1.7 Samsung Asset Management
- 7.1.7.1. Company Overview
- 7.1.7.2. Products
- 7.1.7.3. Company Financials
- 7.1.7.4. SWOT Analysis
- 7.1.8 Fortune SG Fund Management
- 7.1.8.1. Company Overview
- 7.1.8.2. Products
- 7.1.8.3. Company Financials
- 7.1.8.4. SWOT Analysis
- 7.1.9 China Asset Management
- 7.1.9.1. Company Overview
- 7.1.9.2. Products
- 7.1.9.3. Company Financials
- 7.1.9.4. SWOT Analysis
- 7.1.10 Nomura Asset Management Co Ltd**List Not Exhaustive
- 7.1.10.1. Company Overview
- 7.1.10.2. Products
- 7.1.10.3. Company Financials
- 7.1.10.4. SWOT Analysis
- 7.1.1 BlackRock's iShares
- 7.2. Market Entropy
- 7.2.1 Company's Key Areas Served
- 7.2.2 Recent Developments
- 7.3. Company Market Share Analysis 2025
- 7.3.1 Top 5 Companies Market Share Analysis
- 7.3.2 Top 3 Companies Market Share Analysis
- 7.4. List of Potential Customers
- 8. Research Methodology
List of Figures
- Figure 1: Asia Pacific ETF Industry Revenue Breakdown (Million, %) by Product 2025 & 2033
- Figure 2: Asia Pacific ETF Industry Share (%) by Company 2025
List of Tables
- Table 1: Asia Pacific ETF Industry Revenue Million Forecast, by Types of ETFs 2020 & 2033
- Table 2: Asia Pacific ETF Industry Volume Trillion Forecast, by Types of ETFs 2020 & 2033
- Table 3: Asia Pacific ETF Industry Revenue Million Forecast, by Region 2020 & 2033
- Table 4: Asia Pacific ETF Industry Volume Trillion Forecast, by Region 2020 & 2033
- Table 5: Asia Pacific ETF Industry Revenue Million Forecast, by Types of ETFs 2020 & 2033
- Table 6: Asia Pacific ETF Industry Volume Trillion Forecast, by Types of ETFs 2020 & 2033
- Table 7: Asia Pacific ETF Industry Revenue Million Forecast, by Country 2020 & 2033
- Table 8: Asia Pacific ETF Industry Volume Trillion Forecast, by Country 2020 & 2033
- Table 9: China Asia Pacific ETF Industry Revenue (Million) Forecast, by Application 2020 & 2033
- Table 10: China Asia Pacific ETF Industry Volume (Trillion) Forecast, by Application 2020 & 2033
- Table 11: Japan Asia Pacific ETF Industry Revenue (Million) Forecast, by Application 2020 & 2033
- Table 12: Japan Asia Pacific ETF Industry Volume (Trillion) Forecast, by Application 2020 & 2033
- Table 13: South Korea Asia Pacific ETF Industry Revenue (Million) Forecast, by Application 2020 & 2033
- Table 14: South Korea Asia Pacific ETF Industry Volume (Trillion) Forecast, by Application 2020 & 2033
- Table 15: India Asia Pacific ETF Industry Revenue (Million) Forecast, by Application 2020 & 2033
- Table 16: India Asia Pacific ETF Industry Volume (Trillion) Forecast, by Application 2020 & 2033
- Table 17: Australia Asia Pacific ETF Industry Revenue (Million) Forecast, by Application 2020 & 2033
- Table 18: Australia Asia Pacific ETF Industry Volume (Trillion) Forecast, by Application 2020 & 2033
- Table 19: New Zealand Asia Pacific ETF Industry Revenue (Million) Forecast, by Application 2020 & 2033
- Table 20: New Zealand Asia Pacific ETF Industry Volume (Trillion) Forecast, by Application 2020 & 2033
- Table 21: Indonesia Asia Pacific ETF Industry Revenue (Million) Forecast, by Application 2020 & 2033
- Table 22: Indonesia Asia Pacific ETF Industry Volume (Trillion) Forecast, by Application 2020 & 2033
- Table 23: Malaysia Asia Pacific ETF Industry Revenue (Million) Forecast, by Application 2020 & 2033
- Table 24: Malaysia Asia Pacific ETF Industry Volume (Trillion) Forecast, by Application 2020 & 2033
- Table 25: Singapore Asia Pacific ETF Industry Revenue (Million) Forecast, by Application 2020 & 2033
- Table 26: Singapore Asia Pacific ETF Industry Volume (Trillion) Forecast, by Application 2020 & 2033
- Table 27: Thailand Asia Pacific ETF Industry Revenue (Million) Forecast, by Application 2020 & 2033
- Table 28: Thailand Asia Pacific ETF Industry Volume (Trillion) Forecast, by Application 2020 & 2033
- Table 29: Vietnam Asia Pacific ETF Industry Revenue (Million) Forecast, by Application 2020 & 2033
- Table 30: Vietnam Asia Pacific ETF Industry Volume (Trillion) Forecast, by Application 2020 & 2033
- Table 31: Philippines Asia Pacific ETF Industry Revenue (Million) Forecast, by Application 2020 & 2033
- Table 32: Philippines Asia Pacific ETF Industry Volume (Trillion) Forecast, by Application 2020 & 2033
Frequently Asked Questions
1. What is the projected Compound Annual Growth Rate (CAGR) of the Asia Pacific ETF Industry?
The projected CAGR is approximately 6.59%.
2. Which companies are prominent players in the Asia Pacific ETF Industry?
Key companies in the market include BlackRock's iShares, Nikko Asset Management, Mirae Asset Global Investments, State Street Global Advisors, Daiwa Asset Management, Mitsubishi UFJ Financial Group, Samsung Asset Management, Fortune SG Fund Management, China Asset Management, Nomura Asset Management Co Ltd**List Not Exhaustive.
3. What are the main segments of the Asia Pacific ETF Industry?
The market segments include Types of ETFs.
4. Can you provide details about the market size?
The market size is estimated to be USD 1.17 Million as of 2022.
5. What are some drivers contributing to market growth?
Accessible Investment Platforms; Growing Culture of Financial Investment.
6. What are the notable trends driving market growth?
Equity ETFs Dominate the ETF Market.
7. Are there any restraints impacting market growth?
Accessible Investment Platforms; Growing Culture of Financial Investment.
8. Can you provide examples of recent developments in the market?
May 2023: Nomura Investor Relations Co. Ltd ("Nomura IR") and Nomura Securities Co. Ltd ("Nomura Securities") partnered with QUICK Corp. to run a sponsored research company.
9. What pricing options are available for accessing the report?
Pricing options include single-user, multi-user, and enterprise licenses priced at USD 4750, USD 4950, and USD 6800 respectively.
10. Is the market size provided in terms of value or volume?
The market size is provided in terms of value, measured in Million and volume, measured in Trillion.
11. Are there any specific market keywords associated with the report?
Yes, the market keyword associated with the report is "Asia Pacific ETF Industry," which aids in identifying and referencing the specific market segment covered.
12. How do I determine which pricing option suits my needs best?
The pricing options vary based on user requirements and access needs. Individual users may opt for single-user licenses, while businesses requiring broader access may choose multi-user or enterprise licenses for cost-effective access to the report.
13. Are there any additional resources or data provided in the Asia Pacific ETF Industry report?
While the report offers comprehensive insights, it's advisable to review the specific contents or supplementary materials provided to ascertain if additional resources or data are available.
14. How can I stay updated on further developments or reports in the Asia Pacific ETF Industry?
To stay informed about further developments, trends, and reports in the Asia Pacific ETF Industry, consider subscribing to industry newsletters, following relevant companies and organizations, or regularly checking reputable industry news sources and publications.
Methodology
Step 1 - Identification of Relevant Samples Size from Population Database


Step 2 - Approaches for Defining Global Market Size (Value, Volume* & Price*)

Note*: In applicable scenarios
Step 3 - Data Sources
Primary Research
- Web Analytics
- Survey Reports
- Research Institute
- Latest Research Reports
- Opinion Leaders
Secondary Research
- Annual Reports
- White Paper
- Latest Press Release
- Industry Association
- Paid Database
- Investor Presentations

Step 4 - Data Triangulation
Involves using different sources of information in order to increase the validity of a study
These sources are likely to be stakeholders in a program - participants, other researchers, program staff, other community members, and so on.
Then we put all data in single framework & apply various statistical tools to find out the dynamic on the market.
During the analysis stage, feedback from the stakeholder groups would be compared to determine areas of agreement as well as areas of divergence