

Key Insights
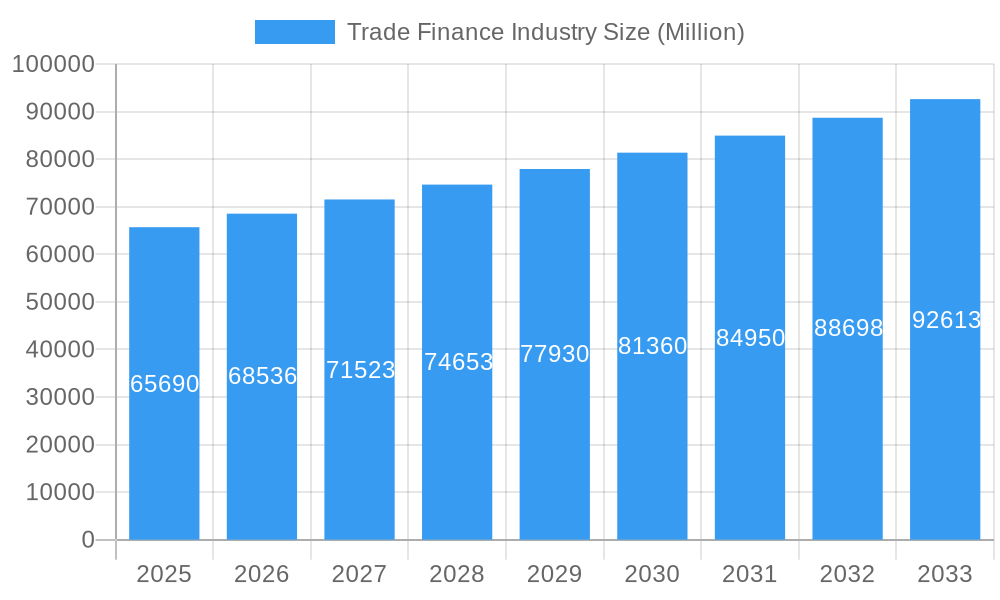
The global trade finance market, valued at $65.69 billion in 2025, is projected to experience robust growth, driven by the increasing globalization of businesses and the expansion of international trade. A Compound Annual Growth Rate (CAGR) of 4.24% from 2025 to 2033 indicates a significant market expansion over the forecast period. Key drivers include the rising demand for secure and efficient cross-border transactions, the increasing adoption of digitalization and technological advancements within the financial sector, and the growth of e-commerce and global supply chains. Furthermore, government initiatives to support international trade and investment are expected to fuel market expansion. However, challenges such as geopolitical uncertainty, fluctuating exchange rates, and increasing regulatory complexities pose potential restraints on market growth. The market is segmented by various factors including transaction type (letters of credit, guarantees, etc.), service provider (banks, fintech companies), and geographic region. Major players like Citigroup, Santander, and others compete fiercely, leveraging their global networks and expertise to capture market share. The increasing use of blockchain technology and other innovative solutions is anticipated to reshape the competitive landscape in the coming years.
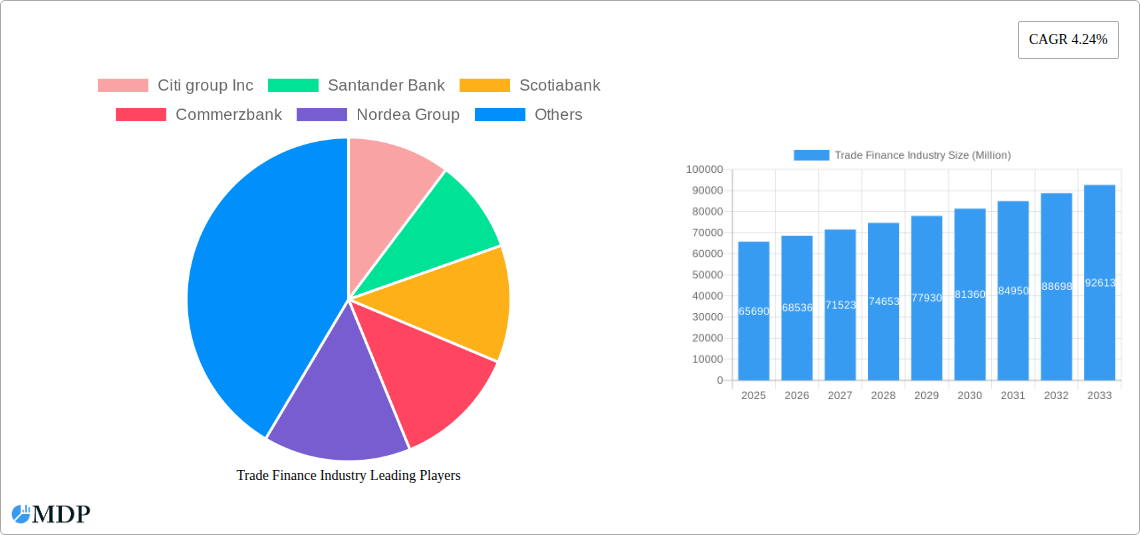
Trade Finance Industry Market Size (In Billion)
The consistent CAGR suggests a steady increase in market value throughout the forecast period. While precise regional breakdowns are unavailable, the presence of numerous international banks suggests broad geographic distribution, likely with stronger representation in established financial hubs. Future growth will depend on successfully mitigating risks associated with global economic volatility and adapting to evolving regulatory landscapes. The incorporation of innovative financial technologies promises to streamline processes, improve efficiency, and unlock new opportunities within the trade finance industry, ultimately contributing to sustained market expansion. Banks are continuously investing in technology and strategic partnerships to enhance their offerings and maintain a competitive edge in this dynamic sector.
Trade Finance Industry Company Market Share
Trade Finance Industry Market Report: 2019-2033
This comprehensive report provides an in-depth analysis of the global trade finance industry, projecting a market valuation of USD xx Million by 2033. Leveraging data from 2019-2024 (Historical Period), with 2025 as the Base and Estimated Year, this report forecasts market trends until 2033 (Forecast Period). Key players like Citigroup Inc, Santander Bank, Scotiabank, Commerzbank, Nordea Group, Unicredit, Standard Chartered Bank, Arab Bank, Societe Generale, Rand Merchant Bank, Rabobank, China Construction Bank, and BNP Paribas are analyzed, alongside emerging industry dynamics. This report is essential for investors, financial institutions, and industry stakeholders seeking to navigate the evolving landscape of global trade finance.
Trade Finance Industry Market Dynamics & Concentration
The global trade finance market exhibits moderate concentration, with a few large multinational banks holding significant market share. While precise market share data for each player is proprietary information and not publicly available for this report, we estimate that the top 10 players collectively control approximately 60% of the market in 2025, with a projected xx% CAGR from 2025 to 2033. Market dynamics are shaped by several key factors:
- Innovation Drivers: Fintech advancements, blockchain technology, and AI-driven solutions are transforming trade finance operations, enhancing efficiency and security.
- Regulatory Frameworks: Stringent regulatory compliance requirements, particularly concerning anti-money laundering (AML) and know-your-customer (KYC) regulations, impact operational costs and market entry barriers. Variations in regulatory frameworks across different jurisdictions also add complexity.
- Product Substitutes: The emergence of alternative financing options, such as peer-to-peer lending platforms, poses a competitive threat to traditional trade finance institutions.
- End-User Trends: The growing demand for sustainable and ethical trade practices influences product development and market strategy. Businesses increasingly seek financing options aligned with ESG (Environmental, Social, and Governance) principles.
- M&A Activities: The trade finance landscape has witnessed a moderate level of mergers and acquisitions (M&A) activity in recent years, with an estimated xx M&A deals closed between 2019 and 2024. This consolidation trend reflects the pursuit of scale, enhanced market reach, and technological integration.
Trade Finance Industry Industry Trends & Analysis
The global trade finance market is projected to experience substantial growth, driven by factors such as increasing global trade volumes, the expansion of e-commerce, and the rising adoption of digital trade finance solutions. The market witnessed a CAGR of xx% during the historical period (2019-2024) and is forecast to maintain a robust CAGR of xx% during the forecast period (2025-2033). This growth is propelled by:
- Market Growth Drivers: The increasing volume of cross-border transactions, particularly within emerging economies, fuels the demand for trade finance services. The rising adoption of digital technologies also contributes to efficiency gains and expanded market reach.
- Technological Disruptions: Blockchain technology holds immense potential for streamlining trade finance processes, reducing costs, and enhancing transparency and security. AI-powered solutions offer opportunities for improved risk management and fraud detection.
- Consumer Preferences: Businesses are increasingly seeking customized trade finance solutions tailored to their specific needs and industry requirements. Sustainability and ethical sourcing are also gaining traction as crucial considerations.
- Competitive Dynamics: The market is characterized by intense competition among traditional banks and emerging fintech players. This competition leads to innovations in product offerings and pricing strategies, benefiting end-users. Market penetration of digital solutions is expected to reach xx% by 2033.
Leading Markets & Segments in Trade Finance Industry
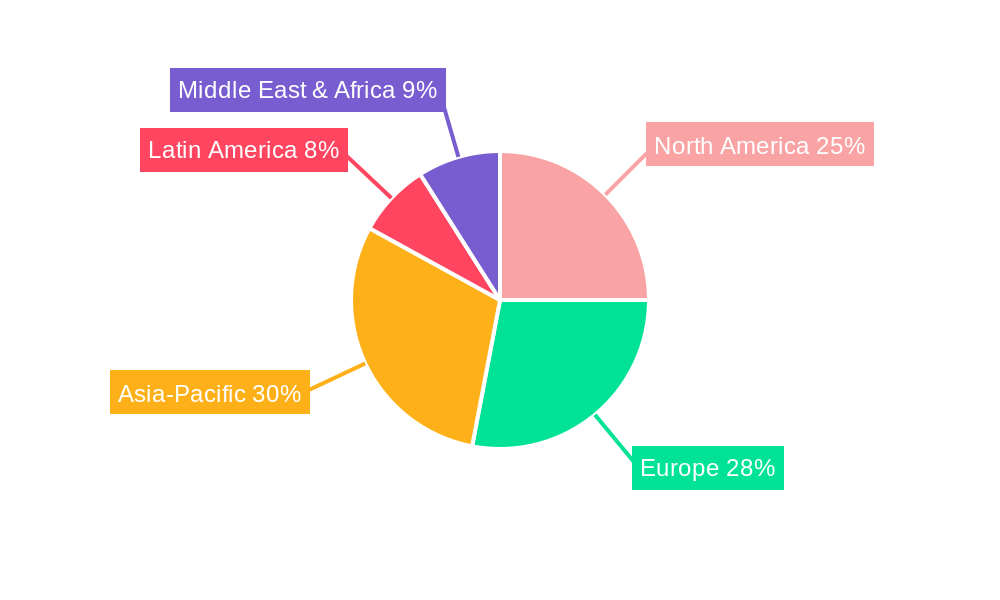
While precise market segmentation data is unavailable for this report, the Asia-Pacific region is predicted to be the dominant market for trade finance over the forecast period (2025-2033), fueled by robust economic growth, expanding intra-regional trade, and the increasing adoption of digital technologies.
- Key Drivers in Asia-Pacific:
- Rapid economic growth in several countries.
- Strong government support for trade and infrastructure development.
- Rising middle class and increasing consumer spending.
- Growing e-commerce penetration.
The dominance of the Asia-Pacific region stems from its high trade volume, coupled with the increasing penetration of digital trade finance solutions and favorable government policies promoting trade facilitation. While North America and Europe maintain significant market shares, the Asia-Pacific region's higher growth trajectory is expected to solidify its leading position throughout the forecast period.
Trade Finance Industry Product Developments
Recent product innovations in trade finance focus on digitalization, automation, and sustainability. Blockchain-based platforms are gaining traction, offering enhanced security and transparency in letter of credit and other trade finance transactions. The integration of AI and machine learning enables improved risk assessment, fraud detection, and automated document processing. These advancements cater to the growing demand for efficient, secure, and sustainable trade finance solutions. The market is also seeing an increase in the availability of specialized products catering to specific industries (e.g., green trade finance).
Key Drivers of Trade Finance Industry Growth
The growth of the trade finance industry is fueled by several interconnected factors:
- Technological Advancements: The adoption of blockchain, AI, and other technologies is streamlining processes, enhancing security, and improving efficiency.
- Global Trade Expansion: Increasing cross-border trade, driven by globalization and e-commerce, creates heightened demand for trade finance services.
- Supportive Regulatory Environment: Governments worldwide are increasingly implementing policies to facilitate trade and promote the development of efficient trade finance ecosystems. For example, initiatives to improve infrastructure and reduce bureaucratic hurdles contribute significantly to market growth.
Challenges in the Trade Finance Industry Market
The industry faces several challenges, including:
- Regulatory Complexity: The diverse and often evolving regulatory landscape across different jurisdictions adds complexity and increases compliance costs for trade finance providers.
- Supply Chain Disruptions: Global supply chain vulnerabilities, as exemplified by recent geopolitical events, highlight the need for robust risk management strategies within the trade finance sector. Disruptions lead to increased credit risk and delays in payments.
- Cybersecurity Threats: The increasing reliance on digital platforms makes trade finance providers vulnerable to cyberattacks, necessitating robust security measures and investments in cybersecurity infrastructure.
Emerging Opportunities in Trade Finance Industry
Significant opportunities exist for growth through:
- Technological Innovation: Further adoption of blockchain, AI, and other technologies can drive efficiency gains, reduce costs, and improve the customer experience.
- Strategic Partnerships: Collaborations between traditional banks and fintech companies can leverage the strengths of both, creating innovative and comprehensive trade finance solutions.
- Market Expansion: Targeting underserved markets, particularly in developing economies, offers substantial growth potential.
Leading Players in the Trade Finance Industry Sector
Key Milestones in Trade Finance Industry Industry
- September 2023: Standard Chartered Bank launched a sustainable trade loan offering for financial institutions, supporting liquidity for sustainable development projects.
- April 2022: The Asian Development Bank partnered with Axis Bank Limited, committing up to USD 150 Million to expand supply chain financing for small and medium-sized businesses.
Strategic Outlook for Trade Finance Industry Market
The future of the trade finance industry is bright, characterized by continued digital transformation, strategic partnerships, and a focus on sustainability. The market's growth will be fueled by technological innovation, expansion into emerging markets, and a heightened focus on meeting the evolving needs of businesses in a globally interconnected world. Opportunities abound for players who can effectively leverage technology, adapt to regulatory changes, and build strong relationships with clients.
Trade Finance Industry Segmentation
-
1. Service Provider
- 1.1. Banks
- 1.2. Trade Finance Companies
- 1.3. Insurance Companies
Trade Finance Industry Segmentation By Geography
-
1. North America
- 1.1. US
- 1.2. Canada
- 1.3. Mexico
- 1.4. Rest of North America
-
2. Europe
- 2.1. Germany
- 2.2. UK
- 2.3. France
- 2.4. Russia
- 2.5. Spain
- 2.6. Rest of Europe
-
3. Asia Pacific
- 3.1. India
- 3.2. China
- 3.3. Japan
- 3.4. Rest of Asia Pacific
-
4. South America
- 4.1. Brazil
- 4.2. Argentina
-
5. Middle East And Africa
- 5.1. UAE
- 5.2. Saudi Arabia
- 5.3. Rest of Middle East And Africa
Trade Finance Industry Regional Market Share
Geographic Coverage of Trade Finance Industry
Trade Finance Industry REPORT HIGHLIGHTS
| Aspects | Details |
|---|---|
| Study Period | 2020-2034 |
| Base Year | 2025 |
| Estimated Year | 2026 |
| Forecast Period | 2026-2034 |
| Historical Period | 2020-2025 |
| Growth Rate | CAGR of 4.24% from 2020-2034 |
| Segmentation |
|
Table of Contents
- 1. Introduction
- 1.1. Research Scope
- 1.2. Market Segmentation
- 1.3. Research Objective
- 1.4. Definitions and Assumptions
- 2. Executive Summary
- 2.1. Market Snapshot
- 3. Market Dynamics
- 3.1. Market Drivers
- 3.2. Market Restrains
- 3.3. Market Trends
- 3.4. Market Opportunities
- 4. Market Factor Analysis
- 4.1. Porters Five Forces
- 4.1.1. Bargaining Power of Suppliers
- 4.1.2. Bargaining Power of Buyers
- 4.1.3. Threat of New Entrants
- 4.1.4. Threat of Substitutes
- 4.1.5. Competitive Rivalry
- 4.2. PESTEL analysis
- 4.3. BCG Analysis
- 4.3.1. Stars (High Growth, High Market Share)
- 4.3.2. Cash Cows (Low Growth, High Market Share)
- 4.3.3. Question Mark (High Growth, Low Market Share)
- 4.3.4. Dogs (Low Growth, Low Market Share)
- 4.4. Ansoff Matrix Analysis
- 4.5. Supply Chain Analysis
- 4.6. Regulatory Landscape
- 4.7. Current Market Potential and Opportunity Assessment (TAM–SAM–SOM Framework)
- 4.8. MDP Analyst Note
- 4.1. Porters Five Forces
- 5. Market Analysis, Insights and Forecast 2021-2033
- 5.1. Market Analysis, Insights and Forecast - by Service Provider
- 5.1.1. Banks
- 5.1.2. Trade Finance Companies
- 5.1.3. Insurance Companies
- 5.2. Market Analysis, Insights and Forecast - by Region
- 5.2.1. North America
- 5.2.2. Europe
- 5.2.3. Asia Pacific
- 5.2.4. South America
- 5.2.5. Middle East And Africa
- 5.1. Market Analysis, Insights and Forecast - by Service Provider
- 6. Global Trade Finance Industry Analysis, Insights and Forecast, 2021-2033
- 6.1. Market Analysis, Insights and Forecast - by Service Provider
- 6.1.1. Banks
- 6.1.2. Trade Finance Companies
- 6.1.3. Insurance Companies
- 6.1. Market Analysis, Insights and Forecast - by Service Provider
- 7. North America Trade Finance Industry Analysis, Insights and Forecast, 2020-2032
- 7.1. Market Analysis, Insights and Forecast - by Service Provider
- 7.1.1. Banks
- 7.1.2. Trade Finance Companies
- 7.1.3. Insurance Companies
- 7.1. Market Analysis, Insights and Forecast - by Service Provider
- 8. Europe Trade Finance Industry Analysis, Insights and Forecast, 2020-2032
- 8.1. Market Analysis, Insights and Forecast - by Service Provider
- 8.1.1. Banks
- 8.1.2. Trade Finance Companies
- 8.1.3. Insurance Companies
- 8.1. Market Analysis, Insights and Forecast - by Service Provider
- 9. Asia Pacific Trade Finance Industry Analysis, Insights and Forecast, 2020-2032
- 9.1. Market Analysis, Insights and Forecast - by Service Provider
- 9.1.1. Banks
- 9.1.2. Trade Finance Companies
- 9.1.3. Insurance Companies
- 9.1. Market Analysis, Insights and Forecast - by Service Provider
- 10. South America Trade Finance Industry Analysis, Insights and Forecast, 2020-2032
- 10.1. Market Analysis, Insights and Forecast - by Service Provider
- 10.1.1. Banks
- 10.1.2. Trade Finance Companies
- 10.1.3. Insurance Companies
- 10.1. Market Analysis, Insights and Forecast - by Service Provider
- 11. Middle East And Africa Trade Finance Industry Analysis, Insights and Forecast, 2020-2032
- 11.1. Market Analysis, Insights and Forecast - by Service Provider
- 11.1.1. Banks
- 11.1.2. Trade Finance Companies
- 11.1.3. Insurance Companies
- 11.1. Market Analysis, Insights and Forecast - by Service Provider
- 12. Competitive Analysis
- 12.1. Company Profiles
- 12.1.1 Citi group Inc
- 12.1.1.1. Company Overview
- 12.1.1.2. Products
- 12.1.1.3. Company Financials
- 12.1.1.4. SWOT Analysis
- 12.1.2 Santander Bank
- 12.1.2.1. Company Overview
- 12.1.2.2. Products
- 12.1.2.3. Company Financials
- 12.1.2.4. SWOT Analysis
- 12.1.3 Scotiabank
- 12.1.3.1. Company Overview
- 12.1.3.2. Products
- 12.1.3.3. Company Financials
- 12.1.3.4. SWOT Analysis
- 12.1.4 Commerzbank
- 12.1.4.1. Company Overview
- 12.1.4.2. Products
- 12.1.4.3. Company Financials
- 12.1.4.4. SWOT Analysis
- 12.1.5 Nordea Group
- 12.1.5.1. Company Overview
- 12.1.5.2. Products
- 12.1.5.3. Company Financials
- 12.1.5.4. SWOT Analysis
- 12.1.6 Unicredit
- 12.1.6.1. Company Overview
- 12.1.6.2. Products
- 12.1.6.3. Company Financials
- 12.1.6.4. SWOT Analysis
- 12.1.7 Standard Chartered Bank
- 12.1.7.1. Company Overview
- 12.1.7.2. Products
- 12.1.7.3. Company Financials
- 12.1.7.4. SWOT Analysis
- 12.1.8 Arab Bank
- 12.1.8.1. Company Overview
- 12.1.8.2. Products
- 12.1.8.3. Company Financials
- 12.1.8.4. SWOT Analysis
- 12.1.9 Societe Generale
- 12.1.9.1. Company Overview
- 12.1.9.2. Products
- 12.1.9.3. Company Financials
- 12.1.9.4. SWOT Analysis
- 12.1.10 Rand Merchant Bank
- 12.1.10.1. Company Overview
- 12.1.10.2. Products
- 12.1.10.3. Company Financials
- 12.1.10.4. SWOT Analysis
- 12.1.11 Rabobank
- 12.1.11.1. Company Overview
- 12.1.11.2. Products
- 12.1.11.3. Company Financials
- 12.1.11.4. SWOT Analysis
- 12.1.12 China Construction Bank
- 12.1.12.1. Company Overview
- 12.1.12.2. Products
- 12.1.12.3. Company Financials
- 12.1.12.4. SWOT Analysis
- 12.1.13 BNP Paribas**List Not Exhaustive
- 12.1.13.1. Company Overview
- 12.1.13.2. Products
- 12.1.13.3. Company Financials
- 12.1.13.4. SWOT Analysis
- 12.1.1 Citi group Inc
- 12.2. Market Entropy
- 12.2.1 Company's Key Areas Served
- 12.2.2 Recent Developments
- 12.3. Company Market Share Analysis 2025
- 12.3.1 Top 5 Companies Market Share Analysis
- 12.3.2 Top 3 Companies Market Share Analysis
- 12.4. List of Potential Customers
- 13. Research Methodology
List of Figures
- Figure 1: Global Trade Finance Industry Revenue Breakdown (Million, %) by Region 2025 & 2033
- Figure 2: Global Trade Finance Industry Volume Breakdown (Billion, %) by Region 2025 & 2033
- Figure 3: North America Trade Finance Industry Revenue (Million), by Service Provider 2025 & 2033
- Figure 4: North America Trade Finance Industry Volume (Billion), by Service Provider 2025 & 2033
- Figure 5: North America Trade Finance Industry Revenue Share (%), by Service Provider 2025 & 2033
- Figure 6: North America Trade Finance Industry Volume Share (%), by Service Provider 2025 & 2033
- Figure 7: North America Trade Finance Industry Revenue (Million), by Country 2025 & 2033
- Figure 8: North America Trade Finance Industry Volume (Billion), by Country 2025 & 2033
- Figure 9: North America Trade Finance Industry Revenue Share (%), by Country 2025 & 2033
- Figure 10: North America Trade Finance Industry Volume Share (%), by Country 2025 & 2033
- Figure 11: Europe Trade Finance Industry Revenue (Million), by Service Provider 2025 & 2033
- Figure 12: Europe Trade Finance Industry Volume (Billion), by Service Provider 2025 & 2033
- Figure 13: Europe Trade Finance Industry Revenue Share (%), by Service Provider 2025 & 2033
- Figure 14: Europe Trade Finance Industry Volume Share (%), by Service Provider 2025 & 2033
- Figure 15: Europe Trade Finance Industry Revenue (Million), by Country 2025 & 2033
- Figure 16: Europe Trade Finance Industry Volume (Billion), by Country 2025 & 2033
- Figure 17: Europe Trade Finance Industry Revenue Share (%), by Country 2025 & 2033
- Figure 18: Europe Trade Finance Industry Volume Share (%), by Country 2025 & 2033
- Figure 19: Asia Pacific Trade Finance Industry Revenue (Million), by Service Provider 2025 & 2033
- Figure 20: Asia Pacific Trade Finance Industry Volume (Billion), by Service Provider 2025 & 2033
- Figure 21: Asia Pacific Trade Finance Industry Revenue Share (%), by Service Provider 2025 & 2033
- Figure 22: Asia Pacific Trade Finance Industry Volume Share (%), by Service Provider 2025 & 2033
- Figure 23: Asia Pacific Trade Finance Industry Revenue (Million), by Country 2025 & 2033
- Figure 24: Asia Pacific Trade Finance Industry Volume (Billion), by Country 2025 & 2033
- Figure 25: Asia Pacific Trade Finance Industry Revenue Share (%), by Country 2025 & 2033
- Figure 26: Asia Pacific Trade Finance Industry Volume Share (%), by Country 2025 & 2033
- Figure 27: South America Trade Finance Industry Revenue (Million), by Service Provider 2025 & 2033
- Figure 28: South America Trade Finance Industry Volume (Billion), by Service Provider 2025 & 2033
- Figure 29: South America Trade Finance Industry Revenue Share (%), by Service Provider 2025 & 2033
- Figure 30: South America Trade Finance Industry Volume Share (%), by Service Provider 2025 & 2033
- Figure 31: South America Trade Finance Industry Revenue (Million), by Country 2025 & 2033
- Figure 32: South America Trade Finance Industry Volume (Billion), by Country 2025 & 2033
- Figure 33: South America Trade Finance Industry Revenue Share (%), by Country 2025 & 2033
- Figure 34: South America Trade Finance Industry Volume Share (%), by Country 2025 & 2033
- Figure 35: Middle East And Africa Trade Finance Industry Revenue (Million), by Service Provider 2025 & 2033
- Figure 36: Middle East And Africa Trade Finance Industry Volume (Billion), by Service Provider 2025 & 2033
- Figure 37: Middle East And Africa Trade Finance Industry Revenue Share (%), by Service Provider 2025 & 2033
- Figure 38: Middle East And Africa Trade Finance Industry Volume Share (%), by Service Provider 2025 & 2033
- Figure 39: Middle East And Africa Trade Finance Industry Revenue (Million), by Country 2025 & 2033
- Figure 40: Middle East And Africa Trade Finance Industry Volume (Billion), by Country 2025 & 2033
- Figure 41: Middle East And Africa Trade Finance Industry Revenue Share (%), by Country 2025 & 2033
- Figure 42: Middle East And Africa Trade Finance Industry Volume Share (%), by Country 2025 & 2033
List of Tables
- Table 1: Global Trade Finance Industry Revenue Million Forecast, by Service Provider 2020 & 2033
- Table 2: Global Trade Finance Industry Volume Billion Forecast, by Service Provider 2020 & 2033
- Table 3: Global Trade Finance Industry Revenue Million Forecast, by Region 2020 & 2033
- Table 4: Global Trade Finance Industry Volume Billion Forecast, by Region 2020 & 2033
- Table 5: Global Trade Finance Industry Revenue Million Forecast, by Service Provider 2020 & 2033
- Table 6: Global Trade Finance Industry Volume Billion Forecast, by Service Provider 2020 & 2033
- Table 7: Global Trade Finance Industry Revenue Million Forecast, by Country 2020 & 2033
- Table 8: Global Trade Finance Industry Volume Billion Forecast, by Country 2020 & 2033
- Table 9: US Trade Finance Industry Revenue (Million) Forecast, by Application 2020 & 2033
- Table 10: US Trade Finance Industry Volume (Billion) Forecast, by Application 2020 & 2033
- Table 11: Canada Trade Finance Industry Revenue (Million) Forecast, by Application 2020 & 2033
- Table 12: Canada Trade Finance Industry Volume (Billion) Forecast, by Application 2020 & 2033
- Table 13: Mexico Trade Finance Industry Revenue (Million) Forecast, by Application 2020 & 2033
- Table 14: Mexico Trade Finance Industry Volume (Billion) Forecast, by Application 2020 & 2033
- Table 15: Rest of North America Trade Finance Industry Revenue (Million) Forecast, by Application 2020 & 2033
- Table 16: Rest of North America Trade Finance Industry Volume (Billion) Forecast, by Application 2020 & 2033
- Table 17: Global Trade Finance Industry Revenue Million Forecast, by Service Provider 2020 & 2033
- Table 18: Global Trade Finance Industry Volume Billion Forecast, by Service Provider 2020 & 2033
- Table 19: Global Trade Finance Industry Revenue Million Forecast, by Country 2020 & 2033
- Table 20: Global Trade Finance Industry Volume Billion Forecast, by Country 2020 & 2033
- Table 21: Germany Trade Finance Industry Revenue (Million) Forecast, by Application 2020 & 2033
- Table 22: Germany Trade Finance Industry Volume (Billion) Forecast, by Application 2020 & 2033
- Table 23: UK Trade Finance Industry Revenue (Million) Forecast, by Application 2020 & 2033
- Table 24: UK Trade Finance Industry Volume (Billion) Forecast, by Application 2020 & 2033
- Table 25: France Trade Finance Industry Revenue (Million) Forecast, by Application 2020 & 2033
- Table 26: France Trade Finance Industry Volume (Billion) Forecast, by Application 2020 & 2033
- Table 27: Russia Trade Finance Industry Revenue (Million) Forecast, by Application 2020 & 2033
- Table 28: Russia Trade Finance Industry Volume (Billion) Forecast, by Application 2020 & 2033
- Table 29: Spain Trade Finance Industry Revenue (Million) Forecast, by Application 2020 & 2033
- Table 30: Spain Trade Finance Industry Volume (Billion) Forecast, by Application 2020 & 2033
- Table 31: Rest of Europe Trade Finance Industry Revenue (Million) Forecast, by Application 2020 & 2033
- Table 32: Rest of Europe Trade Finance Industry Volume (Billion) Forecast, by Application 2020 & 2033
- Table 33: Global Trade Finance Industry Revenue Million Forecast, by Service Provider 2020 & 2033
- Table 34: Global Trade Finance Industry Volume Billion Forecast, by Service Provider 2020 & 2033
- Table 35: Global Trade Finance Industry Revenue Million Forecast, by Country 2020 & 2033
- Table 36: Global Trade Finance Industry Volume Billion Forecast, by Country 2020 & 2033
- Table 37: India Trade Finance Industry Revenue (Million) Forecast, by Application 2020 & 2033
- Table 38: India Trade Finance Industry Volume (Billion) Forecast, by Application 2020 & 2033
- Table 39: China Trade Finance Industry Revenue (Million) Forecast, by Application 2020 & 2033
- Table 40: China Trade Finance Industry Volume (Billion) Forecast, by Application 2020 & 2033
- Table 41: Japan Trade Finance Industry Revenue (Million) Forecast, by Application 2020 & 2033
- Table 42: Japan Trade Finance Industry Volume (Billion) Forecast, by Application 2020 & 2033
- Table 43: Rest of Asia Pacific Trade Finance Industry Revenue (Million) Forecast, by Application 2020 & 2033
- Table 44: Rest of Asia Pacific Trade Finance Industry Volume (Billion) Forecast, by Application 2020 & 2033
- Table 45: Global Trade Finance Industry Revenue Million Forecast, by Service Provider 2020 & 2033
- Table 46: Global Trade Finance Industry Volume Billion Forecast, by Service Provider 2020 & 2033
- Table 47: Global Trade Finance Industry Revenue Million Forecast, by Country 2020 & 2033
- Table 48: Global Trade Finance Industry Volume Billion Forecast, by Country 2020 & 2033
- Table 49: Brazil Trade Finance Industry Revenue (Million) Forecast, by Application 2020 & 2033
- Table 50: Brazil Trade Finance Industry Volume (Billion) Forecast, by Application 2020 & 2033
- Table 51: Argentina Trade Finance Industry Revenue (Million) Forecast, by Application 2020 & 2033
- Table 52: Argentina Trade Finance Industry Volume (Billion) Forecast, by Application 2020 & 2033
- Table 53: Global Trade Finance Industry Revenue Million Forecast, by Service Provider 2020 & 2033
- Table 54: Global Trade Finance Industry Volume Billion Forecast, by Service Provider 2020 & 2033
- Table 55: Global Trade Finance Industry Revenue Million Forecast, by Country 2020 & 2033
- Table 56: Global Trade Finance Industry Volume Billion Forecast, by Country 2020 & 2033
- Table 57: UAE Trade Finance Industry Revenue (Million) Forecast, by Application 2020 & 2033
- Table 58: UAE Trade Finance Industry Volume (Billion) Forecast, by Application 2020 & 2033
- Table 59: Saudi Arabia Trade Finance Industry Revenue (Million) Forecast, by Application 2020 & 2033
- Table 60: Saudi Arabia Trade Finance Industry Volume (Billion) Forecast, by Application 2020 & 2033
- Table 61: Rest of Middle East And Africa Trade Finance Industry Revenue (Million) Forecast, by Application 2020 & 2033
- Table 62: Rest of Middle East And Africa Trade Finance Industry Volume (Billion) Forecast, by Application 2020 & 2033
Frequently Asked Questions
1. What is the projected Compound Annual Growth Rate (CAGR) of the Trade Finance Industry?
The projected CAGR is approximately 4.24%.
2. Which companies are prominent players in the Trade Finance Industry?
Key companies in the market include Citi group Inc, Santander Bank, Scotiabank, Commerzbank, Nordea Group, Unicredit, Standard Chartered Bank, Arab Bank, Societe Generale, Rand Merchant Bank, Rabobank, China Construction Bank, BNP Paribas**List Not Exhaustive.
3. What are the main segments of the Trade Finance Industry?
The market segments include Service Provider.
4. Can you provide details about the market size?
The market size is estimated to be USD 65.69 Million as of 2022.
5. What are some drivers contributing to market growth?
Rise In Global Trade Drives The Market; Increasing Investments And Innovations In Fintech Drives The Market.
6. What are the notable trends driving market growth?
Globalization And Increased International Trade Drives the Market.
7. Are there any restraints impacting market growth?
Rise In Global Trade Drives The Market; Increasing Investments And Innovations In Fintech Drives The Market.
8. Can you provide examples of recent developments in the market?
September 2023 - Standard Chartered Bank, a multinational bank, launched a sustainable trade loan offering for financial institutions. It will assist financial institutions in providing liquidity associated with sustainable development in the most needed areas.
9. What pricing options are available for accessing the report?
Pricing options include single-user, multi-user, and enterprise licenses priced at USD 4750, USD 5250, and USD 8750 respectively.
10. Is the market size provided in terms of value or volume?
The market size is provided in terms of value, measured in Million and volume, measured in Billion.
11. Are there any specific market keywords associated with the report?
Yes, the market keyword associated with the report is "Trade Finance Industry," which aids in identifying and referencing the specific market segment covered.
12. How do I determine which pricing option suits my needs best?
The pricing options vary based on user requirements and access needs. Individual users may opt for single-user licenses, while businesses requiring broader access may choose multi-user or enterprise licenses for cost-effective access to the report.
13. Are there any additional resources or data provided in the Trade Finance Industry report?
While the report offers comprehensive insights, it's advisable to review the specific contents or supplementary materials provided to ascertain if additional resources or data are available.
14. How can I stay updated on further developments or reports in the Trade Finance Industry?
To stay informed about further developments, trends, and reports in the Trade Finance Industry, consider subscribing to industry newsletters, following relevant companies and organizations, or regularly checking reputable industry news sources and publications.
Methodology
Step 1 - Identification of Relevant Samples Size from Population Database


Step 2 - Approaches for Defining Global Market Size (Value, Volume* & Price*)

Note*: In applicable scenarios
Step 3 - Data Sources
Primary Research
- Web Analytics
- Survey Reports
- Research Institute
- Latest Research Reports
- Opinion Leaders
Secondary Research
- Annual Reports
- White Paper
- Latest Press Release
- Industry Association
- Paid Database
- Investor Presentations

Step 4 - Data Triangulation
Involves using different sources of information in order to increase the validity of a study
These sources are likely to be stakeholders in a program - participants, other researchers, program staff, other community members, and so on.
Then we put all data in single framework & apply various statistical tools to find out the dynamic on the market.
During the analysis stage, feedback from the stakeholder groups would be compared to determine areas of agreement as well as areas of divergence