

Key Insights
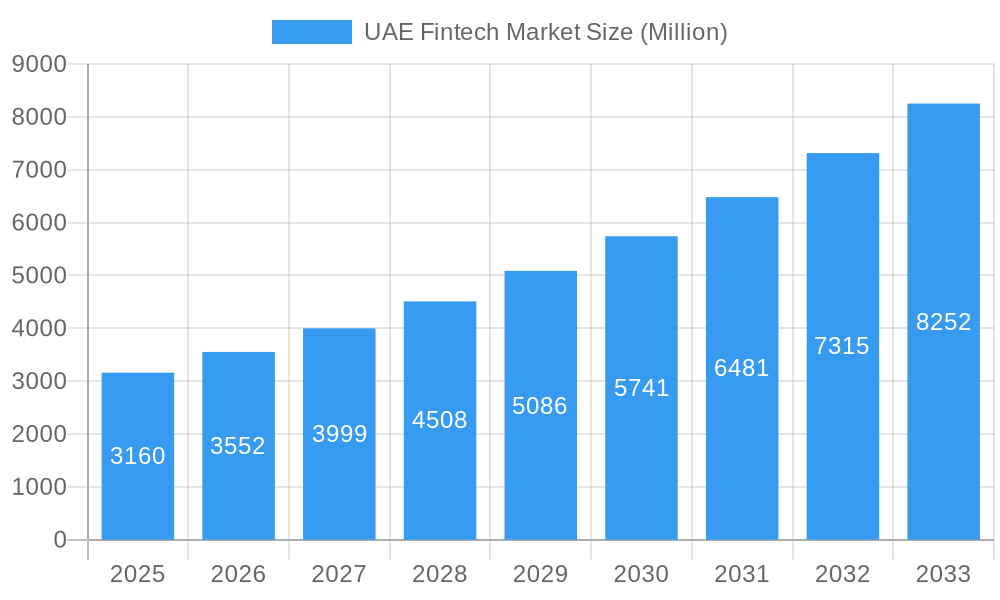
The UAE Fintech market, valued at $3.16 billion in 2025, is experiencing robust growth, projected to expand at a Compound Annual Growth Rate (CAGR) of 12.56% from 2025 to 2033. This surge is fueled by several key drivers. The UAE's forward-thinking regulatory environment, coupled with a high concentration of tech-savvy consumers and a thriving digital economy, creates an ideal breeding ground for innovation. Government initiatives promoting digital transformation and financial inclusion further accelerate adoption. Increased mobile penetration and the rising popularity of mobile payment solutions are also significant contributors. Furthermore, the increasing demand for convenient and efficient financial services, particularly among younger demographics, drives the growth of diverse fintech solutions like digital lending, investment platforms, and payment gateways. The market is witnessing a rise in the adoption of open banking and AI-powered solutions, enhancing personalization and efficiency.
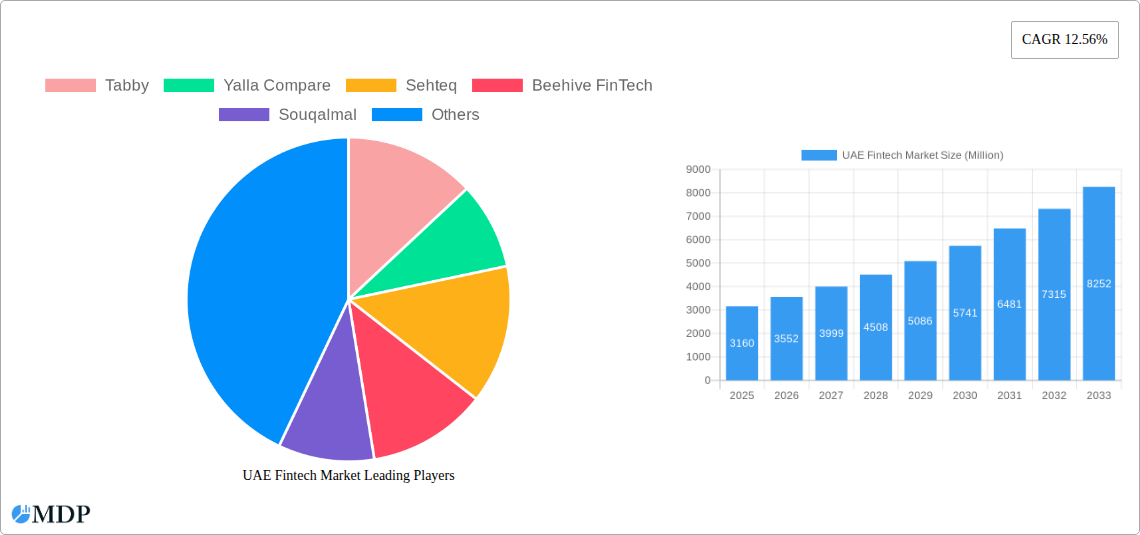
UAE Fintech Market Market Size (In Billion)
Competitive forces are shaping the landscape. Established players like Tabby, Yalla Compare, and Sarwa are competing with emerging startups like Beehive Fintech and Mamo Pay. This competitive environment is fostering innovation and driving down costs, benefiting consumers. However, challenges remain. Data security and privacy concerns, coupled with the need for robust cybersecurity infrastructure, pose ongoing hurdles. Regulatory compliance and the need to adapt to evolving regulatory frameworks also demand continuous attention. Despite these challenges, the long-term outlook for the UAE Fintech market remains highly positive, driven by continuous technological advancements and supportive government policies. The market is expected to significantly expand its reach within the next decade, encompassing a wider range of financial services and reaching a broader segment of the population.
UAE Fintech Market Company Market Share
UAE Fintech Market: A Comprehensive Report (2019-2033)
This in-depth report provides a comprehensive analysis of the UAE Fintech market, covering market dynamics, industry trends, leading players, and future growth prospects. With a study period spanning 2019-2033, a base year of 2025, and a forecast period of 2025-2033, this report offers invaluable insights for industry stakeholders, investors, and businesses seeking to navigate this rapidly evolving landscape. The report leverages extensive data analysis to predict a market size of xx Million in 2025, and xx Million in 2033, revealing a significant CAGR.
UAE Fintech Market Market Dynamics & Concentration
The UAE Fintech market exhibits a dynamic interplay of concentration, innovation, regulation, and competitive pressures. Market concentration is moderate, with several key players holding significant market share, while numerous smaller fintechs are constantly emerging. Innovation is a primary driver, fueled by technological advancements and a supportive regulatory environment. The regulatory framework, while evolving, generally fosters innovation while ensuring consumer protection. Product substitutes, such as traditional banking services, pose some competition, though Fintech solutions often offer superior convenience and efficiency. End-user trends reveal a strong preference for mobile-first solutions and personalized financial services. M&A activity remains robust, with xx M&A deals recorded in the historical period (2019-2024), indicating a consolidated market.
- Market Share: Tabby holds an estimated xx% market share, followed by Yalla Compare with xx%, and others.
- M&A Deal Count: xx deals closed in 2019-2024, reflecting significant consolidation.
- Innovation Drivers: Government initiatives, technological advancements (AI, blockchain), and increasing smartphone penetration.
- Regulatory Framework: The Central Bank of the UAE's supportive yet cautious approach promotes innovation while managing risk.
UAE Fintech Market Industry Trends & Analysis
The UAE Fintech market is experiencing exponential growth, driven by several key factors. Technological disruptions, such as the rise of mobile payments and AI-powered solutions, are transforming the financial landscape. Consumers increasingly favor convenient and personalized financial services, fuelling the adoption of Fintech solutions. The competitive dynamics are intense, with both established players and new entrants vying for market share, resulting in continuous innovation and improved service offerings. Market penetration is steadily increasing, with xx% of the population utilizing at least one Fintech service in 2024, projected to reach xx% by 2033.
The projected CAGR for the forecast period (2025-2033) is xx%. This growth is further fueled by rising digital literacy, increasing smartphone penetration, and government support for digital transformation.
Leading Markets & Segments in UAE Fintech Market
The UAE's Fintech market demonstrates broad strength across various segments. However, the payments segment currently holds the largest market share due to high mobile penetration and consumer preference for digital payment methods.
- Key Drivers of Payments Segment Dominance:
- High smartphone penetration.
- Government initiatives promoting cashless transactions.
- Robust digital infrastructure.
- Increasing adoption of mobile wallets and online payment gateways.
Detailed analysis reveals that this dominance is likely to continue, though other segments like Insurtech and lending are poised for significant growth in the coming years. The strong economic climate, supported by government investments in infrastructure and a business-friendly environment, is also a major contributor to the Fintech sector’s success.
UAE Fintech Market Product Developments
Recent product innovations in the UAE Fintech market emphasize seamless user experiences and personalized financial management tools. New payment solutions integrate AI and machine learning for fraud prevention and risk assessment. Lending platforms offer customized loan products tailored to individual needs, and wealth management platforms are integrating robo-advisory services. These advancements are enhancing market fit and increasing competitive advantages.
Key Drivers of UAE Fintech Market Growth
The UAE Fintech market's growth is propelled by a convergence of factors. Technological advancements, such as AI, blockchain, and big data analytics, are enabling innovative financial solutions. The government's supportive regulatory environment fosters innovation and attracts investment. A thriving entrepreneurial ecosystem supports the development of new Fintech startups. Finally, a young and tech-savvy population readily adopts new technologies, accelerating market growth.
Challenges in the UAE Fintech Market Market
Despite its potential, the UAE Fintech market faces challenges. Stringent regulatory compliance can increase operational costs for smaller players. Cybersecurity threats pose significant risks, demanding robust security measures. Competition is fierce, with both domestic and international players vying for market share. Maintaining customer trust and addressing concerns around data privacy are also crucial considerations. These challenges are estimated to impact growth by approximately xx% annually.
Emerging Opportunities in UAE Fintech Market
The future of the UAE Fintech market holds significant opportunities. Technological breakthroughs, such as the wider adoption of Open Banking, are poised to disrupt traditional financial services. Strategic partnerships between Fintech firms and established financial institutions can create synergies and accelerate market penetration. Expansion into adjacent markets, such as the broader MENA region, offers significant growth potential.
Leading Players in the UAE Fintech Market Sector
- Tabby
- Yalla Compare
- Sehteq
- Beehive FinTech
- Souqalmal
- Sarwa
- Mamo Pay
- Channel VAS
- Zinna
- Now Money
- List Not Exhaustive
Key Milestones in UAE Fintech Market Industry
- January 2023: Tabby secures USD 58 Million in Series C funding, reaching a USD 660 Million valuation. This highlights investor confidence in the UAE Fintech market.
- August 2023: Tabby launches Tabby Shop, a comprehensive shopping app integrating over 500,000 products from 10,000+ brands, signifying a significant product innovation in the market.
Strategic Outlook for UAE Fintech Market Market
The UAE Fintech market is poised for continued expansion, driven by technological innovation, government support, and a growing consumer base. Strategic opportunities lie in leveraging AI and blockchain technologies, forging strategic partnerships, and expanding into new segments like Insurtech and RegTech. The market's long-term potential is substantial, promising high returns for investors and significant benefits for consumers.
UAE Fintech Market Segmentation
-
1. Service proposition
- 1.1. Money Transfer and Payments
- 1.2. Savings and Investments
- 1.3. Digital Lending & Lending Marketplaces
- 1.4. Online Insurance & Insurance Marketplaces
UAE Fintech Market Segmentation By Geography
-
1. North America
- 1.1. United States
- 1.2. Canada
- 1.3. Mexico
-
2. South America
- 2.1. Brazil
- 2.2. Argentina
- 2.3. Rest of South America
-
3. Europe
- 3.1. United Kingdom
- 3.2. Germany
- 3.3. France
- 3.4. Italy
- 3.5. Spain
- 3.6. Russia
- 3.7. Benelux
- 3.8. Nordics
- 3.9. Rest of Europe
-
4. Middle East & Africa
- 4.1. Turkey
- 4.2. Israel
- 4.3. GCC
- 4.4. North Africa
- 4.5. South Africa
- 4.6. Rest of Middle East & Africa
-
5. Asia Pacific
- 5.1. China
- 5.2. India
- 5.3. Japan
- 5.4. South Korea
- 5.5. ASEAN
- 5.6. Oceania
- 5.7. Rest of Asia Pacific
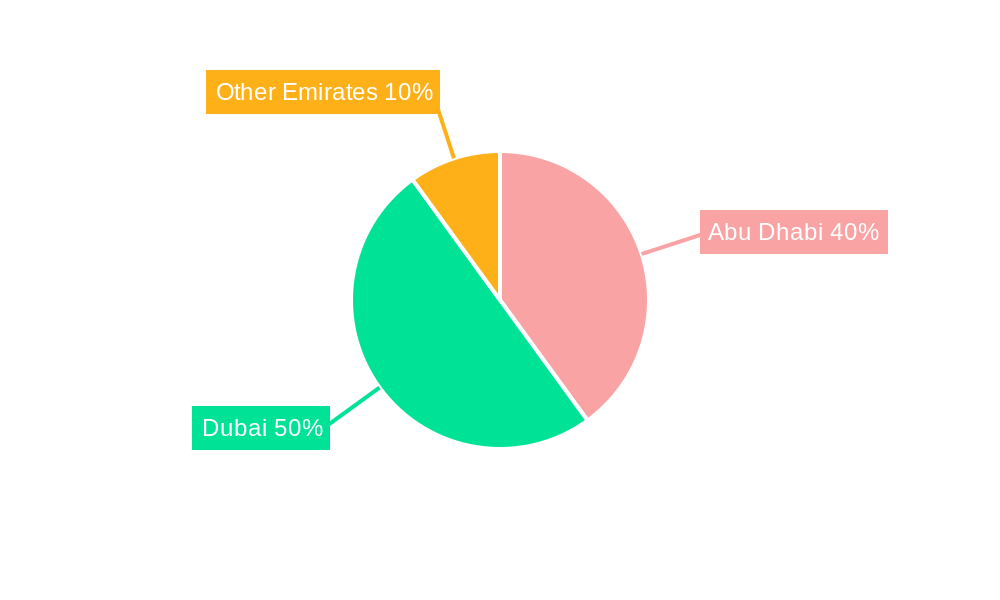
UAE Fintech Market Regional Market Share
Geographic Coverage of UAE Fintech Market
UAE Fintech Market REPORT HIGHLIGHTS
| Aspects | Details |
|---|---|
| Study Period | 2020-2034 |
| Base Year | 2025 |
| Estimated Year | 2026 |
| Forecast Period | 2026-2034 |
| Historical Period | 2020-2025 |
| Growth Rate | CAGR of 12.56% from 2020-2034 |
| Segmentation |
|
Table of Contents
- 1. Introduction
- 1.1. Research Scope
- 1.2. Market Segmentation
- 1.3. Research Objective
- 1.4. Definitions and Assumptions
- 2. Executive Summary
- 2.1. Market Snapshot
- 3. Market Dynamics
- 3.1. Market Drivers
- 3.2. Market Restrains
- 3.3. Market Trends
- 3.4. Market Opportunities
- 4. Market Factor Analysis
- 4.1. Porters Five Forces
- 4.1.1. Bargaining Power of Suppliers
- 4.1.2. Bargaining Power of Buyers
- 4.1.3. Threat of New Entrants
- 4.1.4. Threat of Substitutes
- 4.1.5. Competitive Rivalry
- 4.2. PESTEL analysis
- 4.3. BCG Analysis
- 4.3.1. Stars (High Growth, High Market Share)
- 4.3.2. Cash Cows (Low Growth, High Market Share)
- 4.3.3. Question Mark (High Growth, Low Market Share)
- 4.3.4. Dogs (Low Growth, Low Market Share)
- 4.4. Ansoff Matrix Analysis
- 4.5. Supply Chain Analysis
- 4.6. Regulatory Landscape
- 4.7. Current Market Potential and Opportunity Assessment (TAM–SAM–SOM Framework)
- 4.8. MDP Analyst Note
- 4.1. Porters Five Forces
- 5. Market Analysis, Insights and Forecast 2021-2033
- 5.1. Market Analysis, Insights and Forecast - by Service proposition
- 5.1.1. Money Transfer and Payments
- 5.1.2. Savings and Investments
- 5.1.3. Digital Lending & Lending Marketplaces
- 5.1.4. Online Insurance & Insurance Marketplaces
- 5.2. Market Analysis, Insights and Forecast - by Region
- 5.2.1. North America
- 5.2.2. South America
- 5.2.3. Europe
- 5.2.4. Middle East & Africa
- 5.2.5. Asia Pacific
- 5.1. Market Analysis, Insights and Forecast - by Service proposition
- 6. Global UAE Fintech Market Analysis, Insights and Forecast, 2021-2033
- 6.1. Market Analysis, Insights and Forecast - by Service proposition
- 6.1.1. Money Transfer and Payments
- 6.1.2. Savings and Investments
- 6.1.3. Digital Lending & Lending Marketplaces
- 6.1.4. Online Insurance & Insurance Marketplaces
- 6.1. Market Analysis, Insights and Forecast - by Service proposition
- 7. North America UAE Fintech Market Analysis, Insights and Forecast, 2020-2032
- 7.1. Market Analysis, Insights and Forecast - by Service proposition
- 7.1.1. Money Transfer and Payments
- 7.1.2. Savings and Investments
- 7.1.3. Digital Lending & Lending Marketplaces
- 7.1.4. Online Insurance & Insurance Marketplaces
- 7.1. Market Analysis, Insights and Forecast - by Service proposition
- 8. South America UAE Fintech Market Analysis, Insights and Forecast, 2020-2032
- 8.1. Market Analysis, Insights and Forecast - by Service proposition
- 8.1.1. Money Transfer and Payments
- 8.1.2. Savings and Investments
- 8.1.3. Digital Lending & Lending Marketplaces
- 8.1.4. Online Insurance & Insurance Marketplaces
- 8.1. Market Analysis, Insights and Forecast - by Service proposition
- 9. Europe UAE Fintech Market Analysis, Insights and Forecast, 2020-2032
- 9.1. Market Analysis, Insights and Forecast - by Service proposition
- 9.1.1. Money Transfer and Payments
- 9.1.2. Savings and Investments
- 9.1.3. Digital Lending & Lending Marketplaces
- 9.1.4. Online Insurance & Insurance Marketplaces
- 9.1. Market Analysis, Insights and Forecast - by Service proposition
- 10. Middle East & Africa UAE Fintech Market Analysis, Insights and Forecast, 2020-2032
- 10.1. Market Analysis, Insights and Forecast - by Service proposition
- 10.1.1. Money Transfer and Payments
- 10.1.2. Savings and Investments
- 10.1.3. Digital Lending & Lending Marketplaces
- 10.1.4. Online Insurance & Insurance Marketplaces
- 10.1. Market Analysis, Insights and Forecast - by Service proposition
- 11. Asia Pacific UAE Fintech Market Analysis, Insights and Forecast, 2020-2032
- 11.1. Market Analysis, Insights and Forecast - by Service proposition
- 11.1.1. Money Transfer and Payments
- 11.1.2. Savings and Investments
- 11.1.3. Digital Lending & Lending Marketplaces
- 11.1.4. Online Insurance & Insurance Marketplaces
- 11.1. Market Analysis, Insights and Forecast - by Service proposition
- 12. Competitive Analysis
- 12.1. Company Profiles
- 12.1.1 Tabby
- 12.1.1.1. Company Overview
- 12.1.1.2. Products
- 12.1.1.3. Company Financials
- 12.1.1.4. SWOT Analysis
- 12.1.2 Yalla Compare
- 12.1.2.1. Company Overview
- 12.1.2.2. Products
- 12.1.2.3. Company Financials
- 12.1.2.4. SWOT Analysis
- 12.1.3 Sehteq
- 12.1.3.1. Company Overview
- 12.1.3.2. Products
- 12.1.3.3. Company Financials
- 12.1.3.4. SWOT Analysis
- 12.1.4 Beehive FinTech
- 12.1.4.1. Company Overview
- 12.1.4.2. Products
- 12.1.4.3. Company Financials
- 12.1.4.4. SWOT Analysis
- 12.1.5 Souqalmal
- 12.1.5.1. Company Overview
- 12.1.5.2. Products
- 12.1.5.3. Company Financials
- 12.1.5.4. SWOT Analysis
- 12.1.6 Sarwa
- 12.1.6.1. Company Overview
- 12.1.6.2. Products
- 12.1.6.3. Company Financials
- 12.1.6.4. SWOT Analysis
- 12.1.7 Mamo Pay
- 12.1.7.1. Company Overview
- 12.1.7.2. Products
- 12.1.7.3. Company Financials
- 12.1.7.4. SWOT Analysis
- 12.1.8 Channel VAS
- 12.1.8.1. Company Overview
- 12.1.8.2. Products
- 12.1.8.3. Company Financials
- 12.1.8.4. SWOT Analysis
- 12.1.9 Zinna
- 12.1.9.1. Company Overview
- 12.1.9.2. Products
- 12.1.9.3. Company Financials
- 12.1.9.4. SWOT Analysis
- 12.1.10 Now Money**List Not Exhaustive
- 12.1.10.1. Company Overview
- 12.1.10.2. Products
- 12.1.10.3. Company Financials
- 12.1.10.4. SWOT Analysis
- 12.1.1 Tabby
- 12.2. Market Entropy
- 12.2.1 Company's Key Areas Served
- 12.2.2 Recent Developments
- 12.3. Company Market Share Analysis 2025
- 12.3.1 Top 5 Companies Market Share Analysis
- 12.3.2 Top 3 Companies Market Share Analysis
- 12.4. List of Potential Customers
- 13. Research Methodology
List of Figures
- Figure 1: Global UAE Fintech Market Revenue Breakdown (Million, %) by Region 2025 & 2033
- Figure 2: Global UAE Fintech Market Volume Breakdown (Billion, %) by Region 2025 & 2033
- Figure 3: North America UAE Fintech Market Revenue (Million), by Service proposition 2025 & 2033
- Figure 4: North America UAE Fintech Market Volume (Billion), by Service proposition 2025 & 2033
- Figure 5: North America UAE Fintech Market Revenue Share (%), by Service proposition 2025 & 2033
- Figure 6: North America UAE Fintech Market Volume Share (%), by Service proposition 2025 & 2033
- Figure 7: North America UAE Fintech Market Revenue (Million), by Country 2025 & 2033
- Figure 8: North America UAE Fintech Market Volume (Billion), by Country 2025 & 2033
- Figure 9: North America UAE Fintech Market Revenue Share (%), by Country 2025 & 2033
- Figure 10: North America UAE Fintech Market Volume Share (%), by Country 2025 & 2033
- Figure 11: South America UAE Fintech Market Revenue (Million), by Service proposition 2025 & 2033
- Figure 12: South America UAE Fintech Market Volume (Billion), by Service proposition 2025 & 2033
- Figure 13: South America UAE Fintech Market Revenue Share (%), by Service proposition 2025 & 2033
- Figure 14: South America UAE Fintech Market Volume Share (%), by Service proposition 2025 & 2033
- Figure 15: South America UAE Fintech Market Revenue (Million), by Country 2025 & 2033
- Figure 16: South America UAE Fintech Market Volume (Billion), by Country 2025 & 2033
- Figure 17: South America UAE Fintech Market Revenue Share (%), by Country 2025 & 2033
- Figure 18: South America UAE Fintech Market Volume Share (%), by Country 2025 & 2033
- Figure 19: Europe UAE Fintech Market Revenue (Million), by Service proposition 2025 & 2033
- Figure 20: Europe UAE Fintech Market Volume (Billion), by Service proposition 2025 & 2033
- Figure 21: Europe UAE Fintech Market Revenue Share (%), by Service proposition 2025 & 2033
- Figure 22: Europe UAE Fintech Market Volume Share (%), by Service proposition 2025 & 2033
- Figure 23: Europe UAE Fintech Market Revenue (Million), by Country 2025 & 2033
- Figure 24: Europe UAE Fintech Market Volume (Billion), by Country 2025 & 2033
- Figure 25: Europe UAE Fintech Market Revenue Share (%), by Country 2025 & 2033
- Figure 26: Europe UAE Fintech Market Volume Share (%), by Country 2025 & 2033
- Figure 27: Middle East & Africa UAE Fintech Market Revenue (Million), by Service proposition 2025 & 2033
- Figure 28: Middle East & Africa UAE Fintech Market Volume (Billion), by Service proposition 2025 & 2033
- Figure 29: Middle East & Africa UAE Fintech Market Revenue Share (%), by Service proposition 2025 & 2033
- Figure 30: Middle East & Africa UAE Fintech Market Volume Share (%), by Service proposition 2025 & 2033
- Figure 31: Middle East & Africa UAE Fintech Market Revenue (Million), by Country 2025 & 2033
- Figure 32: Middle East & Africa UAE Fintech Market Volume (Billion), by Country 2025 & 2033
- Figure 33: Middle East & Africa UAE Fintech Market Revenue Share (%), by Country 2025 & 2033
- Figure 34: Middle East & Africa UAE Fintech Market Volume Share (%), by Country 2025 & 2033
- Figure 35: Asia Pacific UAE Fintech Market Revenue (Million), by Service proposition 2025 & 2033
- Figure 36: Asia Pacific UAE Fintech Market Volume (Billion), by Service proposition 2025 & 2033
- Figure 37: Asia Pacific UAE Fintech Market Revenue Share (%), by Service proposition 2025 & 2033
- Figure 38: Asia Pacific UAE Fintech Market Volume Share (%), by Service proposition 2025 & 2033
- Figure 39: Asia Pacific UAE Fintech Market Revenue (Million), by Country 2025 & 2033
- Figure 40: Asia Pacific UAE Fintech Market Volume (Billion), by Country 2025 & 2033
- Figure 41: Asia Pacific UAE Fintech Market Revenue Share (%), by Country 2025 & 2033
- Figure 42: Asia Pacific UAE Fintech Market Volume Share (%), by Country 2025 & 2033
List of Tables
- Table 1: Global UAE Fintech Market Revenue Million Forecast, by Service proposition 2020 & 2033
- Table 2: Global UAE Fintech Market Volume Billion Forecast, by Service proposition 2020 & 2033
- Table 3: Global UAE Fintech Market Revenue Million Forecast, by Region 2020 & 2033
- Table 4: Global UAE Fintech Market Volume Billion Forecast, by Region 2020 & 2033
- Table 5: Global UAE Fintech Market Revenue Million Forecast, by Service proposition 2020 & 2033
- Table 6: Global UAE Fintech Market Volume Billion Forecast, by Service proposition 2020 & 2033
- Table 7: Global UAE Fintech Market Revenue Million Forecast, by Country 2020 & 2033
- Table 8: Global UAE Fintech Market Volume Billion Forecast, by Country 2020 & 2033
- Table 9: United States UAE Fintech Market Revenue (Million) Forecast, by Application 2020 & 2033
- Table 10: United States UAE Fintech Market Volume (Billion) Forecast, by Application 2020 & 2033
- Table 11: Canada UAE Fintech Market Revenue (Million) Forecast, by Application 2020 & 2033
- Table 12: Canada UAE Fintech Market Volume (Billion) Forecast, by Application 2020 & 2033
- Table 13: Mexico UAE Fintech Market Revenue (Million) Forecast, by Application 2020 & 2033
- Table 14: Mexico UAE Fintech Market Volume (Billion) Forecast, by Application 2020 & 2033
- Table 15: Global UAE Fintech Market Revenue Million Forecast, by Service proposition 2020 & 2033
- Table 16: Global UAE Fintech Market Volume Billion Forecast, by Service proposition 2020 & 2033
- Table 17: Global UAE Fintech Market Revenue Million Forecast, by Country 2020 & 2033
- Table 18: Global UAE Fintech Market Volume Billion Forecast, by Country 2020 & 2033
- Table 19: Brazil UAE Fintech Market Revenue (Million) Forecast, by Application 2020 & 2033
- Table 20: Brazil UAE Fintech Market Volume (Billion) Forecast, by Application 2020 & 2033
- Table 21: Argentina UAE Fintech Market Revenue (Million) Forecast, by Application 2020 & 2033
- Table 22: Argentina UAE Fintech Market Volume (Billion) Forecast, by Application 2020 & 2033
- Table 23: Rest of South America UAE Fintech Market Revenue (Million) Forecast, by Application 2020 & 2033
- Table 24: Rest of South America UAE Fintech Market Volume (Billion) Forecast, by Application 2020 & 2033
- Table 25: Global UAE Fintech Market Revenue Million Forecast, by Service proposition 2020 & 2033
- Table 26: Global UAE Fintech Market Volume Billion Forecast, by Service proposition 2020 & 2033
- Table 27: Global UAE Fintech Market Revenue Million Forecast, by Country 2020 & 2033
- Table 28: Global UAE Fintech Market Volume Billion Forecast, by Country 2020 & 2033
- Table 29: United Kingdom UAE Fintech Market Revenue (Million) Forecast, by Application 2020 & 2033
- Table 30: United Kingdom UAE Fintech Market Volume (Billion) Forecast, by Application 2020 & 2033
- Table 31: Germany UAE Fintech Market Revenue (Million) Forecast, by Application 2020 & 2033
- Table 32: Germany UAE Fintech Market Volume (Billion) Forecast, by Application 2020 & 2033
- Table 33: France UAE Fintech Market Revenue (Million) Forecast, by Application 2020 & 2033
- Table 34: France UAE Fintech Market Volume (Billion) Forecast, by Application 2020 & 2033
- Table 35: Italy UAE Fintech Market Revenue (Million) Forecast, by Application 2020 & 2033
- Table 36: Italy UAE Fintech Market Volume (Billion) Forecast, by Application 2020 & 2033
- Table 37: Spain UAE Fintech Market Revenue (Million) Forecast, by Application 2020 & 2033
- Table 38: Spain UAE Fintech Market Volume (Billion) Forecast, by Application 2020 & 2033
- Table 39: Russia UAE Fintech Market Revenue (Million) Forecast, by Application 2020 & 2033
- Table 40: Russia UAE Fintech Market Volume (Billion) Forecast, by Application 2020 & 2033
- Table 41: Benelux UAE Fintech Market Revenue (Million) Forecast, by Application 2020 & 2033
- Table 42: Benelux UAE Fintech Market Volume (Billion) Forecast, by Application 2020 & 2033
- Table 43: Nordics UAE Fintech Market Revenue (Million) Forecast, by Application 2020 & 2033
- Table 44: Nordics UAE Fintech Market Volume (Billion) Forecast, by Application 2020 & 2033
- Table 45: Rest of Europe UAE Fintech Market Revenue (Million) Forecast, by Application 2020 & 2033
- Table 46: Rest of Europe UAE Fintech Market Volume (Billion) Forecast, by Application 2020 & 2033
- Table 47: Global UAE Fintech Market Revenue Million Forecast, by Service proposition 2020 & 2033
- Table 48: Global UAE Fintech Market Volume Billion Forecast, by Service proposition 2020 & 2033
- Table 49: Global UAE Fintech Market Revenue Million Forecast, by Country 2020 & 2033
- Table 50: Global UAE Fintech Market Volume Billion Forecast, by Country 2020 & 2033
- Table 51: Turkey UAE Fintech Market Revenue (Million) Forecast, by Application 2020 & 2033
- Table 52: Turkey UAE Fintech Market Volume (Billion) Forecast, by Application 2020 & 2033
- Table 53: Israel UAE Fintech Market Revenue (Million) Forecast, by Application 2020 & 2033
- Table 54: Israel UAE Fintech Market Volume (Billion) Forecast, by Application 2020 & 2033
- Table 55: GCC UAE Fintech Market Revenue (Million) Forecast, by Application 2020 & 2033
- Table 56: GCC UAE Fintech Market Volume (Billion) Forecast, by Application 2020 & 2033
- Table 57: North Africa UAE Fintech Market Revenue (Million) Forecast, by Application 2020 & 2033
- Table 58: North Africa UAE Fintech Market Volume (Billion) Forecast, by Application 2020 & 2033
- Table 59: South Africa UAE Fintech Market Revenue (Million) Forecast, by Application 2020 & 2033
- Table 60: South Africa UAE Fintech Market Volume (Billion) Forecast, by Application 2020 & 2033
- Table 61: Rest of Middle East & Africa UAE Fintech Market Revenue (Million) Forecast, by Application 2020 & 2033
- Table 62: Rest of Middle East & Africa UAE Fintech Market Volume (Billion) Forecast, by Application 2020 & 2033
- Table 63: Global UAE Fintech Market Revenue Million Forecast, by Service proposition 2020 & 2033
- Table 64: Global UAE Fintech Market Volume Billion Forecast, by Service proposition 2020 & 2033
- Table 65: Global UAE Fintech Market Revenue Million Forecast, by Country 2020 & 2033
- Table 66: Global UAE Fintech Market Volume Billion Forecast, by Country 2020 & 2033
- Table 67: China UAE Fintech Market Revenue (Million) Forecast, by Application 2020 & 2033
- Table 68: China UAE Fintech Market Volume (Billion) Forecast, by Application 2020 & 2033
- Table 69: India UAE Fintech Market Revenue (Million) Forecast, by Application 2020 & 2033
- Table 70: India UAE Fintech Market Volume (Billion) Forecast, by Application 2020 & 2033
- Table 71: Japan UAE Fintech Market Revenue (Million) Forecast, by Application 2020 & 2033
- Table 72: Japan UAE Fintech Market Volume (Billion) Forecast, by Application 2020 & 2033
- Table 73: South Korea UAE Fintech Market Revenue (Million) Forecast, by Application 2020 & 2033
- Table 74: South Korea UAE Fintech Market Volume (Billion) Forecast, by Application 2020 & 2033
- Table 75: ASEAN UAE Fintech Market Revenue (Million) Forecast, by Application 2020 & 2033
- Table 76: ASEAN UAE Fintech Market Volume (Billion) Forecast, by Application 2020 & 2033
- Table 77: Oceania UAE Fintech Market Revenue (Million) Forecast, by Application 2020 & 2033
- Table 78: Oceania UAE Fintech Market Volume (Billion) Forecast, by Application 2020 & 2033
- Table 79: Rest of Asia Pacific UAE Fintech Market Revenue (Million) Forecast, by Application 2020 & 2033
- Table 80: Rest of Asia Pacific UAE Fintech Market Volume (Billion) Forecast, by Application 2020 & 2033
Frequently Asked Questions
1. What is the projected Compound Annual Growth Rate (CAGR) of the UAE Fintech Market?
The projected CAGR is approximately 12.56%.
2. Which companies are prominent players in the UAE Fintech Market?
Key companies in the market include Tabby, Yalla Compare, Sehteq, Beehive FinTech, Souqalmal, Sarwa, Mamo Pay, Channel VAS, Zinna, Now Money**List Not Exhaustive.
3. What are the main segments of the UAE Fintech Market?
The market segments include Service proposition.
4. Can you provide details about the market size?
The market size is estimated to be USD 3.16 Million as of 2022.
5. What are some drivers contributing to market growth?
Rise in the Number of Fintech Startups is Driving the Market; Favorable Regulatory Compliance Landscape is Promoting the Fintech Market.
6. What are the notable trends driving market growth?
The Market is Being Driven by the Development of New Technologies.
7. Are there any restraints impacting market growth?
Rise in the Number of Fintech Startups is Driving the Market; Favorable Regulatory Compliance Landscape is Promoting the Fintech Market.
8. Can you provide examples of recent developments in the market?
August 2023: MENA’s number one shopping and fintech app, Tabby, launched its latest all-in-one shopping tool, Tabby Shop. This is the biggest update to Tabby’s app since its inception. Tabi Shop is a comprehensive shopping app that brings together more than 500,000+ products from over 10,000+ brands in the Fashion, Beauty, Home, and Electronics categories. Tabby Shop offers several shopping tools, such as smarter search, better wishlists, deal notifications, and more.
9. What pricing options are available for accessing the report?
Pricing options include single-user, multi-user, and enterprise licenses priced at USD 3800, USD 4500, and USD 5800 respectively.
10. Is the market size provided in terms of value or volume?
The market size is provided in terms of value, measured in Million and volume, measured in Billion.
11. Are there any specific market keywords associated with the report?
Yes, the market keyword associated with the report is "UAE Fintech Market," which aids in identifying and referencing the specific market segment covered.
12. How do I determine which pricing option suits my needs best?
The pricing options vary based on user requirements and access needs. Individual users may opt for single-user licenses, while businesses requiring broader access may choose multi-user or enterprise licenses for cost-effective access to the report.
13. Are there any additional resources or data provided in the UAE Fintech Market report?
While the report offers comprehensive insights, it's advisable to review the specific contents or supplementary materials provided to ascertain if additional resources or data are available.
14. How can I stay updated on further developments or reports in the UAE Fintech Market?
To stay informed about further developments, trends, and reports in the UAE Fintech Market, consider subscribing to industry newsletters, following relevant companies and organizations, or regularly checking reputable industry news sources and publications.
Methodology
Step 1 - Identification of Relevant Samples Size from Population Database


Step 2 - Approaches for Defining Global Market Size (Value, Volume* & Price*)

Note*: In applicable scenarios
Step 3 - Data Sources
Primary Research
- Web Analytics
- Survey Reports
- Research Institute
- Latest Research Reports
- Opinion Leaders
Secondary Research
- Annual Reports
- White Paper
- Latest Press Release
- Industry Association
- Paid Database
- Investor Presentations

Step 4 - Data Triangulation
Involves using different sources of information in order to increase the validity of a study
These sources are likely to be stakeholders in a program - participants, other researchers, program staff, other community members, and so on.
Then we put all data in single framework & apply various statistical tools to find out the dynamic on the market.
During the analysis stage, feedback from the stakeholder groups would be compared to determine areas of agreement as well as areas of divergence