

Key Insights
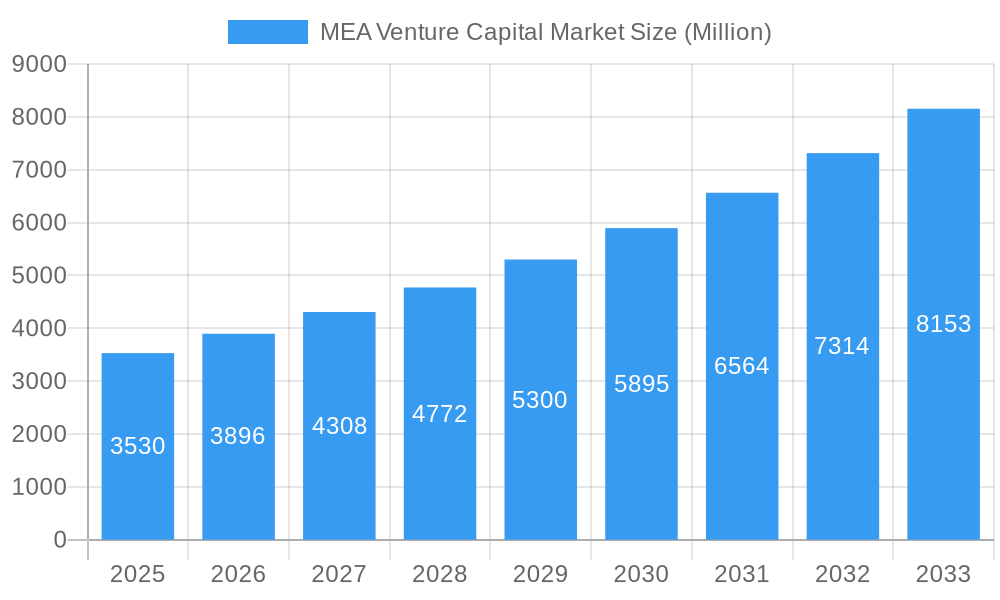
The Middle East and Africa (MEA) venture capital market is experiencing robust growth, projected to reach a market size of $3.53 billion in 2025, expanding at a Compound Annual Growth Rate (CAGR) of 10.20% from 2025 to 2033. This surge is driven by several factors. Firstly, a burgeoning startup ecosystem, fueled by government initiatives promoting entrepreneurship and digital transformation across sectors like fintech, e-commerce, and healthcare in countries such as the UAE and Saudi Arabia, is attracting significant investment. Secondly, the presence of established and emerging venture capital firms like Nuwa Capital, Wamda Capital, and Algebra Ventures, coupled with increasing participation from international investors, signifies a growing confidence in the region's potential. Furthermore, strategic investments in sectors with high growth potential, such as technology and logistics, are accelerating market expansion. While regulatory challenges and a relatively smaller pool of angel investors compared to more mature markets present some restraints, the overall outlook remains highly positive.
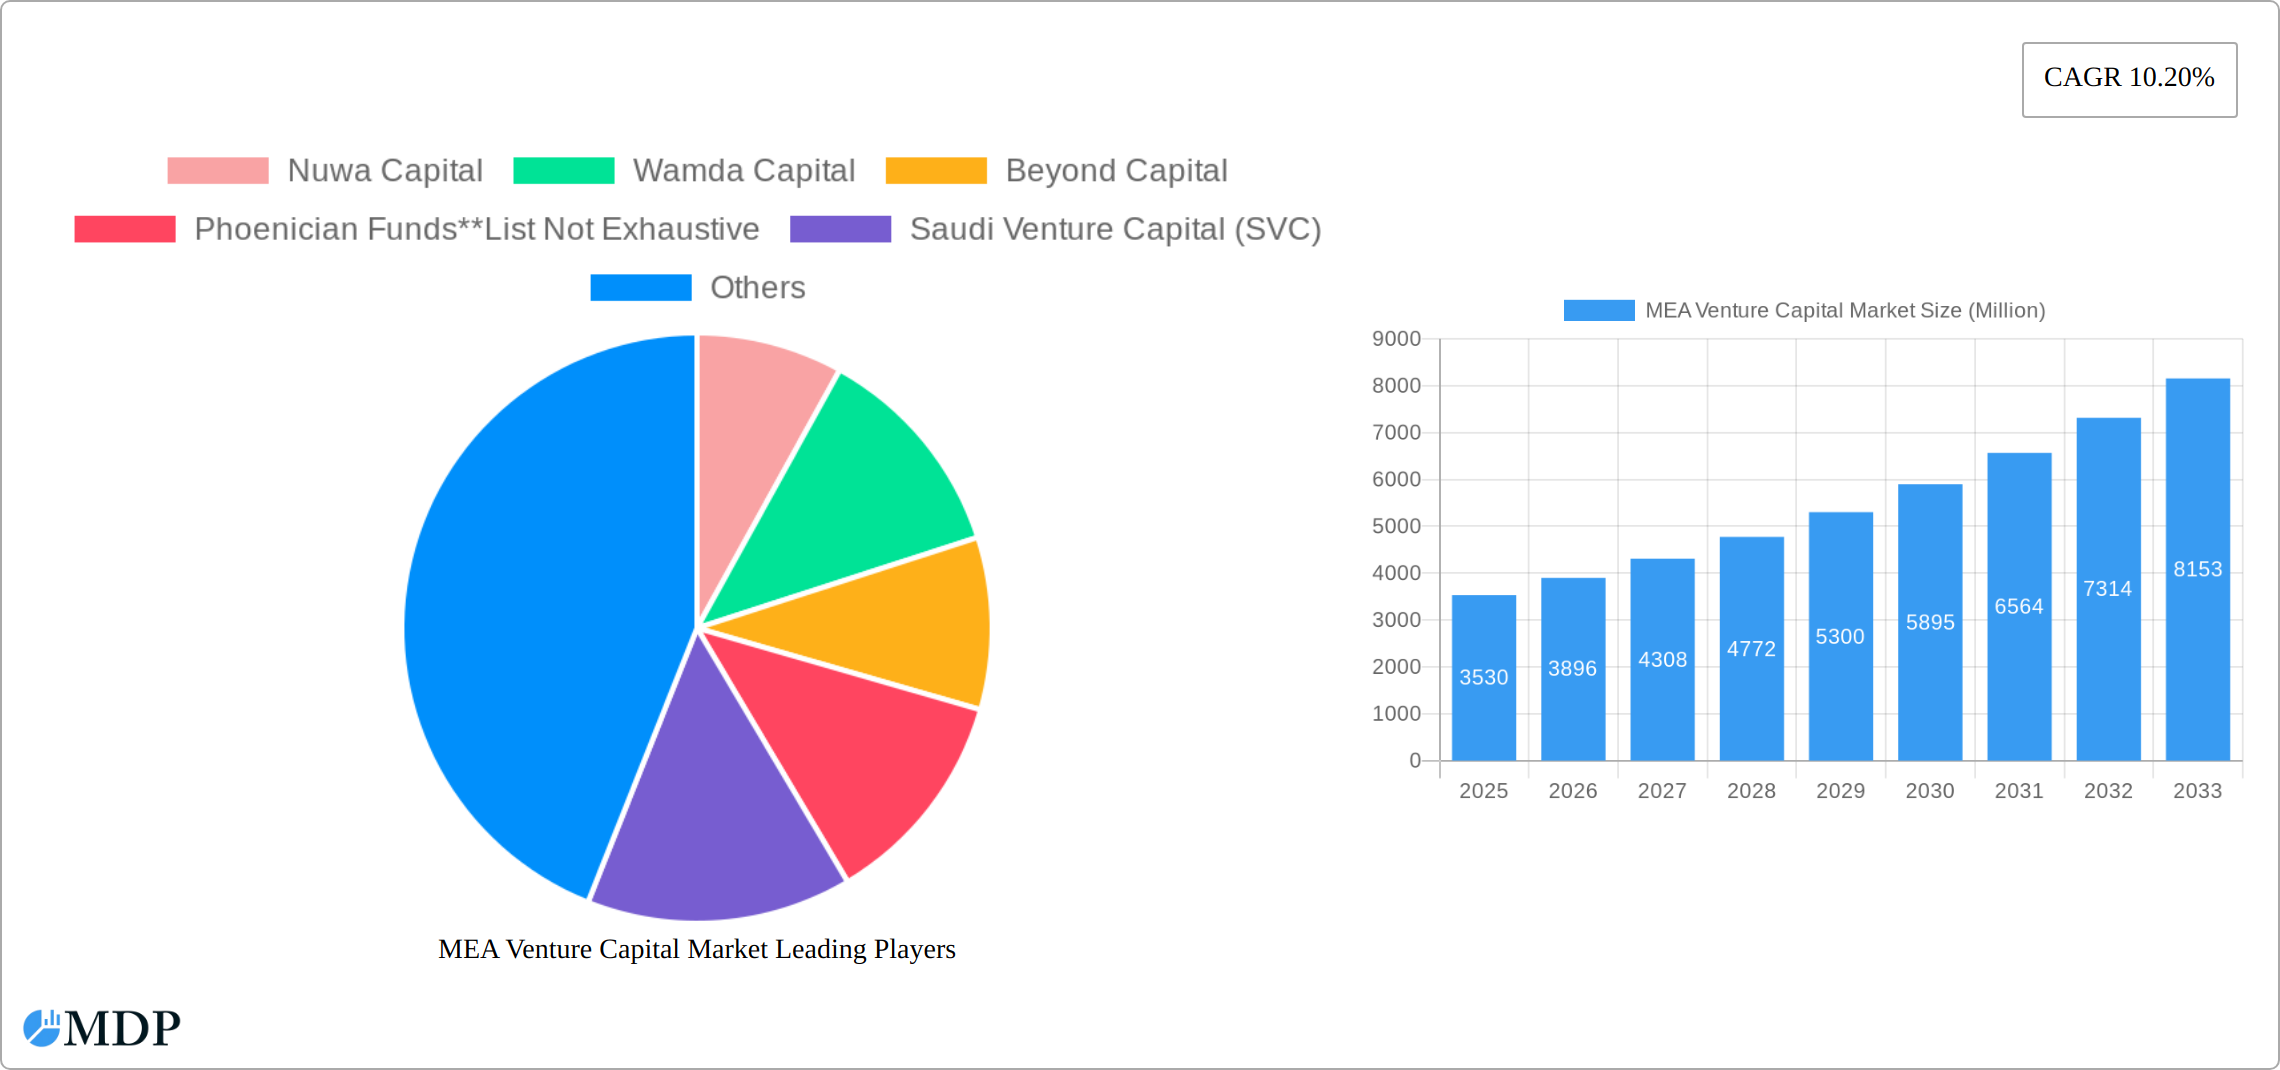
MEA Venture Capital Market Market Size (In Billion)
The continued growth trajectory is expected to be fueled by several key trends. Increasing digital adoption across the region, coupled with a young and tech-savvy population, will create new opportunities for innovative startups. Furthermore, the diversification of the regional economy, away from its traditional reliance on oil, is driving investment into technology-enabled solutions across various sectors. The increasing availability of funding through government-backed initiatives and a growing number of accelerator and incubator programs will further support the expansion of the venture capital market. While economic fluctuations in certain MEA countries could pose challenges, the long-term prospects for venture capital investment remain bright, particularly given the substantial untapped potential across various industries and the region's strategic geographical location.
MEA Venture Capital Market Company Market Share
MEA Venture Capital Market: A Comprehensive Report (2019-2033)
This comprehensive report provides an in-depth analysis of the Middle East and Africa (MEA) Venture Capital market, covering the period from 2019 to 2033. It offers invaluable insights for investors, entrepreneurs, and industry stakeholders seeking to understand the market dynamics, growth opportunities, and challenges within this rapidly evolving landscape. The report leverages extensive data analysis and expert insights to provide a 360-degree view of the MEA Venture Capital market, incorporating key segments like Real Estate, Financial Services, Food & Beverage, Healthcare, Transport and Logistics, IT and ITeS, and Education, and examining both local and international investors. With a focus on key players such as Nuwa Capital, Wamda Capital, Beyond Capital, and Phoenician Funds (list not exhaustive), this report is an essential resource for navigating the complexities of this dynamic market.
MEA Venture Capital Market Market Dynamics & Concentration
The MEA venture capital market is a dynamic ecosystem shaped by a confluence of growth catalysts and competitive forces. While a few prominent venture capital firms command a significant presence, the landscape is also populated by a robust cohort of smaller, specialized funds, indicating a moderately concentrated market. Innovation remains the cornerstone of this growth, propelled by a vibrant startup scene and proactive government initiatives designed to accelerate technological adoption and advancement. The regulatory environment across the region is a key consideration, with varying frameworks influencing investment strategies and deal structuring. While direct substitutes for venture capital are scarce, alternative funding avenues such as angel investments and crowdfunding platforms introduce competitive pressures. Investor priorities are increasingly aligning with end-user demands, notably the growing inclination towards technology-driven solutions and businesses championing sustainability. Mergers and acquisitions (M&A) activity, though historically subdued compared to more established markets, is showing an upward trend, signaling a maturing market characterized by consolidation and strategic growth.
- Market Share: In 2025, the top 5 players are projected to collectively hold an estimated XX% of the market share, with the remaining XX% distributed among a diverse array of smaller firms.
- M&A Deal Counts: The year 2025 is anticipated to witness approximately XX M&A deals, marking a significant XX% increase compared to 2024.
MEA Venture Capital Market Industry Trends & Analysis
The MEA venture capital market is experiencing robust growth, driven by a confluence of factors. A young and expanding population, coupled with rising disposable incomes and increasing internet penetration, fuels demand for innovative products and services. Technological disruptions, particularly in fintech, e-commerce, and healthcare, are creating exciting investment opportunities. Consumer preferences are shifting towards digital solutions and sustainable practices, influencing investment strategies. The competitive landscape is dynamic, with both local and international investors vying for promising startups. This competition is fostering innovation and driving down valuations in certain segments. The Compound Annual Growth Rate (CAGR) for the MEA venture capital market is projected to be xx% during the forecast period (2025-2033), with market penetration reaching xx% by 2033.
Leading Markets & Segments in MEA Venture Capital Market
The United Arab Emirates (UAE) and Saudi Arabia are currently at the forefront of the MEA venture capital market, buoyed by substantial government backing for innovation, advanced infrastructure, and a conducive regulatory climate. Within the industry segments, Information Technology (IT) and IT-enabled Services (ITeS) consistently attract the largest share of investments, closely followed by the Fintech sector. While the Real Estate sector demonstrates considerable potential for growth, it currently occupies a less prominent position in terms of venture capital funding.
-
Key Drivers for UAE and Saudi Arabia:
- Pro-innovation government policies and supportive regulatory frameworks fostering business growth.
- State-of-the-art infrastructure and a readily available pool of skilled talent.
- Robust economic expansion and substantial inflows of foreign direct investment (FDI).
- A strong emphasis on driving technological innovation and comprehensive digital transformation agendas.
-
Dominance Analysis: The preeminence of the IT and ITeS sector is attributable to its intrinsic high growth trajectory, comparatively lower capital intensity requirements, and ample opportunities for developing scalable enterprises. The robustness of the Fintech sector is a direct consequence of increasing mobile banking penetration and a surging demand for digital financial solutions. Local investors are demonstrating growing engagement across multiple sectors, while international investors tend to concentrate their capital in high-growth domains such as IT, ITeS, and Fintech.
MEA Venture Capital Market Product Developments
Product innovation in the MEA venture capital market is primarily driven by technological advancements and the need for tailored investment solutions. This includes the development of specialized funds focusing on specific industry verticals (e.g., cleantech, agritech) and innovative financing structures (e.g., revenue-based financing, convertible notes). These developments enhance the competitive advantage of venture capital firms by enabling them to better cater to the diverse needs of startups in the region. The focus is on solutions that improve operational efficiency and reduce risk for startups, while accelerating their growth trajectory.
Key Drivers of MEA Venture Capital Market Growth
Several key factors contribute to the sustained growth of the MEA venture capital market. Technological advancements across diverse sectors are creating numerous investment opportunities. Favorable government policies and initiatives aimed at boosting entrepreneurship are attracting both domestic and international capital. Furthermore, the region's growing population and expanding middle class are fueling demand for innovative goods and services, generating more investment opportunities.
Challenges in the MEA Venture Capital Market Market
Despite the growth potential, the MEA venture capital market faces several challenges. Regulatory hurdles and bureaucratic processes can sometimes hinder investment flows. Supply chain disruptions, particularly during times of global uncertainty, can negatively impact the performance of portfolio companies. Competition from established players and alternative financing sources further complicates the landscape. These challenges are estimated to reduce overall investment volume by approximately xx Million in 2025.
Emerging Opportunities in MEA Venture Capital Market
The long-term expansion of the MEA venture capital market is underpinned by several compelling prospects. Cutting-edge technological advancements in fields such as artificial intelligence and renewable energy are creating lucrative investment avenues. Strategic collaborations between established corporations and agile startups are serving as powerful engines for innovation, fostering synergistic relationships that yield mutual benefits. Exploring and penetrating underserved markets within the region presents a substantial opportunity for generating significant returns. Furthermore, the cultivation of both regional and international partnerships is expected to be a key catalyst in stimulating this projected growth.
Leading Players in the MEA Venture Capital Market Sector
- Nuwa Capital
- Wamda Capital
- Beyond Capital
- Phoenician Funds
- Saudi Venture Capital (SVC)
- Falt6Labs Bahrain
- Global Ventures
- Vision Ventures
- Algebra Ventures
- 500 Startups
Key Milestones in MEA Venture Capital Market Industry
- February 2023: Saudi Venture Capital Investment Company launches a USD 1 Million income growth fund (SVC Sukuk Fund). This initiative significantly boosts the availability of capital for Saudi Arabian startups.
- February 2023: Flat6Labs completes the first close of its USD 20 Million 'Startup Seed Fund' in Saudi Arabia, with participation from the Saudi Venture Capital Company (SVC) and the 'Jada' Fund of Funds. This collaboration highlights the increasing alignment between government-backed funds and private investors in the region.
Strategic Outlook for MEA Venture Capital Market Market
The MEA venture capital market is strategically positioned for substantial growth over the next decade. The ongoing wave of digital transformation, coupled with proactive and supportive government policies, will continue to be a powerful magnet for investment. The proliferation of strategic partnerships and the emergence of novel investment models are expected to further amplify the market's growth potential. A concentrated focus on sectors exhibiting high growth potential, including fintech and renewable energy, will be paramount for optimizing returns within this dynamic market. Projections indicate that the market value is expected to reach approximately XX Million by 2033.
MEA Venture Capital Market Segmentation
-
1. Type
- 1.1. Local Investors
- 1.2. International Investors
-
2. Industry
- 2.1. Real Estate
- 2.2. Financial Services
- 2.3. Food & Beverage
- 2.4. Healthcare
- 2.5. Transport and Logistics
- 2.6. IT and ITeS
- 2.7. Education
- 2.8. Other Industries (Energy, etc.)
MEA Venture Capital Market Segmentation By Geography
-
1. North America
- 1.1. United States
- 1.2. Canada
- 1.3. Mexico
-
2. South America
- 2.1. Brazil
- 2.2. Argentina
- 2.3. Rest of South America
-
3. Europe
- 3.1. United Kingdom
- 3.2. Germany
- 3.3. France
- 3.4. Italy
- 3.5. Spain
- 3.6. Russia
- 3.7. Benelux
- 3.8. Nordics
- 3.9. Rest of Europe
-
4. Middle East & Africa
- 4.1. Turkey
- 4.2. Israel
- 4.3. GCC
- 4.4. North Africa
- 4.5. South Africa
- 4.6. Rest of Middle East & Africa
-
5. Asia Pacific
- 5.1. China
- 5.2. India
- 5.3. Japan
- 5.4. South Korea
- 5.5. ASEAN
- 5.6. Oceania
- 5.7. Rest of Asia Pacific
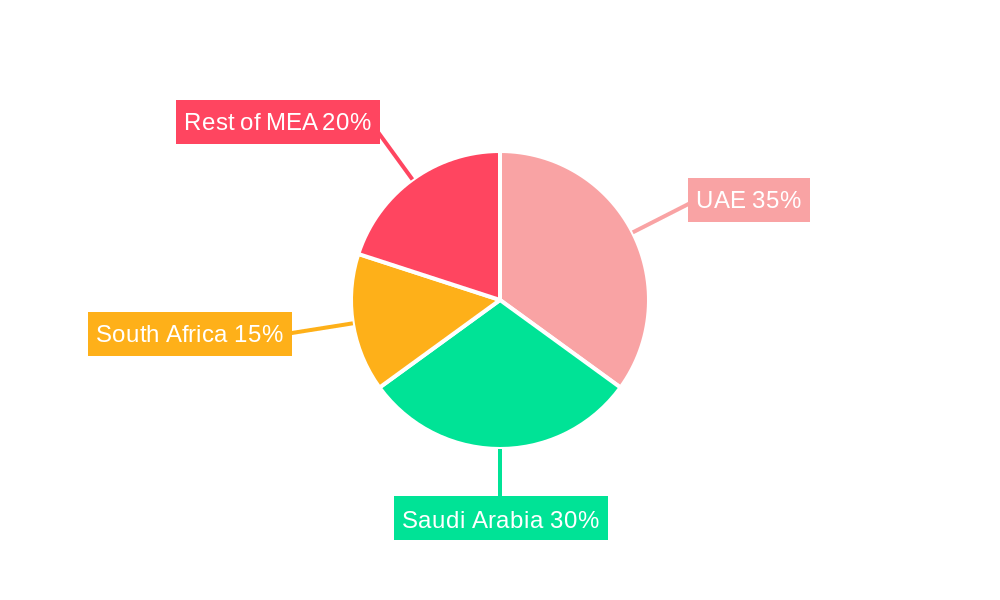
MEA Venture Capital Market Regional Market Share
Geographic Coverage of MEA Venture Capital Market
MEA Venture Capital Market REPORT HIGHLIGHTS
| Aspects | Details |
|---|---|
| Study Period | 2020-2034 |
| Base Year | 2025 |
| Estimated Year | 2026 |
| Forecast Period | 2026-2034 |
| Historical Period | 2020-2025 |
| Growth Rate | CAGR of 10.20% from 2020-2034 |
| Segmentation |
|
Table of Contents
- 1. Introduction
- 1.1. Research Scope
- 1.2. Market Segmentation
- 1.3. Research Objective
- 1.4. Definitions and Assumptions
- 2. Executive Summary
- 2.1. Market Snapshot
- 3. Market Dynamics
- 3.1. Market Drivers
- 3.2. Market Restrains
- 3.3. Market Trends
- 3.4. Market Opportunities
- 4. Market Factor Analysis
- 4.1. Porters Five Forces
- 4.1.1. Bargaining Power of Suppliers
- 4.1.2. Bargaining Power of Buyers
- 4.1.3. Threat of New Entrants
- 4.1.4. Threat of Substitutes
- 4.1.5. Competitive Rivalry
- 4.2. PESTEL analysis
- 4.3. BCG Analysis
- 4.3.1. Stars (High Growth, High Market Share)
- 4.3.2. Cash Cows (Low Growth, High Market Share)
- 4.3.3. Question Mark (High Growth, Low Market Share)
- 4.3.4. Dogs (Low Growth, Low Market Share)
- 4.4. Ansoff Matrix Analysis
- 4.5. Supply Chain Analysis
- 4.6. Regulatory Landscape
- 4.7. Current Market Potential and Opportunity Assessment (TAM–SAM–SOM Framework)
- 4.8. MDP Analyst Note
- 4.1. Porters Five Forces
- 5. Market Analysis, Insights and Forecast 2021-2033
- 5.1. Market Analysis, Insights and Forecast - by Type
- 5.1.1. Local Investors
- 5.1.2. International Investors
- 5.2. Market Analysis, Insights and Forecast - by Industry
- 5.2.1. Real Estate
- 5.2.2. Financial Services
- 5.2.3. Food & Beverage
- 5.2.4. Healthcare
- 5.2.5. Transport and Logistics
- 5.2.6. IT and ITeS
- 5.2.7. Education
- 5.2.8. Other Industries (Energy, etc.)
- 5.3. Market Analysis, Insights and Forecast - by Region
- 5.3.1. North America
- 5.3.2. South America
- 5.3.3. Europe
- 5.3.4. Middle East & Africa
- 5.3.5. Asia Pacific
- 5.1. Market Analysis, Insights and Forecast - by Type
- 6. Global MEA Venture Capital Market Analysis, Insights and Forecast, 2021-2033
- 6.1. Market Analysis, Insights and Forecast - by Type
- 6.1.1. Local Investors
- 6.1.2. International Investors
- 6.2. Market Analysis, Insights and Forecast - by Industry
- 6.2.1. Real Estate
- 6.2.2. Financial Services
- 6.2.3. Food & Beverage
- 6.2.4. Healthcare
- 6.2.5. Transport and Logistics
- 6.2.6. IT and ITeS
- 6.2.7. Education
- 6.2.8. Other Industries (Energy, etc.)
- 6.1. Market Analysis, Insights and Forecast - by Type
- 7. North America MEA Venture Capital Market Analysis, Insights and Forecast, 2020-2032
- 7.1. Market Analysis, Insights and Forecast - by Type
- 7.1.1. Local Investors
- 7.1.2. International Investors
- 7.2. Market Analysis, Insights and Forecast - by Industry
- 7.2.1. Real Estate
- 7.2.2. Financial Services
- 7.2.3. Food & Beverage
- 7.2.4. Healthcare
- 7.2.5. Transport and Logistics
- 7.2.6. IT and ITeS
- 7.2.7. Education
- 7.2.8. Other Industries (Energy, etc.)
- 7.1. Market Analysis, Insights and Forecast - by Type
- 8. South America MEA Venture Capital Market Analysis, Insights and Forecast, 2020-2032
- 8.1. Market Analysis, Insights and Forecast - by Type
- 8.1.1. Local Investors
- 8.1.2. International Investors
- 8.2. Market Analysis, Insights and Forecast - by Industry
- 8.2.1. Real Estate
- 8.2.2. Financial Services
- 8.2.3. Food & Beverage
- 8.2.4. Healthcare
- 8.2.5. Transport and Logistics
- 8.2.6. IT and ITeS
- 8.2.7. Education
- 8.2.8. Other Industries (Energy, etc.)
- 8.1. Market Analysis, Insights and Forecast - by Type
- 9. Europe MEA Venture Capital Market Analysis, Insights and Forecast, 2020-2032
- 9.1. Market Analysis, Insights and Forecast - by Type
- 9.1.1. Local Investors
- 9.1.2. International Investors
- 9.2. Market Analysis, Insights and Forecast - by Industry
- 9.2.1. Real Estate
- 9.2.2. Financial Services
- 9.2.3. Food & Beverage
- 9.2.4. Healthcare
- 9.2.5. Transport and Logistics
- 9.2.6. IT and ITeS
- 9.2.7. Education
- 9.2.8. Other Industries (Energy, etc.)
- 9.1. Market Analysis, Insights and Forecast - by Type
- 10. Middle East & Africa MEA Venture Capital Market Analysis, Insights and Forecast, 2020-2032
- 10.1. Market Analysis, Insights and Forecast - by Type
- 10.1.1. Local Investors
- 10.1.2. International Investors
- 10.2. Market Analysis, Insights and Forecast - by Industry
- 10.2.1. Real Estate
- 10.2.2. Financial Services
- 10.2.3. Food & Beverage
- 10.2.4. Healthcare
- 10.2.5. Transport and Logistics
- 10.2.6. IT and ITeS
- 10.2.7. Education
- 10.2.8. Other Industries (Energy, etc.)
- 10.1. Market Analysis, Insights and Forecast - by Type
- 11. Asia Pacific MEA Venture Capital Market Analysis, Insights and Forecast, 2020-2032
- 11.1. Market Analysis, Insights and Forecast - by Type
- 11.1.1. Local Investors
- 11.1.2. International Investors
- 11.2. Market Analysis, Insights and Forecast - by Industry
- 11.2.1. Real Estate
- 11.2.2. Financial Services
- 11.2.3. Food & Beverage
- 11.2.4. Healthcare
- 11.2.5. Transport and Logistics
- 11.2.6. IT and ITeS
- 11.2.7. Education
- 11.2.8. Other Industries (Energy, etc.)
- 11.1. Market Analysis, Insights and Forecast - by Type
- 12. Competitive Analysis
- 12.1. Company Profiles
- 12.1.1 Nuwa Capital
- 12.1.1.1. Company Overview
- 12.1.1.2. Products
- 12.1.1.3. Company Financials
- 12.1.1.4. SWOT Analysis
- 12.1.2 Wamda Capital
- 12.1.2.1. Company Overview
- 12.1.2.2. Products
- 12.1.2.3. Company Financials
- 12.1.2.4. SWOT Analysis
- 12.1.3 Beyond Capital
- 12.1.3.1. Company Overview
- 12.1.3.2. Products
- 12.1.3.3. Company Financials
- 12.1.3.4. SWOT Analysis
- 12.1.4 Phoenician Funds**List Not Exhaustive
- 12.1.4.1. Company Overview
- 12.1.4.2. Products
- 12.1.4.3. Company Financials
- 12.1.4.4. SWOT Analysis
- 12.1.5 Saudi Venture Capital (SVC)
- 12.1.5.1. Company Overview
- 12.1.5.2. Products
- 12.1.5.3. Company Financials
- 12.1.5.4. SWOT Analysis
- 12.1.6 Falt6Labs Bahrain
- 12.1.6.1. Company Overview
- 12.1.6.2. Products
- 12.1.6.3. Company Financials
- 12.1.6.4. SWOT Analysis
- 12.1.7 Global ventures
- 12.1.7.1. Company Overview
- 12.1.7.2. Products
- 12.1.7.3. Company Financials
- 12.1.7.4. SWOT Analysis
- 12.1.8 Vision Ventures
- 12.1.8.1. Company Overview
- 12.1.8.2. Products
- 12.1.8.3. Company Financials
- 12.1.8.4. SWOT Analysis
- 12.1.9 Algebra Ventures
- 12.1.9.1. Company Overview
- 12.1.9.2. Products
- 12.1.9.3. Company Financials
- 12.1.9.4. SWOT Analysis
- 12.1.10 500 Startups
- 12.1.10.1. Company Overview
- 12.1.10.2. Products
- 12.1.10.3. Company Financials
- 12.1.10.4. SWOT Analysis
- 12.1.1 Nuwa Capital
- 12.2. Market Entropy
- 12.2.1 Company's Key Areas Served
- 12.2.2 Recent Developments
- 12.3. Company Market Share Analysis 2025
- 12.3.1 Top 5 Companies Market Share Analysis
- 12.3.2 Top 3 Companies Market Share Analysis
- 12.4. List of Potential Customers
- 13. Research Methodology
List of Figures
- Figure 1: Global MEA Venture Capital Market Revenue Breakdown (Million, %) by Region 2025 & 2033
- Figure 2: North America MEA Venture Capital Market Revenue (Million), by Type 2025 & 2033
- Figure 3: North America MEA Venture Capital Market Revenue Share (%), by Type 2025 & 2033
- Figure 4: North America MEA Venture Capital Market Revenue (Million), by Industry 2025 & 2033
- Figure 5: North America MEA Venture Capital Market Revenue Share (%), by Industry 2025 & 2033
- Figure 6: North America MEA Venture Capital Market Revenue (Million), by Country 2025 & 2033
- Figure 7: North America MEA Venture Capital Market Revenue Share (%), by Country 2025 & 2033
- Figure 8: South America MEA Venture Capital Market Revenue (Million), by Type 2025 & 2033
- Figure 9: South America MEA Venture Capital Market Revenue Share (%), by Type 2025 & 2033
- Figure 10: South America MEA Venture Capital Market Revenue (Million), by Industry 2025 & 2033
- Figure 11: South America MEA Venture Capital Market Revenue Share (%), by Industry 2025 & 2033
- Figure 12: South America MEA Venture Capital Market Revenue (Million), by Country 2025 & 2033
- Figure 13: South America MEA Venture Capital Market Revenue Share (%), by Country 2025 & 2033
- Figure 14: Europe MEA Venture Capital Market Revenue (Million), by Type 2025 & 2033
- Figure 15: Europe MEA Venture Capital Market Revenue Share (%), by Type 2025 & 2033
- Figure 16: Europe MEA Venture Capital Market Revenue (Million), by Industry 2025 & 2033
- Figure 17: Europe MEA Venture Capital Market Revenue Share (%), by Industry 2025 & 2033
- Figure 18: Europe MEA Venture Capital Market Revenue (Million), by Country 2025 & 2033
- Figure 19: Europe MEA Venture Capital Market Revenue Share (%), by Country 2025 & 2033
- Figure 20: Middle East & Africa MEA Venture Capital Market Revenue (Million), by Type 2025 & 2033
- Figure 21: Middle East & Africa MEA Venture Capital Market Revenue Share (%), by Type 2025 & 2033
- Figure 22: Middle East & Africa MEA Venture Capital Market Revenue (Million), by Industry 2025 & 2033
- Figure 23: Middle East & Africa MEA Venture Capital Market Revenue Share (%), by Industry 2025 & 2033
- Figure 24: Middle East & Africa MEA Venture Capital Market Revenue (Million), by Country 2025 & 2033
- Figure 25: Middle East & Africa MEA Venture Capital Market Revenue Share (%), by Country 2025 & 2033
- Figure 26: Asia Pacific MEA Venture Capital Market Revenue (Million), by Type 2025 & 2033
- Figure 27: Asia Pacific MEA Venture Capital Market Revenue Share (%), by Type 2025 & 2033
- Figure 28: Asia Pacific MEA Venture Capital Market Revenue (Million), by Industry 2025 & 2033
- Figure 29: Asia Pacific MEA Venture Capital Market Revenue Share (%), by Industry 2025 & 2033
- Figure 30: Asia Pacific MEA Venture Capital Market Revenue (Million), by Country 2025 & 2033
- Figure 31: Asia Pacific MEA Venture Capital Market Revenue Share (%), by Country 2025 & 2033
List of Tables
- Table 1: Global MEA Venture Capital Market Revenue Million Forecast, by Type 2020 & 2033
- Table 2: Global MEA Venture Capital Market Revenue Million Forecast, by Industry 2020 & 2033
- Table 3: Global MEA Venture Capital Market Revenue Million Forecast, by Region 2020 & 2033
- Table 4: Global MEA Venture Capital Market Revenue Million Forecast, by Type 2020 & 2033
- Table 5: Global MEA Venture Capital Market Revenue Million Forecast, by Industry 2020 & 2033
- Table 6: Global MEA Venture Capital Market Revenue Million Forecast, by Country 2020 & 2033
- Table 7: United States MEA Venture Capital Market Revenue (Million) Forecast, by Application 2020 & 2033
- Table 8: Canada MEA Venture Capital Market Revenue (Million) Forecast, by Application 2020 & 2033
- Table 9: Mexico MEA Venture Capital Market Revenue (Million) Forecast, by Application 2020 & 2033
- Table 10: Global MEA Venture Capital Market Revenue Million Forecast, by Type 2020 & 2033
- Table 11: Global MEA Venture Capital Market Revenue Million Forecast, by Industry 2020 & 2033
- Table 12: Global MEA Venture Capital Market Revenue Million Forecast, by Country 2020 & 2033
- Table 13: Brazil MEA Venture Capital Market Revenue (Million) Forecast, by Application 2020 & 2033
- Table 14: Argentina MEA Venture Capital Market Revenue (Million) Forecast, by Application 2020 & 2033
- Table 15: Rest of South America MEA Venture Capital Market Revenue (Million) Forecast, by Application 2020 & 2033
- Table 16: Global MEA Venture Capital Market Revenue Million Forecast, by Type 2020 & 2033
- Table 17: Global MEA Venture Capital Market Revenue Million Forecast, by Industry 2020 & 2033
- Table 18: Global MEA Venture Capital Market Revenue Million Forecast, by Country 2020 & 2033
- Table 19: United Kingdom MEA Venture Capital Market Revenue (Million) Forecast, by Application 2020 & 2033
- Table 20: Germany MEA Venture Capital Market Revenue (Million) Forecast, by Application 2020 & 2033
- Table 21: France MEA Venture Capital Market Revenue (Million) Forecast, by Application 2020 & 2033
- Table 22: Italy MEA Venture Capital Market Revenue (Million) Forecast, by Application 2020 & 2033
- Table 23: Spain MEA Venture Capital Market Revenue (Million) Forecast, by Application 2020 & 2033
- Table 24: Russia MEA Venture Capital Market Revenue (Million) Forecast, by Application 2020 & 2033
- Table 25: Benelux MEA Venture Capital Market Revenue (Million) Forecast, by Application 2020 & 2033
- Table 26: Nordics MEA Venture Capital Market Revenue (Million) Forecast, by Application 2020 & 2033
- Table 27: Rest of Europe MEA Venture Capital Market Revenue (Million) Forecast, by Application 2020 & 2033
- Table 28: Global MEA Venture Capital Market Revenue Million Forecast, by Type 2020 & 2033
- Table 29: Global MEA Venture Capital Market Revenue Million Forecast, by Industry 2020 & 2033
- Table 30: Global MEA Venture Capital Market Revenue Million Forecast, by Country 2020 & 2033
- Table 31: Turkey MEA Venture Capital Market Revenue (Million) Forecast, by Application 2020 & 2033
- Table 32: Israel MEA Venture Capital Market Revenue (Million) Forecast, by Application 2020 & 2033
- Table 33: GCC MEA Venture Capital Market Revenue (Million) Forecast, by Application 2020 & 2033
- Table 34: North Africa MEA Venture Capital Market Revenue (Million) Forecast, by Application 2020 & 2033
- Table 35: South Africa MEA Venture Capital Market Revenue (Million) Forecast, by Application 2020 & 2033
- Table 36: Rest of Middle East & Africa MEA Venture Capital Market Revenue (Million) Forecast, by Application 2020 & 2033
- Table 37: Global MEA Venture Capital Market Revenue Million Forecast, by Type 2020 & 2033
- Table 38: Global MEA Venture Capital Market Revenue Million Forecast, by Industry 2020 & 2033
- Table 39: Global MEA Venture Capital Market Revenue Million Forecast, by Country 2020 & 2033
- Table 40: China MEA Venture Capital Market Revenue (Million) Forecast, by Application 2020 & 2033
- Table 41: India MEA Venture Capital Market Revenue (Million) Forecast, by Application 2020 & 2033
- Table 42: Japan MEA Venture Capital Market Revenue (Million) Forecast, by Application 2020 & 2033
- Table 43: South Korea MEA Venture Capital Market Revenue (Million) Forecast, by Application 2020 & 2033
- Table 44: ASEAN MEA Venture Capital Market Revenue (Million) Forecast, by Application 2020 & 2033
- Table 45: Oceania MEA Venture Capital Market Revenue (Million) Forecast, by Application 2020 & 2033
- Table 46: Rest of Asia Pacific MEA Venture Capital Market Revenue (Million) Forecast, by Application 2020 & 2033
Frequently Asked Questions
1. What is the projected Compound Annual Growth Rate (CAGR) of the MEA Venture Capital Market?
The projected CAGR is approximately 10.20%.
2. Which companies are prominent players in the MEA Venture Capital Market?
Key companies in the market include Nuwa Capital, Wamda Capital, Beyond Capital, Phoenician Funds**List Not Exhaustive, Saudi Venture Capital (SVC), Falt6Labs Bahrain, Global ventures, Vision Ventures, Algebra Ventures, 500 Startups.
3. What are the main segments of the MEA Venture Capital Market?
The market segments include Type, Industry.
4. Can you provide details about the market size?
The market size is estimated to be USD 3.53 Million as of 2022.
5. What are some drivers contributing to market growth?
Leading Share of Passenger Vehicles in Car Sales; Quick Processing of Loan through Digital Banking.
6. What are the notable trends driving market growth?
The United Arab Emirates Attracts Higher Investments in the region.
7. Are there any restraints impacting market growth?
Rising Interest Rates Affecting New Auto Buyers Demand for Loan.
8. Can you provide examples of recent developments in the market?
February 2023: Saudi Venture Capital Investment Company launches a USD 1 million income growth fund. The Company launched a close-ended income and capital growth fund - SVC Sukuk Fund.
9. What pricing options are available for accessing the report?
Pricing options include single-user, multi-user, and enterprise licenses priced at USD 4750, USD 4950, and USD 6800 respectively.
10. Is the market size provided in terms of value or volume?
The market size is provided in terms of value, measured in Million.
11. Are there any specific market keywords associated with the report?
Yes, the market keyword associated with the report is "MEA Venture Capital Market," which aids in identifying and referencing the specific market segment covered.
12. How do I determine which pricing option suits my needs best?
The pricing options vary based on user requirements and access needs. Individual users may opt for single-user licenses, while businesses requiring broader access may choose multi-user or enterprise licenses for cost-effective access to the report.
13. Are there any additional resources or data provided in the MEA Venture Capital Market report?
While the report offers comprehensive insights, it's advisable to review the specific contents or supplementary materials provided to ascertain if additional resources or data are available.
14. How can I stay updated on further developments or reports in the MEA Venture Capital Market?
To stay informed about further developments, trends, and reports in the MEA Venture Capital Market, consider subscribing to industry newsletters, following relevant companies and organizations, or regularly checking reputable industry news sources and publications.
Methodology
Step 1 - Identification of Relevant Samples Size from Population Database


Step 2 - Approaches for Defining Global Market Size (Value, Volume* & Price*)

Note*: In applicable scenarios
Step 3 - Data Sources
Primary Research
- Web Analytics
- Survey Reports
- Research Institute
- Latest Research Reports
- Opinion Leaders
Secondary Research
- Annual Reports
- White Paper
- Latest Press Release
- Industry Association
- Paid Database
- Investor Presentations

Step 4 - Data Triangulation
Involves using different sources of information in order to increase the validity of a study
These sources are likely to be stakeholders in a program - participants, other researchers, program staff, other community members, and so on.
Then we put all data in single framework & apply various statistical tools to find out the dynamic on the market.
During the analysis stage, feedback from the stakeholder groups would be compared to determine areas of agreement as well as areas of divergence