

Key Insights
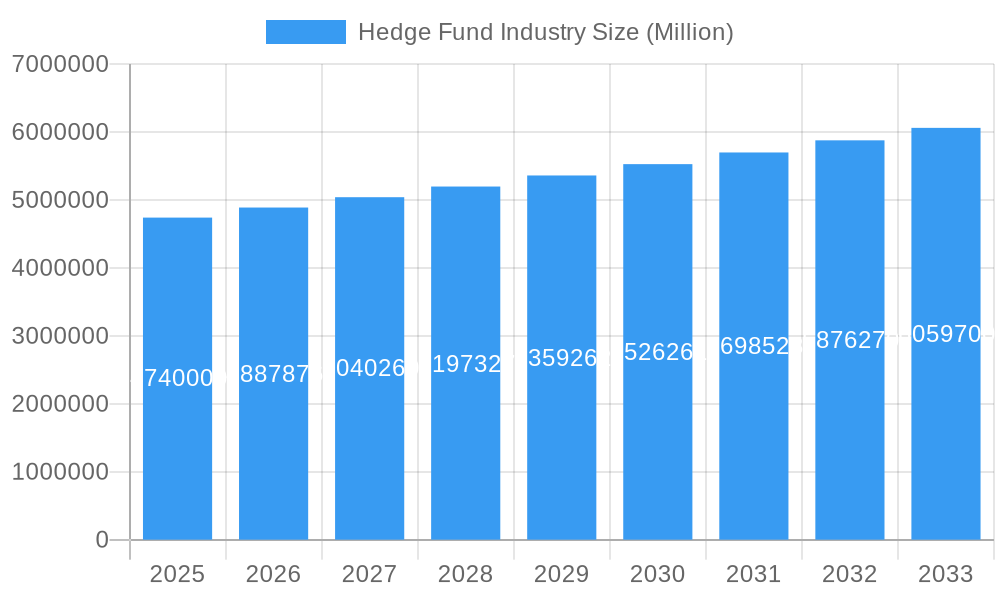
The global hedge fund industry, currently valued at $4.74 trillion (2025), is projected to experience steady growth, exhibiting a Compound Annual Growth Rate (CAGR) of 3.14% from 2025 to 2033. This growth is fueled by several factors. Increasing investor interest in alternative investment strategies, seeking higher returns and diversification beyond traditional markets, is a key driver. Technological advancements, particularly in areas like artificial intelligence and machine learning, are enhancing investment strategies and operational efficiency within the industry. Furthermore, a persistent low-interest-rate environment continues to incentivize investors to seek out higher-yielding alternatives like hedge funds. However, regulatory scrutiny, increased competition, and the inherent risks associated with complex investment strategies pose challenges to sustained growth. The industry's segmentation is likely diverse, encompassing strategies like long-short equity, global macro, distressed debt, and quantitative strategies, each with its own performance drivers and risk profiles. Leading firms like Bridgewater Associates, Renaissance Technologies, and BlackRock Advisors are expected to maintain significant market share, but smaller, specialized firms are also likely contributing significantly to the overall growth.
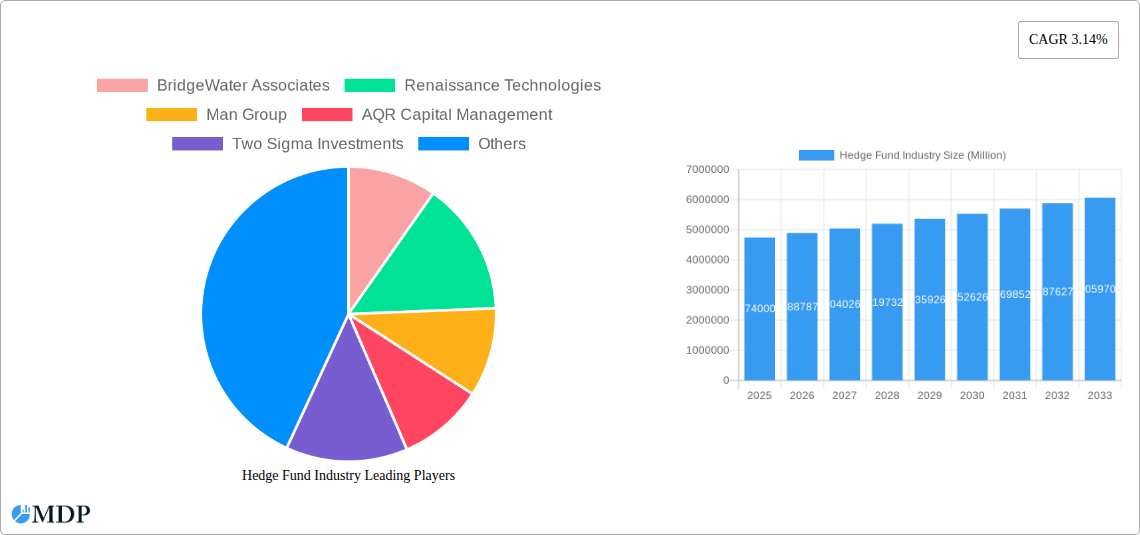
Hedge Fund Industry Market Size (In Million)
The forecast period (2025-2033) suggests a continued expansion, albeit at a moderate pace, reflecting the inherent volatility and cyclical nature of the hedge fund industry. The industry's concentration among a relatively small number of major players, coupled with the high barrier to entry, is expected to remain a defining characteristic. While the emergence of new technologies and strategies offers opportunities for growth, careful risk management and adaptability will be crucial for firms to navigate a dynamic market environment characterized by evolving regulatory landscapes and fluctuating investor sentiment. The geographical distribution of hedge funds is likely concentrated in established financial centers like New York, London, and Hong Kong, but emerging markets may see incremental growth as investors increasingly diversify geographically.
Hedge Fund Industry Company Market Share
Unlock the Secrets of the Hedge Fund Industry: A Comprehensive Market Report (2019-2033)
This in-depth report provides a comprehensive analysis of the Hedge Fund Industry, offering invaluable insights for investors, industry professionals, and strategic decision-makers. With a study period spanning 2019-2033, a base year of 2025, and a forecast period of 2025-2033, this report meticulously examines market dynamics, key players, and future trends. Discover actionable strategies to navigate this dynamic landscape and capitalize on emerging opportunities. The report encompasses a detailed analysis of market concentration, leading players such as Bridgewater Associates, Renaissance Technologies, Man Group, AQR Capital Management, Two Sigma Investments, Millennium Management, Elliot Management, BlackRock Advisors, Citadel, and Davidson Kempner Capital (list not exhaustive), and significant industry developments. The total market size is predicted to reach xx Million by 2033.
Hedge Fund Industry Market Dynamics & Concentration
The Hedge Fund Industry exhibits a high degree of concentration, with a few dominant players controlling a significant market share. In 2024, the top 10 firms held an estimated xx% market share, highlighting the industry's oligopolistic nature. Innovation is driven by the constant pursuit of alpha generation, necessitating advanced quantitative models, sophisticated data analytics, and alternative investment strategies. Regulatory frameworks, such as those governing risk management, transparency, and investor protection, significantly impact industry operations. Product substitutes, including traditional investment vehicles and alternative asset classes, exert competitive pressure. End-user trends, characterized by increasing demand for customized solutions and sophisticated risk management, further shape market dynamics. M&A activity remains robust, with xx major deals recorded in the historical period (2019-2024), reflecting consolidation efforts and strategic expansion among industry players.
- Market Concentration: Top 10 firms held an estimated xx% market share in 2024.
- M&A Activity: xx major deals recorded between 2019-2024.
- Regulatory Landscape: Stringent regulations impacting risk management and transparency.
- Innovation Drivers: Advanced quantitative models, data analytics, and alternative investment strategies.
Hedge Fund Industry Industry Trends & Analysis
The Hedge Fund Industry is characterized by significant growth, driven by several key factors. The Compound Annual Growth Rate (CAGR) from 2019 to 2024 was estimated at xx%, and is projected to reach xx% by 2033. This growth is fueled by factors such as increasing institutional investor participation, the search for higher returns in low-interest-rate environments, and the expanding range of investment strategies available. Technological advancements, such as artificial intelligence (AI) and machine learning (ML), are revolutionizing investment strategies, leading to increased efficiency and improved risk management. Consumer preferences increasingly favor customized investment solutions that cater to specific risk tolerances and investment goals. Intense competition among hedge fund managers drives innovation and efficiency, ensuring a dynamic and ever-evolving market landscape. Market penetration is expected to increase by xx% by 2033.
Leading Markets & Segments in Hedge Fund Industry
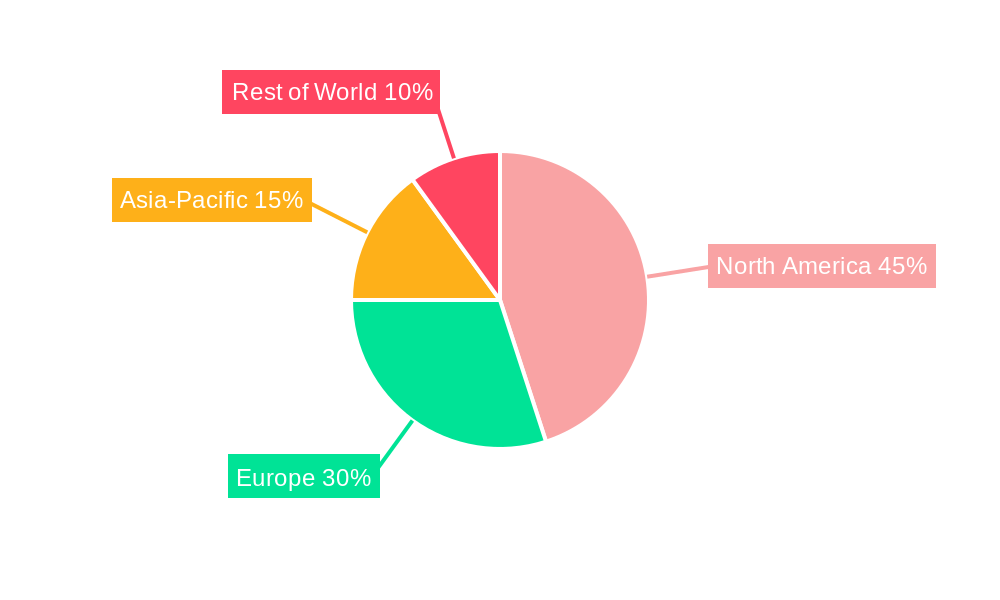
The United States currently dominates the global Hedge Fund Industry, accounting for the largest share of assets under management. Several factors contribute to this dominance:
- Strong Regulatory Framework: While stringent, a well-established framework fosters investor confidence and market stability.
- Deep Capital Markets: Access to substantial capital and sophisticated financial infrastructure are crucial for hedge fund operations.
- Skilled Talent Pool: The US possesses a large concentration of experienced professionals in finance and investment management.
However, other regions like Europe and Asia are experiencing rapid growth, driven by expanding economies, increasing wealth, and rising demand for sophisticated investment solutions. Europe's growth is partially fueled by increased regulations, while Asia’s expansion is driven by rapid economic growth and an emerging middle class with increasing investable assets. The long-short equity strategy segment holds the largest market share.
Hedge Fund Industry Product Developments
Recent product innovations focus on leveraging advanced technologies like AI and machine learning to enhance portfolio construction, risk management, and investment decision-making. These innovations provide competitive advantages by offering improved predictive accuracy, faster execution speeds, and reduced transaction costs. The market is witnessing the rise of alternative data strategies and customized investment solutions catering to specific investor needs. These developments reflect a market that emphasizes efficiency, precision, and tailored solutions.
Key Drivers of Hedge Fund Industry Growth
Several factors propel the growth of the Hedge Fund Industry:
- Technological advancements, including AI and Machine Learning, enable more efficient portfolio management and risk analysis.
- Favorable economic conditions, such as low interest rates (historically), spur demand for higher-yielding alternatives.
- Relaxed regulatory environments in certain regions attract investment and facilitate industry expansion.
Challenges in the Hedge Fund Industry Market
The Hedge Fund Industry faces several challenges:
- Increased regulatory scrutiny leads to higher compliance costs and operational complexities, impacting profitability.
- Supply chain issues related to data acquisition and technology integration can hinder operational efficiency.
- Intense competition among established and emerging players restricts profit margins and limits growth potential. This competition pressures performance and forces constant innovation.
Emerging Opportunities in Hedge Fund Industry
Long-term growth is driven by several factors:
- Technological breakthroughs, such as quantum computing and blockchain technologies, promise further efficiency gains and new investment opportunities.
- Strategic partnerships between hedge funds and fintech companies lead to innovative solutions and improved market access.
- Expansion into new and emerging markets, such as Africa and Latin America, holds significant growth potential.
Leading Players in the Hedge Fund Industry Sector
Key Milestones in Hedge Fund Industry Industry
- November 2022: BlackRock Alternatives acquired Jupiter Power LLC, expanding into the renewable energy sector. This signifies a move towards ESG investing and diversification within the hedge fund industry.
- August 2022: Two Sigma's acquisition of Hivemind Software enhances its data analytics capabilities, improving investment strategies and risk management. This underscores the growing importance of technology in the hedge fund industry.
Strategic Outlook for Hedge Fund Industry Market
The Hedge Fund Industry is poised for continued growth, driven by technological innovation, the increasing complexity of global markets, and the persistent demand for sophisticated investment solutions. Strategic opportunities lie in leveraging emerging technologies like AI and blockchain, forging strategic partnerships to access new data sources and markets, and capitalizing on the increasing demand for ESG-focused investments. This dynamic landscape presents both challenges and opportunities for industry participants.
Hedge Fund Industry Segmentation
-
1. Core Strategy
- 1.1. Equity Strategies
- 1.2. Macro Strategies
- 1.3. Event Driven Strategies
- 1.4. Credit Strategies
- 1.5. Relative Value Strategies
- 1.6. Niche Strategies
- 1.7. Multi-Strategy
- 1.8. Managed Futures/CTA Strategies
-
2. Manager Location
-
2.1. North America
- 2.1.1. United states
- 2.1.2. Canada
- 2.1.3. Mexico
-
2.2. Europe
- 2.2.1. United Kingdom
- 2.2.2. Sweden
- 2.2.3. France
- 2.2.4. Switzerland
- 2.2.5. Rest of Europe
-
2.3. Asia-Pacific
- 2.3.1. Hong Kong
- 2.3.2. Australia
- 2.3.3. Rest of Asia-Pacific
-
2.4. Latin America
- 2.4.1. Brazil
- 2.4.2. Rest of Latin America
-
2.5. Middle East and Africa
- 2.5.1. United Arab Emirates
- 2.5.2. Saudi Arabia
- 2.5.3. Rest of Middle East and Africa
-
2.1. North America
Hedge Fund Industry Segmentation By Geography
-
1. North America
- 1.1. United States
- 1.2. Canada
- 1.3. Mexico
-
2. South America
- 2.1. Brazil
- 2.2. Argentina
- 2.3. Rest of South America
-
3. Europe
- 3.1. United Kingdom
- 3.2. Germany
- 3.3. France
- 3.4. Italy
- 3.5. Spain
- 3.6. Russia
- 3.7. Benelux
- 3.8. Nordics
- 3.9. Rest of Europe
-
4. Middle East & Africa
- 4.1. Turkey
- 4.2. Israel
- 4.3. GCC
- 4.4. North Africa
- 4.5. South Africa
- 4.6. Rest of Middle East & Africa
-
5. Asia Pacific
- 5.1. China
- 5.2. India
- 5.3. Japan
- 5.4. South Korea
- 5.5. ASEAN
- 5.6. Oceania
- 5.7. Rest of Asia Pacific
Hedge Fund Industry Regional Market Share
Geographic Coverage of Hedge Fund Industry
Hedge Fund Industry REPORT HIGHLIGHTS
| Aspects | Details |
|---|---|
| Study Period | 2020-2034 |
| Base Year | 2025 |
| Estimated Year | 2026 |
| Forecast Period | 2026-2034 |
| Historical Period | 2020-2025 |
| Growth Rate | CAGR of 3.14% from 2020-2034 |
| Segmentation |
|
Table of Contents
- 1. Introduction
- 1.1. Research Scope
- 1.2. Market Segmentation
- 1.3. Research Objective
- 1.4. Definitions and Assumptions
- 2. Executive Summary
- 2.1. Market Snapshot
- 3. Market Dynamics
- 3.1. Market Drivers
- 3.2. Market Restrains
- 3.3. Market Trends
- 3.4. Market Opportunities
- 4. Market Factor Analysis
- 4.1. Porters Five Forces
- 4.1.1. Bargaining Power of Suppliers
- 4.1.2. Bargaining Power of Buyers
- 4.1.3. Threat of New Entrants
- 4.1.4. Threat of Substitutes
- 4.1.5. Competitive Rivalry
- 4.2. PESTEL analysis
- 4.3. BCG Analysis
- 4.3.1. Stars (High Growth, High Market Share)
- 4.3.2. Cash Cows (Low Growth, High Market Share)
- 4.3.3. Question Mark (High Growth, Low Market Share)
- 4.3.4. Dogs (Low Growth, Low Market Share)
- 4.4. Ansoff Matrix Analysis
- 4.5. Supply Chain Analysis
- 4.6. Regulatory Landscape
- 4.7. Current Market Potential and Opportunity Assessment (TAM–SAM–SOM Framework)
- 4.8. MDP Analyst Note
- 4.1. Porters Five Forces
- 5. Market Analysis, Insights and Forecast 2021-2033
- 5.1. Market Analysis, Insights and Forecast - by Core Strategy
- 5.1.1. Equity Strategies
- 5.1.2. Macro Strategies
- 5.1.3. Event Driven Strategies
- 5.1.4. Credit Strategies
- 5.1.5. Relative Value Strategies
- 5.1.6. Niche Strategies
- 5.1.7. Multi-Strategy
- 5.1.8. Managed Futures/CTA Strategies
- 5.2. Market Analysis, Insights and Forecast - by Manager Location
- 5.2.1. North America
- 5.2.1.1. United states
- 5.2.1.2. Canada
- 5.2.1.3. Mexico
- 5.2.2. Europe
- 5.2.2.1. United Kingdom
- 5.2.2.2. Sweden
- 5.2.2.3. France
- 5.2.2.4. Switzerland
- 5.2.2.5. Rest of Europe
- 5.2.3. Asia-Pacific
- 5.2.3.1. Hong Kong
- 5.2.3.2. Australia
- 5.2.3.3. Rest of Asia-Pacific
- 5.2.4. Latin America
- 5.2.4.1. Brazil
- 5.2.4.2. Rest of Latin America
- 5.2.5. Middle East and Africa
- 5.2.5.1. United Arab Emirates
- 5.2.5.2. Saudi Arabia
- 5.2.5.3. Rest of Middle East and Africa
- 5.2.1. North America
- 5.3. Market Analysis, Insights and Forecast - by Region
- 5.3.1. North America
- 5.3.2. South America
- 5.3.3. Europe
- 5.3.4. Middle East & Africa
- 5.3.5. Asia Pacific
- 5.1. Market Analysis, Insights and Forecast - by Core Strategy
- 6. Global Hedge Fund Industry Analysis, Insights and Forecast, 2021-2033
- 6.1. Market Analysis, Insights and Forecast - by Core Strategy
- 6.1.1. Equity Strategies
- 6.1.2. Macro Strategies
- 6.1.3. Event Driven Strategies
- 6.1.4. Credit Strategies
- 6.1.5. Relative Value Strategies
- 6.1.6. Niche Strategies
- 6.1.7. Multi-Strategy
- 6.1.8. Managed Futures/CTA Strategies
- 6.2. Market Analysis, Insights and Forecast - by Manager Location
- 6.2.1. North America
- 6.2.1.1. United states
- 6.2.1.2. Canada
- 6.2.1.3. Mexico
- 6.2.2. Europe
- 6.2.2.1. United Kingdom
- 6.2.2.2. Sweden
- 6.2.2.3. France
- 6.2.2.4. Switzerland
- 6.2.2.5. Rest of Europe
- 6.2.3. Asia-Pacific
- 6.2.3.1. Hong Kong
- 6.2.3.2. Australia
- 6.2.3.3. Rest of Asia-Pacific
- 6.2.4. Latin America
- 6.2.4.1. Brazil
- 6.2.4.2. Rest of Latin America
- 6.2.5. Middle East and Africa
- 6.2.5.1. United Arab Emirates
- 6.2.5.2. Saudi Arabia
- 6.2.5.3. Rest of Middle East and Africa
- 6.2.1. North America
- 6.1. Market Analysis, Insights and Forecast - by Core Strategy
- 7. North America Hedge Fund Industry Analysis, Insights and Forecast, 2020-2032
- 7.1. Market Analysis, Insights and Forecast - by Core Strategy
- 7.1.1. Equity Strategies
- 7.1.2. Macro Strategies
- 7.1.3. Event Driven Strategies
- 7.1.4. Credit Strategies
- 7.1.5. Relative Value Strategies
- 7.1.6. Niche Strategies
- 7.1.7. Multi-Strategy
- 7.1.8. Managed Futures/CTA Strategies
- 7.2. Market Analysis, Insights and Forecast - by Manager Location
- 7.2.1. North America
- 7.2.1.1. United states
- 7.2.1.2. Canada
- 7.2.1.3. Mexico
- 7.2.2. Europe
- 7.2.2.1. United Kingdom
- 7.2.2.2. Sweden
- 7.2.2.3. France
- 7.2.2.4. Switzerland
- 7.2.2.5. Rest of Europe
- 7.2.3. Asia-Pacific
- 7.2.3.1. Hong Kong
- 7.2.3.2. Australia
- 7.2.3.3. Rest of Asia-Pacific
- 7.2.4. Latin America
- 7.2.4.1. Brazil
- 7.2.4.2. Rest of Latin America
- 7.2.5. Middle East and Africa
- 7.2.5.1. United Arab Emirates
- 7.2.5.2. Saudi Arabia
- 7.2.5.3. Rest of Middle East and Africa
- 7.2.1. North America
- 7.1. Market Analysis, Insights and Forecast - by Core Strategy
- 8. South America Hedge Fund Industry Analysis, Insights and Forecast, 2020-2032
- 8.1. Market Analysis, Insights and Forecast - by Core Strategy
- 8.1.1. Equity Strategies
- 8.1.2. Macro Strategies
- 8.1.3. Event Driven Strategies
- 8.1.4. Credit Strategies
- 8.1.5. Relative Value Strategies
- 8.1.6. Niche Strategies
- 8.1.7. Multi-Strategy
- 8.1.8. Managed Futures/CTA Strategies
- 8.2. Market Analysis, Insights and Forecast - by Manager Location
- 8.2.1. North America
- 8.2.1.1. United states
- 8.2.1.2. Canada
- 8.2.1.3. Mexico
- 8.2.2. Europe
- 8.2.2.1. United Kingdom
- 8.2.2.2. Sweden
- 8.2.2.3. France
- 8.2.2.4. Switzerland
- 8.2.2.5. Rest of Europe
- 8.2.3. Asia-Pacific
- 8.2.3.1. Hong Kong
- 8.2.3.2. Australia
- 8.2.3.3. Rest of Asia-Pacific
- 8.2.4. Latin America
- 8.2.4.1. Brazil
- 8.2.4.2. Rest of Latin America
- 8.2.5. Middle East and Africa
- 8.2.5.1. United Arab Emirates
- 8.2.5.2. Saudi Arabia
- 8.2.5.3. Rest of Middle East and Africa
- 8.2.1. North America
- 8.1. Market Analysis, Insights and Forecast - by Core Strategy
- 9. Europe Hedge Fund Industry Analysis, Insights and Forecast, 2020-2032
- 9.1. Market Analysis, Insights and Forecast - by Core Strategy
- 9.1.1. Equity Strategies
- 9.1.2. Macro Strategies
- 9.1.3. Event Driven Strategies
- 9.1.4. Credit Strategies
- 9.1.5. Relative Value Strategies
- 9.1.6. Niche Strategies
- 9.1.7. Multi-Strategy
- 9.1.8. Managed Futures/CTA Strategies
- 9.2. Market Analysis, Insights and Forecast - by Manager Location
- 9.2.1. North America
- 9.2.1.1. United states
- 9.2.1.2. Canada
- 9.2.1.3. Mexico
- 9.2.2. Europe
- 9.2.2.1. United Kingdom
- 9.2.2.2. Sweden
- 9.2.2.3. France
- 9.2.2.4. Switzerland
- 9.2.2.5. Rest of Europe
- 9.2.3. Asia-Pacific
- 9.2.3.1. Hong Kong
- 9.2.3.2. Australia
- 9.2.3.3. Rest of Asia-Pacific
- 9.2.4. Latin America
- 9.2.4.1. Brazil
- 9.2.4.2. Rest of Latin America
- 9.2.5. Middle East and Africa
- 9.2.5.1. United Arab Emirates
- 9.2.5.2. Saudi Arabia
- 9.2.5.3. Rest of Middle East and Africa
- 9.2.1. North America
- 9.1. Market Analysis, Insights and Forecast - by Core Strategy
- 10. Middle East & Africa Hedge Fund Industry Analysis, Insights and Forecast, 2020-2032
- 10.1. Market Analysis, Insights and Forecast - by Core Strategy
- 10.1.1. Equity Strategies
- 10.1.2. Macro Strategies
- 10.1.3. Event Driven Strategies
- 10.1.4. Credit Strategies
- 10.1.5. Relative Value Strategies
- 10.1.6. Niche Strategies
- 10.1.7. Multi-Strategy
- 10.1.8. Managed Futures/CTA Strategies
- 10.2. Market Analysis, Insights and Forecast - by Manager Location
- 10.2.1. North America
- 10.2.1.1. United states
- 10.2.1.2. Canada
- 10.2.1.3. Mexico
- 10.2.2. Europe
- 10.2.2.1. United Kingdom
- 10.2.2.2. Sweden
- 10.2.2.3. France
- 10.2.2.4. Switzerland
- 10.2.2.5. Rest of Europe
- 10.2.3. Asia-Pacific
- 10.2.3.1. Hong Kong
- 10.2.3.2. Australia
- 10.2.3.3. Rest of Asia-Pacific
- 10.2.4. Latin America
- 10.2.4.1. Brazil
- 10.2.4.2. Rest of Latin America
- 10.2.5. Middle East and Africa
- 10.2.5.1. United Arab Emirates
- 10.2.5.2. Saudi Arabia
- 10.2.5.3. Rest of Middle East and Africa
- 10.2.1. North America
- 10.1. Market Analysis, Insights and Forecast - by Core Strategy
- 11. Asia Pacific Hedge Fund Industry Analysis, Insights and Forecast, 2020-2032
- 11.1. Market Analysis, Insights and Forecast - by Core Strategy
- 11.1.1. Equity Strategies
- 11.1.2. Macro Strategies
- 11.1.3. Event Driven Strategies
- 11.1.4. Credit Strategies
- 11.1.5. Relative Value Strategies
- 11.1.6. Niche Strategies
- 11.1.7. Multi-Strategy
- 11.1.8. Managed Futures/CTA Strategies
- 11.2. Market Analysis, Insights and Forecast - by Manager Location
- 11.2.1. North America
- 11.2.1.1. United states
- 11.2.1.2. Canada
- 11.2.1.3. Mexico
- 11.2.2. Europe
- 11.2.2.1. United Kingdom
- 11.2.2.2. Sweden
- 11.2.2.3. France
- 11.2.2.4. Switzerland
- 11.2.2.5. Rest of Europe
- 11.2.3. Asia-Pacific
- 11.2.3.1. Hong Kong
- 11.2.3.2. Australia
- 11.2.3.3. Rest of Asia-Pacific
- 11.2.4. Latin America
- 11.2.4.1. Brazil
- 11.2.4.2. Rest of Latin America
- 11.2.5. Middle East and Africa
- 11.2.5.1. United Arab Emirates
- 11.2.5.2. Saudi Arabia
- 11.2.5.3. Rest of Middle East and Africa
- 11.2.1. North America
- 11.1. Market Analysis, Insights and Forecast - by Core Strategy
- 12. Competitive Analysis
- 12.1. Company Profiles
- 12.1.1 BridgeWater Associates
- 12.1.1.1. Company Overview
- 12.1.1.2. Products
- 12.1.1.3. Company Financials
- 12.1.1.4. SWOT Analysis
- 12.1.2 Renaissance Technologies
- 12.1.2.1. Company Overview
- 12.1.2.2. Products
- 12.1.2.3. Company Financials
- 12.1.2.4. SWOT Analysis
- 12.1.3 Man Group
- 12.1.3.1. Company Overview
- 12.1.3.2. Products
- 12.1.3.3. Company Financials
- 12.1.3.4. SWOT Analysis
- 12.1.4 AQR Capital Management
- 12.1.4.1. Company Overview
- 12.1.4.2. Products
- 12.1.4.3. Company Financials
- 12.1.4.4. SWOT Analysis
- 12.1.5 Two Sigma Investments
- 12.1.5.1. Company Overview
- 12.1.5.2. Products
- 12.1.5.3. Company Financials
- 12.1.5.4. SWOT Analysis
- 12.1.6 Millennium Management
- 12.1.6.1. Company Overview
- 12.1.6.2. Products
- 12.1.6.3. Company Financials
- 12.1.6.4. SWOT Analysis
- 12.1.7 Elliot Management
- 12.1.7.1. Company Overview
- 12.1.7.2. Products
- 12.1.7.3. Company Financials
- 12.1.7.4. SWOT Analysis
- 12.1.8 BlackRock Advisors
- 12.1.8.1. Company Overview
- 12.1.8.2. Products
- 12.1.8.3. Company Financials
- 12.1.8.4. SWOT Analysis
- 12.1.9 Citadel
- 12.1.9.1. Company Overview
- 12.1.9.2. Products
- 12.1.9.3. Company Financials
- 12.1.9.4. SWOT Analysis
- 12.1.10 Davidson Kempner Capital**List Not Exhaustive
- 12.1.10.1. Company Overview
- 12.1.10.2. Products
- 12.1.10.3. Company Financials
- 12.1.10.4. SWOT Analysis
- 12.1.1 BridgeWater Associates
- 12.2. Market Entropy
- 12.2.1 Company's Key Areas Served
- 12.2.2 Recent Developments
- 12.3. Company Market Share Analysis 2025
- 12.3.1 Top 5 Companies Market Share Analysis
- 12.3.2 Top 3 Companies Market Share Analysis
- 12.4. List of Potential Customers
- 13. Research Methodology
List of Figures
- Figure 1: Global Hedge Fund Industry Revenue Breakdown (Million, %) by Region 2025 & 2033
- Figure 2: Global Hedge Fund Industry Volume Breakdown (Trillion, %) by Region 2025 & 2033
- Figure 3: North America Hedge Fund Industry Revenue (Million), by Core Strategy 2025 & 2033
- Figure 4: North America Hedge Fund Industry Volume (Trillion), by Core Strategy 2025 & 2033
- Figure 5: North America Hedge Fund Industry Revenue Share (%), by Core Strategy 2025 & 2033
- Figure 6: North America Hedge Fund Industry Volume Share (%), by Core Strategy 2025 & 2033
- Figure 7: North America Hedge Fund Industry Revenue (Million), by Manager Location 2025 & 2033
- Figure 8: North America Hedge Fund Industry Volume (Trillion), by Manager Location 2025 & 2033
- Figure 9: North America Hedge Fund Industry Revenue Share (%), by Manager Location 2025 & 2033
- Figure 10: North America Hedge Fund Industry Volume Share (%), by Manager Location 2025 & 2033
- Figure 11: North America Hedge Fund Industry Revenue (Million), by Country 2025 & 2033
- Figure 12: North America Hedge Fund Industry Volume (Trillion), by Country 2025 & 2033
- Figure 13: North America Hedge Fund Industry Revenue Share (%), by Country 2025 & 2033
- Figure 14: North America Hedge Fund Industry Volume Share (%), by Country 2025 & 2033
- Figure 15: South America Hedge Fund Industry Revenue (Million), by Core Strategy 2025 & 2033
- Figure 16: South America Hedge Fund Industry Volume (Trillion), by Core Strategy 2025 & 2033
- Figure 17: South America Hedge Fund Industry Revenue Share (%), by Core Strategy 2025 & 2033
- Figure 18: South America Hedge Fund Industry Volume Share (%), by Core Strategy 2025 & 2033
- Figure 19: South America Hedge Fund Industry Revenue (Million), by Manager Location 2025 & 2033
- Figure 20: South America Hedge Fund Industry Volume (Trillion), by Manager Location 2025 & 2033
- Figure 21: South America Hedge Fund Industry Revenue Share (%), by Manager Location 2025 & 2033
- Figure 22: South America Hedge Fund Industry Volume Share (%), by Manager Location 2025 & 2033
- Figure 23: South America Hedge Fund Industry Revenue (Million), by Country 2025 & 2033
- Figure 24: South America Hedge Fund Industry Volume (Trillion), by Country 2025 & 2033
- Figure 25: South America Hedge Fund Industry Revenue Share (%), by Country 2025 & 2033
- Figure 26: South America Hedge Fund Industry Volume Share (%), by Country 2025 & 2033
- Figure 27: Europe Hedge Fund Industry Revenue (Million), by Core Strategy 2025 & 2033
- Figure 28: Europe Hedge Fund Industry Volume (Trillion), by Core Strategy 2025 & 2033
- Figure 29: Europe Hedge Fund Industry Revenue Share (%), by Core Strategy 2025 & 2033
- Figure 30: Europe Hedge Fund Industry Volume Share (%), by Core Strategy 2025 & 2033
- Figure 31: Europe Hedge Fund Industry Revenue (Million), by Manager Location 2025 & 2033
- Figure 32: Europe Hedge Fund Industry Volume (Trillion), by Manager Location 2025 & 2033
- Figure 33: Europe Hedge Fund Industry Revenue Share (%), by Manager Location 2025 & 2033
- Figure 34: Europe Hedge Fund Industry Volume Share (%), by Manager Location 2025 & 2033
- Figure 35: Europe Hedge Fund Industry Revenue (Million), by Country 2025 & 2033
- Figure 36: Europe Hedge Fund Industry Volume (Trillion), by Country 2025 & 2033
- Figure 37: Europe Hedge Fund Industry Revenue Share (%), by Country 2025 & 2033
- Figure 38: Europe Hedge Fund Industry Volume Share (%), by Country 2025 & 2033
- Figure 39: Middle East & Africa Hedge Fund Industry Revenue (Million), by Core Strategy 2025 & 2033
- Figure 40: Middle East & Africa Hedge Fund Industry Volume (Trillion), by Core Strategy 2025 & 2033
- Figure 41: Middle East & Africa Hedge Fund Industry Revenue Share (%), by Core Strategy 2025 & 2033
- Figure 42: Middle East & Africa Hedge Fund Industry Volume Share (%), by Core Strategy 2025 & 2033
- Figure 43: Middle East & Africa Hedge Fund Industry Revenue (Million), by Manager Location 2025 & 2033
- Figure 44: Middle East & Africa Hedge Fund Industry Volume (Trillion), by Manager Location 2025 & 2033
- Figure 45: Middle East & Africa Hedge Fund Industry Revenue Share (%), by Manager Location 2025 & 2033
- Figure 46: Middle East & Africa Hedge Fund Industry Volume Share (%), by Manager Location 2025 & 2033
- Figure 47: Middle East & Africa Hedge Fund Industry Revenue (Million), by Country 2025 & 2033
- Figure 48: Middle East & Africa Hedge Fund Industry Volume (Trillion), by Country 2025 & 2033
- Figure 49: Middle East & Africa Hedge Fund Industry Revenue Share (%), by Country 2025 & 2033
- Figure 50: Middle East & Africa Hedge Fund Industry Volume Share (%), by Country 2025 & 2033
- Figure 51: Asia Pacific Hedge Fund Industry Revenue (Million), by Core Strategy 2025 & 2033
- Figure 52: Asia Pacific Hedge Fund Industry Volume (Trillion), by Core Strategy 2025 & 2033
- Figure 53: Asia Pacific Hedge Fund Industry Revenue Share (%), by Core Strategy 2025 & 2033
- Figure 54: Asia Pacific Hedge Fund Industry Volume Share (%), by Core Strategy 2025 & 2033
- Figure 55: Asia Pacific Hedge Fund Industry Revenue (Million), by Manager Location 2025 & 2033
- Figure 56: Asia Pacific Hedge Fund Industry Volume (Trillion), by Manager Location 2025 & 2033
- Figure 57: Asia Pacific Hedge Fund Industry Revenue Share (%), by Manager Location 2025 & 2033
- Figure 58: Asia Pacific Hedge Fund Industry Volume Share (%), by Manager Location 2025 & 2033
- Figure 59: Asia Pacific Hedge Fund Industry Revenue (Million), by Country 2025 & 2033
- Figure 60: Asia Pacific Hedge Fund Industry Volume (Trillion), by Country 2025 & 2033
- Figure 61: Asia Pacific Hedge Fund Industry Revenue Share (%), by Country 2025 & 2033
- Figure 62: Asia Pacific Hedge Fund Industry Volume Share (%), by Country 2025 & 2033
List of Tables
- Table 1: Global Hedge Fund Industry Revenue Million Forecast, by Core Strategy 2020 & 2033
- Table 2: Global Hedge Fund Industry Volume Trillion Forecast, by Core Strategy 2020 & 2033
- Table 3: Global Hedge Fund Industry Revenue Million Forecast, by Manager Location 2020 & 2033
- Table 4: Global Hedge Fund Industry Volume Trillion Forecast, by Manager Location 2020 & 2033
- Table 5: Global Hedge Fund Industry Revenue Million Forecast, by Region 2020 & 2033
- Table 6: Global Hedge Fund Industry Volume Trillion Forecast, by Region 2020 & 2033
- Table 7: Global Hedge Fund Industry Revenue Million Forecast, by Core Strategy 2020 & 2033
- Table 8: Global Hedge Fund Industry Volume Trillion Forecast, by Core Strategy 2020 & 2033
- Table 9: Global Hedge Fund Industry Revenue Million Forecast, by Manager Location 2020 & 2033
- Table 10: Global Hedge Fund Industry Volume Trillion Forecast, by Manager Location 2020 & 2033
- Table 11: Global Hedge Fund Industry Revenue Million Forecast, by Country 2020 & 2033
- Table 12: Global Hedge Fund Industry Volume Trillion Forecast, by Country 2020 & 2033
- Table 13: United States Hedge Fund Industry Revenue (Million) Forecast, by Application 2020 & 2033
- Table 14: United States Hedge Fund Industry Volume (Trillion) Forecast, by Application 2020 & 2033
- Table 15: Canada Hedge Fund Industry Revenue (Million) Forecast, by Application 2020 & 2033
- Table 16: Canada Hedge Fund Industry Volume (Trillion) Forecast, by Application 2020 & 2033
- Table 17: Mexico Hedge Fund Industry Revenue (Million) Forecast, by Application 2020 & 2033
- Table 18: Mexico Hedge Fund Industry Volume (Trillion) Forecast, by Application 2020 & 2033
- Table 19: Global Hedge Fund Industry Revenue Million Forecast, by Core Strategy 2020 & 2033
- Table 20: Global Hedge Fund Industry Volume Trillion Forecast, by Core Strategy 2020 & 2033
- Table 21: Global Hedge Fund Industry Revenue Million Forecast, by Manager Location 2020 & 2033
- Table 22: Global Hedge Fund Industry Volume Trillion Forecast, by Manager Location 2020 & 2033
- Table 23: Global Hedge Fund Industry Revenue Million Forecast, by Country 2020 & 2033
- Table 24: Global Hedge Fund Industry Volume Trillion Forecast, by Country 2020 & 2033
- Table 25: Brazil Hedge Fund Industry Revenue (Million) Forecast, by Application 2020 & 2033
- Table 26: Brazil Hedge Fund Industry Volume (Trillion) Forecast, by Application 2020 & 2033
- Table 27: Argentina Hedge Fund Industry Revenue (Million) Forecast, by Application 2020 & 2033
- Table 28: Argentina Hedge Fund Industry Volume (Trillion) Forecast, by Application 2020 & 2033
- Table 29: Rest of South America Hedge Fund Industry Revenue (Million) Forecast, by Application 2020 & 2033
- Table 30: Rest of South America Hedge Fund Industry Volume (Trillion) Forecast, by Application 2020 & 2033
- Table 31: Global Hedge Fund Industry Revenue Million Forecast, by Core Strategy 2020 & 2033
- Table 32: Global Hedge Fund Industry Volume Trillion Forecast, by Core Strategy 2020 & 2033
- Table 33: Global Hedge Fund Industry Revenue Million Forecast, by Manager Location 2020 & 2033
- Table 34: Global Hedge Fund Industry Volume Trillion Forecast, by Manager Location 2020 & 2033
- Table 35: Global Hedge Fund Industry Revenue Million Forecast, by Country 2020 & 2033
- Table 36: Global Hedge Fund Industry Volume Trillion Forecast, by Country 2020 & 2033
- Table 37: United Kingdom Hedge Fund Industry Revenue (Million) Forecast, by Application 2020 & 2033
- Table 38: United Kingdom Hedge Fund Industry Volume (Trillion) Forecast, by Application 2020 & 2033
- Table 39: Germany Hedge Fund Industry Revenue (Million) Forecast, by Application 2020 & 2033
- Table 40: Germany Hedge Fund Industry Volume (Trillion) Forecast, by Application 2020 & 2033
- Table 41: France Hedge Fund Industry Revenue (Million) Forecast, by Application 2020 & 2033
- Table 42: France Hedge Fund Industry Volume (Trillion) Forecast, by Application 2020 & 2033
- Table 43: Italy Hedge Fund Industry Revenue (Million) Forecast, by Application 2020 & 2033
- Table 44: Italy Hedge Fund Industry Volume (Trillion) Forecast, by Application 2020 & 2033
- Table 45: Spain Hedge Fund Industry Revenue (Million) Forecast, by Application 2020 & 2033
- Table 46: Spain Hedge Fund Industry Volume (Trillion) Forecast, by Application 2020 & 2033
- Table 47: Russia Hedge Fund Industry Revenue (Million) Forecast, by Application 2020 & 2033
- Table 48: Russia Hedge Fund Industry Volume (Trillion) Forecast, by Application 2020 & 2033
- Table 49: Benelux Hedge Fund Industry Revenue (Million) Forecast, by Application 2020 & 2033
- Table 50: Benelux Hedge Fund Industry Volume (Trillion) Forecast, by Application 2020 & 2033
- Table 51: Nordics Hedge Fund Industry Revenue (Million) Forecast, by Application 2020 & 2033
- Table 52: Nordics Hedge Fund Industry Volume (Trillion) Forecast, by Application 2020 & 2033
- Table 53: Rest of Europe Hedge Fund Industry Revenue (Million) Forecast, by Application 2020 & 2033
- Table 54: Rest of Europe Hedge Fund Industry Volume (Trillion) Forecast, by Application 2020 & 2033
- Table 55: Global Hedge Fund Industry Revenue Million Forecast, by Core Strategy 2020 & 2033
- Table 56: Global Hedge Fund Industry Volume Trillion Forecast, by Core Strategy 2020 & 2033
- Table 57: Global Hedge Fund Industry Revenue Million Forecast, by Manager Location 2020 & 2033
- Table 58: Global Hedge Fund Industry Volume Trillion Forecast, by Manager Location 2020 & 2033
- Table 59: Global Hedge Fund Industry Revenue Million Forecast, by Country 2020 & 2033
- Table 60: Global Hedge Fund Industry Volume Trillion Forecast, by Country 2020 & 2033
- Table 61: Turkey Hedge Fund Industry Revenue (Million) Forecast, by Application 2020 & 2033
- Table 62: Turkey Hedge Fund Industry Volume (Trillion) Forecast, by Application 2020 & 2033
- Table 63: Israel Hedge Fund Industry Revenue (Million) Forecast, by Application 2020 & 2033
- Table 64: Israel Hedge Fund Industry Volume (Trillion) Forecast, by Application 2020 & 2033
- Table 65: GCC Hedge Fund Industry Revenue (Million) Forecast, by Application 2020 & 2033
- Table 66: GCC Hedge Fund Industry Volume (Trillion) Forecast, by Application 2020 & 2033
- Table 67: North Africa Hedge Fund Industry Revenue (Million) Forecast, by Application 2020 & 2033
- Table 68: North Africa Hedge Fund Industry Volume (Trillion) Forecast, by Application 2020 & 2033
- Table 69: South Africa Hedge Fund Industry Revenue (Million) Forecast, by Application 2020 & 2033
- Table 70: South Africa Hedge Fund Industry Volume (Trillion) Forecast, by Application 2020 & 2033
- Table 71: Rest of Middle East & Africa Hedge Fund Industry Revenue (Million) Forecast, by Application 2020 & 2033
- Table 72: Rest of Middle East & Africa Hedge Fund Industry Volume (Trillion) Forecast, by Application 2020 & 2033
- Table 73: Global Hedge Fund Industry Revenue Million Forecast, by Core Strategy 2020 & 2033
- Table 74: Global Hedge Fund Industry Volume Trillion Forecast, by Core Strategy 2020 & 2033
- Table 75: Global Hedge Fund Industry Revenue Million Forecast, by Manager Location 2020 & 2033
- Table 76: Global Hedge Fund Industry Volume Trillion Forecast, by Manager Location 2020 & 2033
- Table 77: Global Hedge Fund Industry Revenue Million Forecast, by Country 2020 & 2033
- Table 78: Global Hedge Fund Industry Volume Trillion Forecast, by Country 2020 & 2033
- Table 79: China Hedge Fund Industry Revenue (Million) Forecast, by Application 2020 & 2033
- Table 80: China Hedge Fund Industry Volume (Trillion) Forecast, by Application 2020 & 2033
- Table 81: India Hedge Fund Industry Revenue (Million) Forecast, by Application 2020 & 2033
- Table 82: India Hedge Fund Industry Volume (Trillion) Forecast, by Application 2020 & 2033
- Table 83: Japan Hedge Fund Industry Revenue (Million) Forecast, by Application 2020 & 2033
- Table 84: Japan Hedge Fund Industry Volume (Trillion) Forecast, by Application 2020 & 2033
- Table 85: South Korea Hedge Fund Industry Revenue (Million) Forecast, by Application 2020 & 2033
- Table 86: South Korea Hedge Fund Industry Volume (Trillion) Forecast, by Application 2020 & 2033
- Table 87: ASEAN Hedge Fund Industry Revenue (Million) Forecast, by Application 2020 & 2033
- Table 88: ASEAN Hedge Fund Industry Volume (Trillion) Forecast, by Application 2020 & 2033
- Table 89: Oceania Hedge Fund Industry Revenue (Million) Forecast, by Application 2020 & 2033
- Table 90: Oceania Hedge Fund Industry Volume (Trillion) Forecast, by Application 2020 & 2033
- Table 91: Rest of Asia Pacific Hedge Fund Industry Revenue (Million) Forecast, by Application 2020 & 2033
- Table 92: Rest of Asia Pacific Hedge Fund Industry Volume (Trillion) Forecast, by Application 2020 & 2033
Frequently Asked Questions
1. What is the projected Compound Annual Growth Rate (CAGR) of the Hedge Fund Industry?
The projected CAGR is approximately 3.14%.
2. Which companies are prominent players in the Hedge Fund Industry?
Key companies in the market include BridgeWater Associates, Renaissance Technologies, Man Group, AQR Capital Management, Two Sigma Investments, Millennium Management, Elliot Management, BlackRock Advisors, Citadel, Davidson Kempner Capital**List Not Exhaustive.
3. What are the main segments of the Hedge Fund Industry?
The market segments include Core Strategy, Manager Location.
4. Can you provide details about the market size?
The market size is estimated to be USD 4.74 Million as of 2022.
5. What are some drivers contributing to market growth?
Emerging Demand for Smaller or Newer Fund Managers; Recovering Performance of Existing Hedge Funds.
6. What are the notable trends driving market growth?
Investments in Digital Assets is Driving the Market.
7. Are there any restraints impacting market growth?
Emerging Demand for Smaller or Newer Fund Managers; Recovering Performance of Existing Hedge Funds.
8. Can you provide examples of recent developments in the market?
November 2022: BlackRock Alternatives (BlackRock), through a fund managed by its diversified infrastructure business, agreed to acquire Jupiter Power LLC (Jupiter). Jupiter Power is a leading United States operator and developer of stand-alone, utility-scale battery energy storage systems.
9. What pricing options are available for accessing the report?
Pricing options include single-user, multi-user, and enterprise licenses priced at USD 3800, USD 4500, and USD 5800 respectively.
10. Is the market size provided in terms of value or volume?
The market size is provided in terms of value, measured in Million and volume, measured in Trillion.
11. Are there any specific market keywords associated with the report?
Yes, the market keyword associated with the report is "Hedge Fund Industry," which aids in identifying and referencing the specific market segment covered.
12. How do I determine which pricing option suits my needs best?
The pricing options vary based on user requirements and access needs. Individual users may opt for single-user licenses, while businesses requiring broader access may choose multi-user or enterprise licenses for cost-effective access to the report.
13. Are there any additional resources or data provided in the Hedge Fund Industry report?
While the report offers comprehensive insights, it's advisable to review the specific contents or supplementary materials provided to ascertain if additional resources or data are available.
14. How can I stay updated on further developments or reports in the Hedge Fund Industry?
To stay informed about further developments, trends, and reports in the Hedge Fund Industry, consider subscribing to industry newsletters, following relevant companies and organizations, or regularly checking reputable industry news sources and publications.
Methodology
Step 1 - Identification of Relevant Samples Size from Population Database


Step 2 - Approaches for Defining Global Market Size (Value, Volume* & Price*)

Note*: In applicable scenarios
Step 3 - Data Sources
Primary Research
- Web Analytics
- Survey Reports
- Research Institute
- Latest Research Reports
- Opinion Leaders
Secondary Research
- Annual Reports
- White Paper
- Latest Press Release
- Industry Association
- Paid Database
- Investor Presentations

Step 4 - Data Triangulation
Involves using different sources of information in order to increase the validity of a study
These sources are likely to be stakeholders in a program - participants, other researchers, program staff, other community members, and so on.
Then we put all data in single framework & apply various statistical tools to find out the dynamic on the market.
During the analysis stage, feedback from the stakeholder groups would be compared to determine areas of agreement as well as areas of divergence