

Key Insights
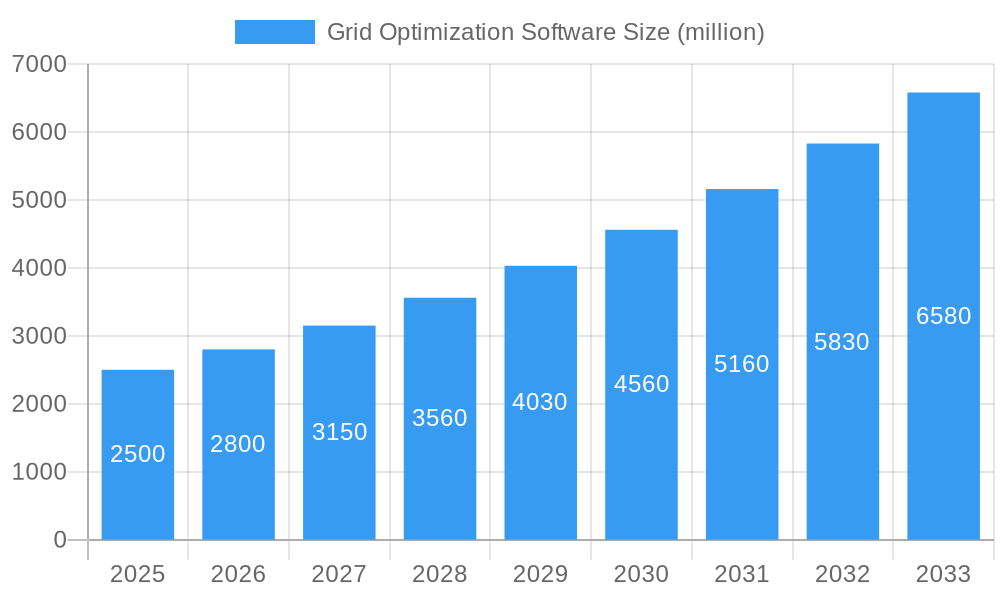
The global grid optimization software market is poised for substantial growth, driven by the escalating demand for resilient and efficient power grids. Key growth catalysts include the widespread adoption of smart grid technologies, supportive government mandates for energy efficiency, and advancements in AI and ML for sophisticated grid management. These innovations enable predictive maintenance, real-time monitoring, and optimized energy distribution, yielding considerable cost reductions and a lower carbon footprint. The market is projected to reach $18 billion by 2025, with a Compound Annual Growth Rate (CAGR) of 10.6% from 2025 to 2033. This upward trajectory is further propelled by the continuous expansion of smart grid infrastructure globally, particularly in rapidly urbanizing and industrializing economies.
Grid Optimization Software Market Size (In Billion)
Challenges such as substantial initial investment and integration complexities with legacy systems may temper immediate adoption. Furthermore, cybersecurity concerns inherent in interconnected, data-intensive environments present a significant hurdle. Nevertheless, the long-term advantages of improved grid reliability, efficiency, and sustainability are anticipated to drive deeper market penetration across transmission, distribution, and generation segments. The market is segmented by software type (SCADA, EMS, OMS), deployment mode (cloud, on-premise), and end-user (utilities, independent power producers). North America and Europe currently lead, with significant future growth anticipated in Asia-Pacific and emerging markets.
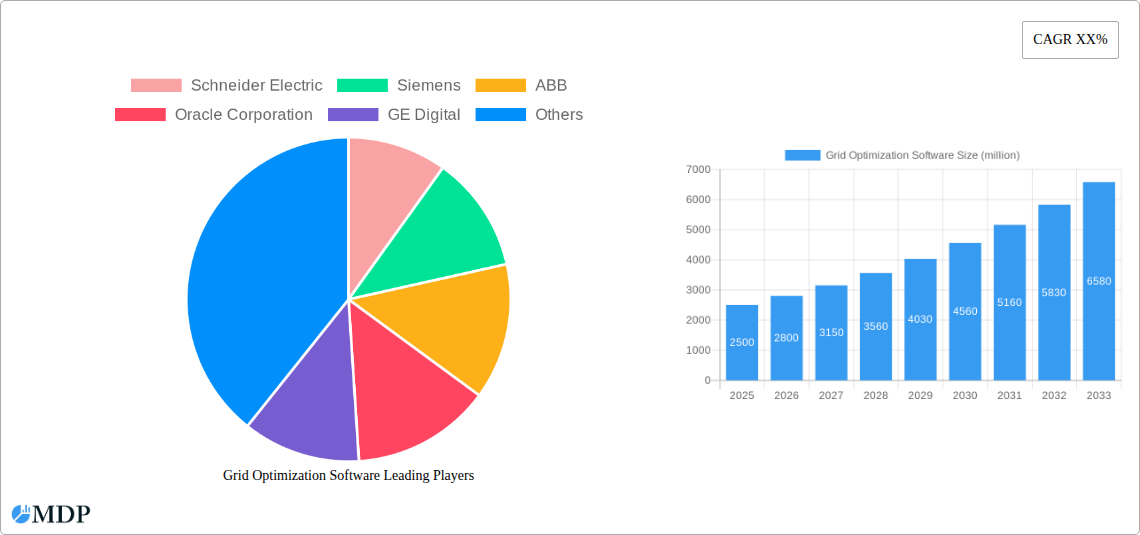
Grid Optimization Software Company Market Share
Grid Optimization Software Market Report: A Comprehensive Analysis (2019-2033)
This comprehensive report provides an in-depth analysis of the global Grid Optimization Software market, projecting a market value exceeding $XX million by 2033. The study covers the period from 2019 to 2033, with a base year of 2025 and a forecast period from 2025 to 2033. It offers actionable insights for industry stakeholders, including leading companies like Schneider Electric, Siemens, ABB, Oracle Corporation, GE Digital, Eaton, Itron Inc, Cisco Systems Inc, Emerson, Intel, IBM, Huawei Enterprise, SKM Systems Analysis, Inc, ETAP, and Plexim. This report is designed for immediate use and requires no further modification.
Grid Optimization Software Market Dynamics & Concentration
The global grid optimization software market is characterized by moderate concentration, with a few major players holding significant market share. In 2025, the top five companies are estimated to collectively account for approximately xx% of the market, driven by their established brand reputation, extensive product portfolios, and strong global presence. However, the market exhibits notable dynamism, fueled by continuous innovation, evolving regulatory frameworks, and the increasing adoption of smart grid technologies.
Market Dynamics:
- Innovation Drivers: Advancements in artificial intelligence (AI), machine learning (ML), and big data analytics are driving the development of sophisticated grid optimization solutions.
- Regulatory Frameworks: Government initiatives promoting renewable energy integration and grid modernization are creating a favorable environment for market expansion.
- Product Substitutes: While there are no direct substitutes, traditional grid management practices pose a competitive challenge, especially in regions with limited digital infrastructure.
- End-User Trends: Utilities are increasingly prioritizing grid optimization to enhance efficiency, reliability, and sustainability, driving demand for advanced software solutions.
- M&A Activities: The market has witnessed a significant number of mergers and acquisitions (M&A) deals in recent years (xx deals in the historical period), reflecting the consolidation trend and strategic expansion efforts by leading players. Market share data for individual companies is unavailable at this time, hence approximated as xx%.
Grid Optimization Software Industry Trends & Analysis
The grid optimization software market is experiencing robust growth, with a projected Compound Annual Growth Rate (CAGR) of xx% during the forecast period (2025-2033). This growth is fueled by several key factors: increasing electricity demand, the integration of renewable energy sources, and the growing need for enhanced grid resilience and efficiency. Technological disruptions, such as the adoption of cloud computing and edge computing, are further accelerating market expansion. Consumer preferences are shifting towards sustainable and reliable energy solutions, pushing utilities to adopt advanced grid management technologies. The competitive landscape is characterized by both intense competition among established players and the emergence of innovative startups offering specialized solutions. Market penetration is expected to reach approximately xx% by 2033, indicating significant growth potential.
Leading Markets & Segments in Grid Optimization Software
The North American region is currently the dominant market for grid optimization software, accounting for a significant share of global revenue in 2025 (estimated xx%). This dominance is primarily attributable to:
- Advanced Infrastructure: North America possesses a well-developed power grid infrastructure, providing a fertile ground for the deployment of advanced grid management technologies.
- Government Support: Strong government support for smart grid initiatives and renewable energy integration is driving market adoption.
- Technological Advancements: The region is a hub for technological innovation, leading to the development of cutting-edge grid optimization solutions.
Other Regions/Segments: While North America leads, significant growth is expected in other regions, particularly Europe and Asia-Pacific, driven by increasing government investments in grid modernization and the expansion of renewable energy capacities. Specific segment data is unavailable at this time.
Grid Optimization Software Product Developments
Recent product innovations in grid optimization software are focused on incorporating AI/ML algorithms for predictive maintenance, advanced analytics for real-time grid monitoring, and enhanced cybersecurity features to protect critical infrastructure. These developments are improving the accuracy and efficiency of grid management, leading to reduced operational costs and enhanced grid reliability. The market is seeing a growing trend towards cloud-based solutions, offering scalability, flexibility, and reduced infrastructure costs. These advancements cater to the evolving needs of utilities seeking to optimize their grid operations while adhering to increasingly stringent regulatory standards.
Key Drivers of Grid Optimization Software Growth
The growth of the grid optimization software market is propelled by a confluence of factors. Technological advancements, such as the development of sophisticated AI/ML algorithms and cloud-based platforms, are enhancing the capabilities of grid optimization solutions. The increasing penetration of renewable energy sources requires advanced grid management tools to ensure stability and efficiency. Stringent government regulations aimed at improving grid reliability and sustainability are further driving market expansion. For example, the increasing emphasis on reducing carbon emissions and enhancing grid resilience is fueling the adoption of advanced grid management tools.
Challenges in the Grid Optimization Software Market
The grid optimization software market faces several challenges. High initial investment costs can be a barrier to entry for smaller utilities. Integration with legacy systems can be complex and time-consuming, requiring substantial investment in IT infrastructure. Cybersecurity threats pose a significant risk, demanding robust security measures to protect critical grid infrastructure. Furthermore, a lack of skilled personnel to operate and maintain these complex systems can hinder widespread adoption. These challenges collectively impact market growth, slowing the rate of penetration compared to the predicted CAGR.
Emerging Opportunities in Grid Optimization Software
Significant opportunities exist for grid optimization software providers to capitalize on technological advancements, such as the integration of blockchain technology for secure data management and the development of advanced digital twin technologies for more accurate grid modeling and simulation. Strategic partnerships with utilities and equipment manufacturers can unlock new market access and facilitate faster adoption. Market expansion into developing economies with rapidly growing energy demand presents significant long-term growth potential. These opportunities will drive growth beyond the projected xx million valuation.
Leading Players in the Grid Optimization Software Sector
- Schneider Electric
- Siemens
- ABB
- Oracle Corporation
- GE Digital
- Eaton
- Itron Inc
- Cisco Systems Inc
- Emerson
- Intel
- IBM
- Huawei Enterprise
- SKM Systems Analysis, Inc
- ETAP
- Plexim
Key Milestones in Grid Optimization Software Industry
- 2020: Increased adoption of cloud-based grid optimization solutions.
- 2021: Significant investments in AI/ML-based grid analytics.
- 2022: Launch of several new grid optimization software platforms with enhanced cybersecurity features.
- 2023: Growing partnerships between software providers and utility companies.
- 2024: Increased focus on integrating renewable energy sources into grid optimization models.
Strategic Outlook for Grid Optimization Software Market
The future of the grid optimization software market is bright, with significant growth potential driven by continued technological advancements, increasing government regulations, and the growing need for efficient and sustainable grid management. Strategic opportunities include expanding into new geographical markets, developing innovative solutions to address specific grid challenges, and forging strategic partnerships to leverage complementary technologies and expertise. These factors will collectively contribute to a substantial increase in market value beyond the initial projected figure.
Grid Optimization Software Segmentation
-
1. Application
- 1.1. Government and Municipalities
- 1.2. Energy and Power Generation
- 1.3. Research and Education
-
2. Types
- 2.1. On-Premises Software
- 2.2. Cloud-Based Software
Grid Optimization Software Segmentation By Geography
-
1. North America
- 1.1. United States
- 1.2. Canada
- 1.3. Mexico
-
2. South America
- 2.1. Brazil
- 2.2. Argentina
- 2.3. Rest of South America
-
3. Europe
- 3.1. United Kingdom
- 3.2. Germany
- 3.3. France
- 3.4. Italy
- 3.5. Spain
- 3.6. Russia
- 3.7. Benelux
- 3.8. Nordics
- 3.9. Rest of Europe
-
4. Middle East & Africa
- 4.1. Turkey
- 4.2. Israel
- 4.3. GCC
- 4.4. North Africa
- 4.5. South Africa
- 4.6. Rest of Middle East & Africa
-
5. Asia Pacific
- 5.1. China
- 5.2. India
- 5.3. Japan
- 5.4. South Korea
- 5.5. ASEAN
- 5.6. Oceania
- 5.7. Rest of Asia Pacific

Grid Optimization Software Regional Market Share
Geographic Coverage of Grid Optimization Software
Grid Optimization Software REPORT HIGHLIGHTS
| Aspects | Details |
|---|---|
| Study Period | 2020-2034 |
| Base Year | 2025 |
| Estimated Year | 2026 |
| Forecast Period | 2026-2034 |
| Historical Period | 2020-2025 |
| Growth Rate | CAGR of 10.6% from 2020-2034 |
| Segmentation |
|
Table of Contents
- 1. Introduction
- 1.1. Research Scope
- 1.2. Market Segmentation
- 1.3. Research Methodology
- 1.4. Definitions and Assumptions
- 2. Executive Summary
- 2.1. Introduction
- 3. Market Dynamics
- 3.1. Introduction
- 3.2. Market Drivers
- 3.3. Market Restrains
- 3.4. Market Trends
- 4. Market Factor Analysis
- 4.1. Porters Five Forces
- 4.2. Supply/Value Chain
- 4.3. PESTEL analysis
- 4.4. Market Entropy
- 4.5. Patent/Trademark Analysis
- 5. Global Grid Optimization Software Analysis, Insights and Forecast, 2020-2032
- 5.1. Market Analysis, Insights and Forecast - by Application
- 5.1.1. Government and Municipalities
- 5.1.2. Energy and Power Generation
- 5.1.3. Research and Education
- 5.2. Market Analysis, Insights and Forecast - by Types
- 5.2.1. On-Premises Software
- 5.2.2. Cloud-Based Software
- 5.3. Market Analysis, Insights and Forecast - by Region
- 5.3.1. North America
- 5.3.2. South America
- 5.3.3. Europe
- 5.3.4. Middle East & Africa
- 5.3.5. Asia Pacific
- 5.1. Market Analysis, Insights and Forecast - by Application
- 6. North America Grid Optimization Software Analysis, Insights and Forecast, 2020-2032
- 6.1. Market Analysis, Insights and Forecast - by Application
- 6.1.1. Government and Municipalities
- 6.1.2. Energy and Power Generation
- 6.1.3. Research and Education
- 6.2. Market Analysis, Insights and Forecast - by Types
- 6.2.1. On-Premises Software
- 6.2.2. Cloud-Based Software
- 6.1. Market Analysis, Insights and Forecast - by Application
- 7. South America Grid Optimization Software Analysis, Insights and Forecast, 2020-2032
- 7.1. Market Analysis, Insights and Forecast - by Application
- 7.1.1. Government and Municipalities
- 7.1.2. Energy and Power Generation
- 7.1.3. Research and Education
- 7.2. Market Analysis, Insights and Forecast - by Types
- 7.2.1. On-Premises Software
- 7.2.2. Cloud-Based Software
- 7.1. Market Analysis, Insights and Forecast - by Application
- 8. Europe Grid Optimization Software Analysis, Insights and Forecast, 2020-2032
- 8.1. Market Analysis, Insights and Forecast - by Application
- 8.1.1. Government and Municipalities
- 8.1.2. Energy and Power Generation
- 8.1.3. Research and Education
- 8.2. Market Analysis, Insights and Forecast - by Types
- 8.2.1. On-Premises Software
- 8.2.2. Cloud-Based Software
- 8.1. Market Analysis, Insights and Forecast - by Application
- 9. Middle East & Africa Grid Optimization Software Analysis, Insights and Forecast, 2020-2032
- 9.1. Market Analysis, Insights and Forecast - by Application
- 9.1.1. Government and Municipalities
- 9.1.2. Energy and Power Generation
- 9.1.3. Research and Education
- 9.2. Market Analysis, Insights and Forecast - by Types
- 9.2.1. On-Premises Software
- 9.2.2. Cloud-Based Software
- 9.1. Market Analysis, Insights and Forecast - by Application
- 10. Asia Pacific Grid Optimization Software Analysis, Insights and Forecast, 2020-2032
- 10.1. Market Analysis, Insights and Forecast - by Application
- 10.1.1. Government and Municipalities
- 10.1.2. Energy and Power Generation
- 10.1.3. Research and Education
- 10.2. Market Analysis, Insights and Forecast - by Types
- 10.2.1. On-Premises Software
- 10.2.2. Cloud-Based Software
- 10.1. Market Analysis, Insights and Forecast - by Application
- 11. Competitive Analysis
- 11.1. Global Market Share Analysis 2025
- 11.2. Company Profiles
- 11.2.1 Schneider Electric
- 11.2.1.1. Overview
- 11.2.1.2. Products
- 11.2.1.3. SWOT Analysis
- 11.2.1.4. Recent Developments
- 11.2.1.5. Financials (Based on Availability)
- 11.2.2 Siemens
- 11.2.2.1. Overview
- 11.2.2.2. Products
- 11.2.2.3. SWOT Analysis
- 11.2.2.4. Recent Developments
- 11.2.2.5. Financials (Based on Availability)
- 11.2.3 ABB
- 11.2.3.1. Overview
- 11.2.3.2. Products
- 11.2.3.3. SWOT Analysis
- 11.2.3.4. Recent Developments
- 11.2.3.5. Financials (Based on Availability)
- 11.2.4 Oracle Corporation
- 11.2.4.1. Overview
- 11.2.4.2. Products
- 11.2.4.3. SWOT Analysis
- 11.2.4.4. Recent Developments
- 11.2.4.5. Financials (Based on Availability)
- 11.2.5 GE Digital
- 11.2.5.1. Overview
- 11.2.5.2. Products
- 11.2.5.3. SWOT Analysis
- 11.2.5.4. Recent Developments
- 11.2.5.5. Financials (Based on Availability)
- 11.2.6 Eaton
- 11.2.6.1. Overview
- 11.2.6.2. Products
- 11.2.6.3. SWOT Analysis
- 11.2.6.4. Recent Developments
- 11.2.6.5. Financials (Based on Availability)
- 11.2.7 Itron Inc
- 11.2.7.1. Overview
- 11.2.7.2. Products
- 11.2.7.3. SWOT Analysis
- 11.2.7.4. Recent Developments
- 11.2.7.5. Financials (Based on Availability)
- 11.2.8 Cisco Systems Inc
- 11.2.8.1. Overview
- 11.2.8.2. Products
- 11.2.8.3. SWOT Analysis
- 11.2.8.4. Recent Developments
- 11.2.8.5. Financials (Based on Availability)
- 11.2.9 Emerson
- 11.2.9.1. Overview
- 11.2.9.2. Products
- 11.2.9.3. SWOT Analysis
- 11.2.9.4. Recent Developments
- 11.2.9.5. Financials (Based on Availability)
- 11.2.10 Intel
- 11.2.10.1. Overview
- 11.2.10.2. Products
- 11.2.10.3. SWOT Analysis
- 11.2.10.4. Recent Developments
- 11.2.10.5. Financials (Based on Availability)
- 11.2.11 IBM
- 11.2.11.1. Overview
- 11.2.11.2. Products
- 11.2.11.3. SWOT Analysis
- 11.2.11.4. Recent Developments
- 11.2.11.5. Financials (Based on Availability)
- 11.2.12 Huawei Enterprise
- 11.2.12.1. Overview
- 11.2.12.2. Products
- 11.2.12.3. SWOT Analysis
- 11.2.12.4. Recent Developments
- 11.2.12.5. Financials (Based on Availability)
- 11.2.13 SKM Systems Analysis
- 11.2.13.1. Overview
- 11.2.13.2. Products
- 11.2.13.3. SWOT Analysis
- 11.2.13.4. Recent Developments
- 11.2.13.5. Financials (Based on Availability)
- 11.2.14 Inc
- 11.2.14.1. Overview
- 11.2.14.2. Products
- 11.2.14.3. SWOT Analysis
- 11.2.14.4. Recent Developments
- 11.2.14.5. Financials (Based on Availability)
- 11.2.15 ETAP
- 11.2.15.1. Overview
- 11.2.15.2. Products
- 11.2.15.3. SWOT Analysis
- 11.2.15.4. Recent Developments
- 11.2.15.5. Financials (Based on Availability)
- 11.2.16 Plexim
- 11.2.16.1. Overview
- 11.2.16.2. Products
- 11.2.16.3. SWOT Analysis
- 11.2.16.4. Recent Developments
- 11.2.16.5. Financials (Based on Availability)
- 11.2.1 Schneider Electric
List of Figures
- Figure 1: Global Grid Optimization Software Revenue Breakdown (billion, %) by Region 2025 & 2033
- Figure 2: North America Grid Optimization Software Revenue (billion), by Application 2025 & 2033
- Figure 3: North America Grid Optimization Software Revenue Share (%), by Application 2025 & 2033
- Figure 4: North America Grid Optimization Software Revenue (billion), by Types 2025 & 2033
- Figure 5: North America Grid Optimization Software Revenue Share (%), by Types 2025 & 2033
- Figure 6: North America Grid Optimization Software Revenue (billion), by Country 2025 & 2033
- Figure 7: North America Grid Optimization Software Revenue Share (%), by Country 2025 & 2033
- Figure 8: South America Grid Optimization Software Revenue (billion), by Application 2025 & 2033
- Figure 9: South America Grid Optimization Software Revenue Share (%), by Application 2025 & 2033
- Figure 10: South America Grid Optimization Software Revenue (billion), by Types 2025 & 2033
- Figure 11: South America Grid Optimization Software Revenue Share (%), by Types 2025 & 2033
- Figure 12: South America Grid Optimization Software Revenue (billion), by Country 2025 & 2033
- Figure 13: South America Grid Optimization Software Revenue Share (%), by Country 2025 & 2033
- Figure 14: Europe Grid Optimization Software Revenue (billion), by Application 2025 & 2033
- Figure 15: Europe Grid Optimization Software Revenue Share (%), by Application 2025 & 2033
- Figure 16: Europe Grid Optimization Software Revenue (billion), by Types 2025 & 2033
- Figure 17: Europe Grid Optimization Software Revenue Share (%), by Types 2025 & 2033
- Figure 18: Europe Grid Optimization Software Revenue (billion), by Country 2025 & 2033
- Figure 19: Europe Grid Optimization Software Revenue Share (%), by Country 2025 & 2033
- Figure 20: Middle East & Africa Grid Optimization Software Revenue (billion), by Application 2025 & 2033
- Figure 21: Middle East & Africa Grid Optimization Software Revenue Share (%), by Application 2025 & 2033
- Figure 22: Middle East & Africa Grid Optimization Software Revenue (billion), by Types 2025 & 2033
- Figure 23: Middle East & Africa Grid Optimization Software Revenue Share (%), by Types 2025 & 2033
- Figure 24: Middle East & Africa Grid Optimization Software Revenue (billion), by Country 2025 & 2033
- Figure 25: Middle East & Africa Grid Optimization Software Revenue Share (%), by Country 2025 & 2033
- Figure 26: Asia Pacific Grid Optimization Software Revenue (billion), by Application 2025 & 2033
- Figure 27: Asia Pacific Grid Optimization Software Revenue Share (%), by Application 2025 & 2033
- Figure 28: Asia Pacific Grid Optimization Software Revenue (billion), by Types 2025 & 2033
- Figure 29: Asia Pacific Grid Optimization Software Revenue Share (%), by Types 2025 & 2033
- Figure 30: Asia Pacific Grid Optimization Software Revenue (billion), by Country 2025 & 2033
- Figure 31: Asia Pacific Grid Optimization Software Revenue Share (%), by Country 2025 & 2033
List of Tables
- Table 1: Global Grid Optimization Software Revenue billion Forecast, by Application 2020 & 2033
- Table 2: Global Grid Optimization Software Revenue billion Forecast, by Types 2020 & 2033
- Table 3: Global Grid Optimization Software Revenue billion Forecast, by Region 2020 & 2033
- Table 4: Global Grid Optimization Software Revenue billion Forecast, by Application 2020 & 2033
- Table 5: Global Grid Optimization Software Revenue billion Forecast, by Types 2020 & 2033
- Table 6: Global Grid Optimization Software Revenue billion Forecast, by Country 2020 & 2033
- Table 7: United States Grid Optimization Software Revenue (billion) Forecast, by Application 2020 & 2033
- Table 8: Canada Grid Optimization Software Revenue (billion) Forecast, by Application 2020 & 2033
- Table 9: Mexico Grid Optimization Software Revenue (billion) Forecast, by Application 2020 & 2033
- Table 10: Global Grid Optimization Software Revenue billion Forecast, by Application 2020 & 2033
- Table 11: Global Grid Optimization Software Revenue billion Forecast, by Types 2020 & 2033
- Table 12: Global Grid Optimization Software Revenue billion Forecast, by Country 2020 & 2033
- Table 13: Brazil Grid Optimization Software Revenue (billion) Forecast, by Application 2020 & 2033
- Table 14: Argentina Grid Optimization Software Revenue (billion) Forecast, by Application 2020 & 2033
- Table 15: Rest of South America Grid Optimization Software Revenue (billion) Forecast, by Application 2020 & 2033
- Table 16: Global Grid Optimization Software Revenue billion Forecast, by Application 2020 & 2033
- Table 17: Global Grid Optimization Software Revenue billion Forecast, by Types 2020 & 2033
- Table 18: Global Grid Optimization Software Revenue billion Forecast, by Country 2020 & 2033
- Table 19: United Kingdom Grid Optimization Software Revenue (billion) Forecast, by Application 2020 & 2033
- Table 20: Germany Grid Optimization Software Revenue (billion) Forecast, by Application 2020 & 2033
- Table 21: France Grid Optimization Software Revenue (billion) Forecast, by Application 2020 & 2033
- Table 22: Italy Grid Optimization Software Revenue (billion) Forecast, by Application 2020 & 2033
- Table 23: Spain Grid Optimization Software Revenue (billion) Forecast, by Application 2020 & 2033
- Table 24: Russia Grid Optimization Software Revenue (billion) Forecast, by Application 2020 & 2033
- Table 25: Benelux Grid Optimization Software Revenue (billion) Forecast, by Application 2020 & 2033
- Table 26: Nordics Grid Optimization Software Revenue (billion) Forecast, by Application 2020 & 2033
- Table 27: Rest of Europe Grid Optimization Software Revenue (billion) Forecast, by Application 2020 & 2033
- Table 28: Global Grid Optimization Software Revenue billion Forecast, by Application 2020 & 2033
- Table 29: Global Grid Optimization Software Revenue billion Forecast, by Types 2020 & 2033
- Table 30: Global Grid Optimization Software Revenue billion Forecast, by Country 2020 & 2033
- Table 31: Turkey Grid Optimization Software Revenue (billion) Forecast, by Application 2020 & 2033
- Table 32: Israel Grid Optimization Software Revenue (billion) Forecast, by Application 2020 & 2033
- Table 33: GCC Grid Optimization Software Revenue (billion) Forecast, by Application 2020 & 2033
- Table 34: North Africa Grid Optimization Software Revenue (billion) Forecast, by Application 2020 & 2033
- Table 35: South Africa Grid Optimization Software Revenue (billion) Forecast, by Application 2020 & 2033
- Table 36: Rest of Middle East & Africa Grid Optimization Software Revenue (billion) Forecast, by Application 2020 & 2033
- Table 37: Global Grid Optimization Software Revenue billion Forecast, by Application 2020 & 2033
- Table 38: Global Grid Optimization Software Revenue billion Forecast, by Types 2020 & 2033
- Table 39: Global Grid Optimization Software Revenue billion Forecast, by Country 2020 & 2033
- Table 40: China Grid Optimization Software Revenue (billion) Forecast, by Application 2020 & 2033
- Table 41: India Grid Optimization Software Revenue (billion) Forecast, by Application 2020 & 2033
- Table 42: Japan Grid Optimization Software Revenue (billion) Forecast, by Application 2020 & 2033
- Table 43: South Korea Grid Optimization Software Revenue (billion) Forecast, by Application 2020 & 2033
- Table 44: ASEAN Grid Optimization Software Revenue (billion) Forecast, by Application 2020 & 2033
- Table 45: Oceania Grid Optimization Software Revenue (billion) Forecast, by Application 2020 & 2033
- Table 46: Rest of Asia Pacific Grid Optimization Software Revenue (billion) Forecast, by Application 2020 & 2033
Frequently Asked Questions
1. What is the projected Compound Annual Growth Rate (CAGR) of the Grid Optimization Software?
The projected CAGR is approximately 10.6%.
2. Which companies are prominent players in the Grid Optimization Software?
Key companies in the market include Schneider Electric, Siemens, ABB, Oracle Corporation, GE Digital, Eaton, Itron Inc, Cisco Systems Inc, Emerson, Intel, IBM, Huawei Enterprise, SKM Systems Analysis, Inc, ETAP, Plexim.
3. What are the main segments of the Grid Optimization Software?
The market segments include Application, Types.
4. Can you provide details about the market size?
The market size is estimated to be USD 18 billion as of 2022.
5. What are some drivers contributing to market growth?
N/A
6. What are the notable trends driving market growth?
N/A
7. Are there any restraints impacting market growth?
N/A
8. Can you provide examples of recent developments in the market?
N/A
9. What pricing options are available for accessing the report?
Pricing options include single-user, multi-user, and enterprise licenses priced at USD 4350.00, USD 6525.00, and USD 8700.00 respectively.
10. Is the market size provided in terms of value or volume?
The market size is provided in terms of value, measured in billion.
11. Are there any specific market keywords associated with the report?
Yes, the market keyword associated with the report is "Grid Optimization Software," which aids in identifying and referencing the specific market segment covered.
12. How do I determine which pricing option suits my needs best?
The pricing options vary based on user requirements and access needs. Individual users may opt for single-user licenses, while businesses requiring broader access may choose multi-user or enterprise licenses for cost-effective access to the report.
13. Are there any additional resources or data provided in the Grid Optimization Software report?
While the report offers comprehensive insights, it's advisable to review the specific contents or supplementary materials provided to ascertain if additional resources or data are available.
14. How can I stay updated on further developments or reports in the Grid Optimization Software?
To stay informed about further developments, trends, and reports in the Grid Optimization Software, consider subscribing to industry newsletters, following relevant companies and organizations, or regularly checking reputable industry news sources and publications.
Methodology
Step 1 - Identification of Relevant Samples Size from Population Database


Step 2 - Approaches for Defining Global Market Size (Value, Volume* & Price*)

Note*: In applicable scenarios
Step 3 - Data Sources
Primary Research
- Web Analytics
- Survey Reports
- Research Institute
- Latest Research Reports
- Opinion Leaders
Secondary Research
- Annual Reports
- White Paper
- Latest Press Release
- Industry Association
- Paid Database
- Investor Presentations

Step 4 - Data Triangulation
Involves using different sources of information in order to increase the validity of a study
These sources are likely to be stakeholders in a program - participants, other researchers, program staff, other community members, and so on.
Then we put all data in single framework & apply various statistical tools to find out the dynamic on the market.
During the analysis stage, feedback from the stakeholder groups would be compared to determine areas of agreement as well as areas of divergence