

Key Insights
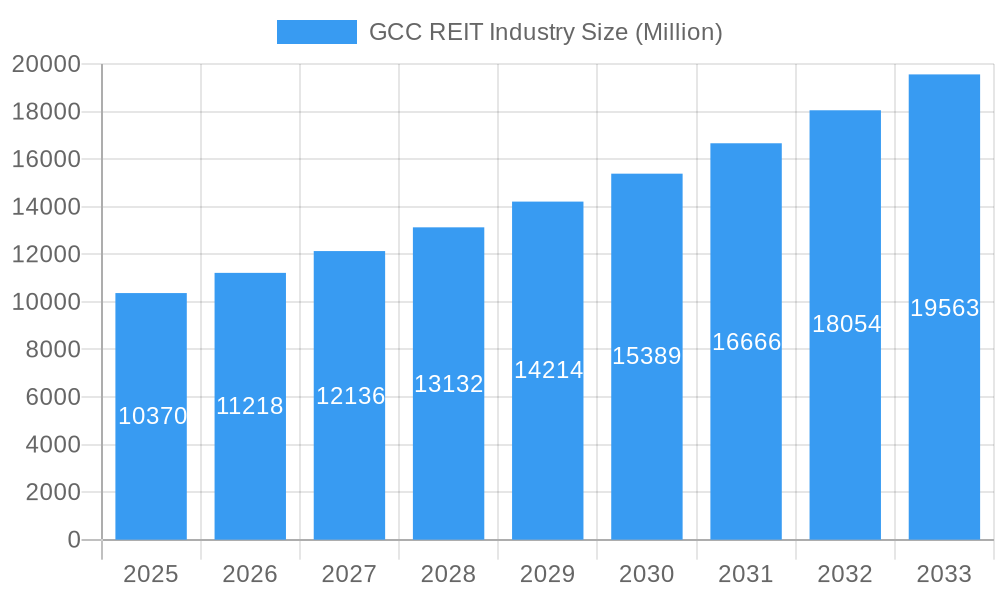
The GCC REIT (Real Estate Investment Trust) industry, valued at $10.37 billion in 2025, exhibits robust growth potential, projected to expand at a CAGR of 8.24% from 2025 to 2033. This expansion is fueled by several key drivers. Firstly, increasing urbanization and population growth across the GCC region are driving demand for commercial, residential, and hospitality real estate, creating attractive investment opportunities for REITs. Secondly, supportive government initiatives aimed at diversifying economies and boosting infrastructure development are further catalyzing the sector's growth. These initiatives often include tax breaks and streamlined regulations designed to attract foreign investment into the REIT market. Thirdly, the region's expanding tourism sector significantly benefits hospitality REITs, while the flourishing logistics and e-commerce sectors positively impact industrial REITs. However, the market faces certain restraints, including potential economic volatility linked to global oil prices and competition from other investment avenues. The segmentation of the market into property types (commercial, residential, industrial, healthcare, hospitality) and investment types (equity, mortgage) allows for a nuanced understanding of investment opportunities and risk profiles. Major players such as Emaar Malls Group, Aldar Properties, and others are actively shaping the market landscape through strategic acquisitions and developments.
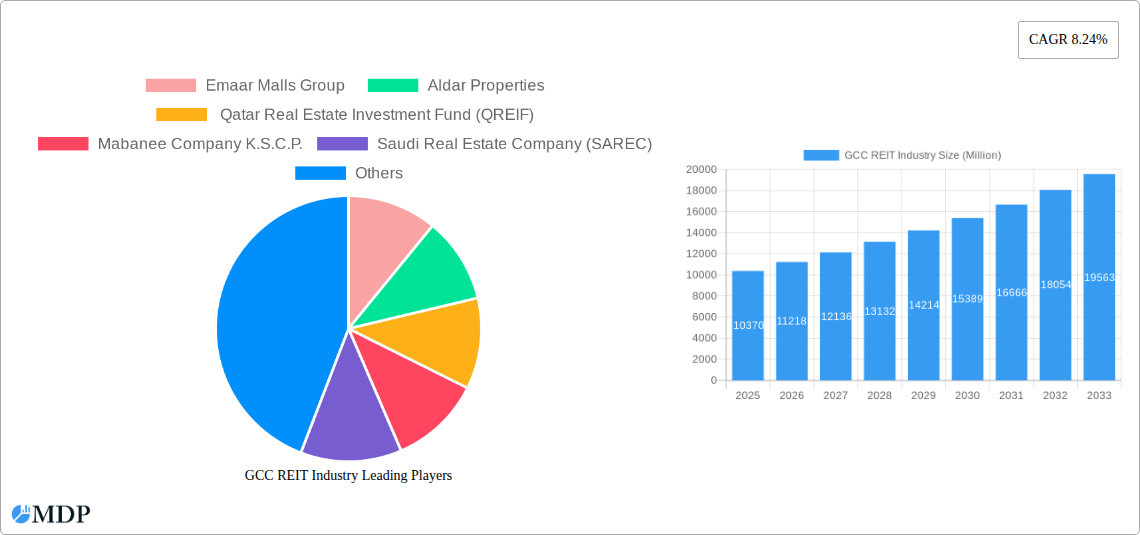
GCC REIT Industry Market Size (In Billion)
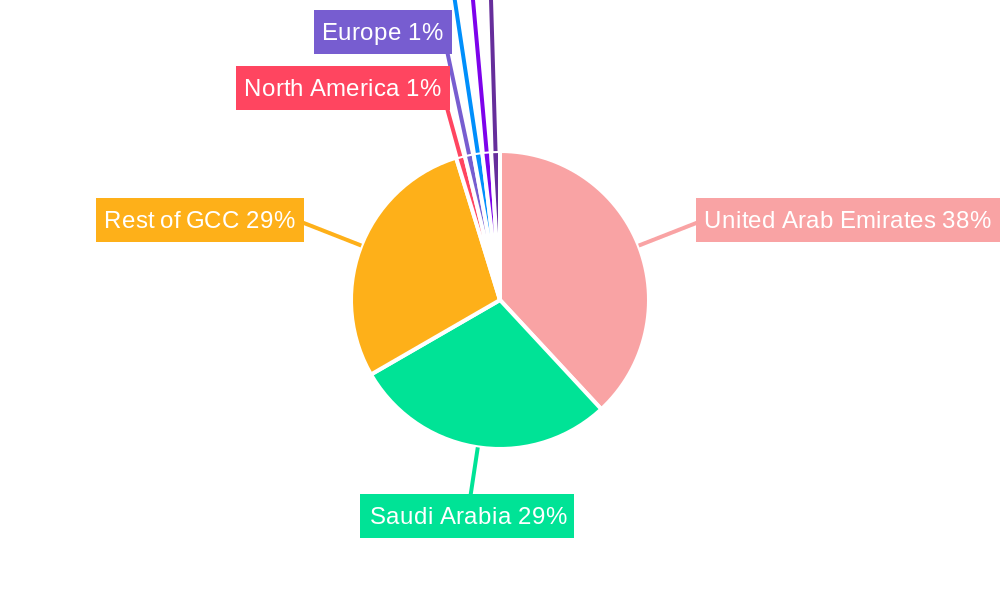
The forecast period (2025-2033) suggests a continued upward trajectory for the GCC REIT market. The strong growth is expected to be relatively consistent across various segments, although the relative performance of each segment (e.g., residential vs. commercial) might fluctuate based on specific market dynamics and economic conditions. The market's geographical distribution will likely see continued dominance from the UAE and Saudi Arabia, given their established real estate sectors and large populations, but other GCC nations are poised for significant growth as infrastructure development accelerates. Diversification of investment into REITs is also expected to increase as investors seek stable, long-term returns in a relatively secure market. The ongoing focus on sustainable development and environmentally friendly building practices will be another factor driving the sector's positive outlook.
GCC REIT Industry Company Market Share
GCC REIT Industry: A Comprehensive Market Report (2019-2033)
Unlocking the lucrative potential of the Gulf Cooperation Council (GCC) Real Estate Investment Trust (REIT) market with this in-depth analysis, projecting a xx Million market valuation by 2033. This comprehensive report provides a detailed overview of the GCC REIT industry, encompassing market dynamics, leading players, key trends, and future growth prospects. Ideal for investors, industry professionals, and stakeholders seeking actionable insights into this rapidly expanding sector.
GCC REIT Industry Market Dynamics & Concentration
This section analyzes the GCC REIT market's competitive landscape, regulatory environment, and key trends influencing its growth trajectory from 2019 to 2033. The study period covers the historical period (2019-2024), the base year (2025), and the forecast period (2025-2033).
Market Concentration: The GCC REIT market exhibits a moderately concentrated landscape, with key players such as Emaar Malls Group and Aldar Properties holding significant market share. However, the emergence of new REITs, particularly in Saudi Arabia following the introduction of its REIT regime in September 2022, is gradually increasing competition. We estimate a market concentration ratio (CR4) of xx% in 2025.
Innovation Drivers: Technological advancements, particularly in property management and financial technology (FinTech), are driving innovation within the GCC REIT sector. The adoption of PropTech solutions for enhanced efficiency and transparency is a significant growth driver.
Regulatory Frameworks: The regulatory landscape is evolving, with varying regulations across GCC countries. The introduction of the Saudi Arabian REIT regime has significantly impacted market growth, encouraging increased investment and the listing of new REITs.
Product Substitutes: Alternative investment options, such as direct real estate investment or other asset classes, pose a level of competition to REITs. However, the advantages of REITs—diversification, liquidity, and professional management—continue to attract investors.
End-User Trends: Growing urbanization, increasing disposable incomes, and a preference for rental properties are fueling demand for REITs across various property types, particularly in the commercial and residential segments.
M&A Activities: Mergers and acquisitions (M&A) activity within the GCC REIT sector is expected to increase in the coming years. The number of M&A deals increased by xx% from 2020 to 2024, driven by the desire to consolidate market share and expand portfolios.
GCC REIT Industry Industry Trends & Analysis
The GCC REIT market is experiencing robust growth, driven by various factors analyzed in this section. The Compound Annual Growth Rate (CAGR) for the forecast period (2025-2033) is estimated at xx%, reaching a market size of xx Million by 2033. This growth is fueled by several key factors:
- Government Initiatives: Supportive government policies and regulations, including the establishment of REIT frameworks in several GCC countries, are significant catalysts.
- Economic Growth: The strong economic growth across the GCC region, coupled with increasing urbanization and tourism, is boosting demand for real estate.
- Rising Institutional Investment: Increased participation of institutional investors, including pension funds and sovereign wealth funds, is contributing significantly to market expansion.
- Technological Disruptions: The integration of technology in real estate operations, enhancing efficiency and transparency, is accelerating industry growth.
- Consumer Preferences: A shift towards rental accommodation, particularly in urban areas, fuels demand for residential REITs.
- Competitive Dynamics: Increasing competition among REITs is leading to innovative product offerings and improved investor services, ultimately benefiting the market.
Leading Markets & Segments in GCC REIT Industry
This section identifies the dominant regions, countries, and segments within the GCC REIT market.
By Property Type:
- Commercial REITs: This segment dominates the market, driven by strong demand for office spaces and retail properties in major urban centers across the GCC. Key drivers include economic diversification strategies and the expansion of the service sector.
- Residential REITs: This segment is experiencing rapid growth, fueled by increasing urbanization and a preference for rental properties. Government housing initiatives further boost this sector.
- Industrial and Logistics REITs: This segment is witnessing significant growth, driven by the expansion of e-commerce and the development of logistics hubs.
- Healthcare REITs: This segment shows moderate growth, driven by increased investment in healthcare infrastructure.
- Hospitality REITs: This segment's growth is influenced by tourism trends and investment in the hospitality sector.
By Investment Type:
- Equity REITs: This remains the dominant investment type, offering investors direct ownership in real estate assets.
- Mortgage REITs: This sector shows comparatively lower growth, with investment primarily focused on mortgage-backed securities.
Dominant Regions: The UAE and Saudi Arabia currently represent the most significant markets due to a large concentration of REIT listings and a strong investor base.
GCC REIT Industry Product Developments
The GCC REIT market is witnessing the emergence of innovative REIT products tailored to investor needs and market trends. These developments include the introduction of specialized REITs focused on specific property types (e.g., data centers, renewable energy infrastructure) and the increased use of technology to improve efficiency and transparency in REIT operations. This has led to the development of REITs offering greater diversification and higher returns for investors.
Key Drivers of GCC REIT Industry Growth
Several key factors fuel the GCC REIT industry's growth. These include:
- Government Support: Supportive government policies and regulations are crucial.
- Economic Growth: The robust economic growth in the GCC region provides a favorable environment for real estate investment.
- Technological Advancements: Innovations in PropTech and FinTech are optimizing operations and attracting investors.
Challenges in the GCC REIT Industry Market
Despite the significant growth potential, the GCC REIT industry faces certain challenges:
- Regulatory Uncertainty: Inconsistent regulations across GCC countries can create uncertainty for investors.
- Market Volatility: Global economic fluctuations can impact investor confidence and market stability.
- Competition: Intense competition among REITs requires continuous innovation and adaptation.
Emerging Opportunities in GCC REIT Industry
Significant long-term growth opportunities exist within the GCC REIT sector. These include:
- Expansion into New Markets: Exploring opportunities in less developed real estate sectors within the GCC region.
- Strategic Partnerships: Collaborative ventures with technology providers and international investors can unlock new growth avenues.
- Sustainability Focus: Investing in environmentally friendly real estate projects to attract environmentally conscious investors.
Leading Players in the GCC REIT Industry Sector
- Emaar Malls Group
- Aldar Properties
- Qatar Real Estate Investment Fund (QREIF)
- Mabanee Company K.S.C.P.
- Saudi Real Estate Company (SAREC)
- Mall of Oman
- National Real Estate Company (NREC)
Key Milestones in GCC REIT Industry Industry
- November 2016: Riyad REIT, the first REIT, listed in Saudi Arabia.
- January 2021: The Dubai Financial Market (DFM) commenced REIT trading.
- September 2022: Saudi Arabia introduced a comprehensive REIT regime.
Strategic Outlook for GCC REIT Industry Market
The GCC REIT market is poised for continued expansion, driven by supportive government policies, robust economic growth, and technological advancements. Strategic partnerships and diversification into new property sectors will be critical for future success. The market presents significant opportunities for both established players and new entrants seeking to capitalize on the region's growth trajectory.
GCC REIT Industry Segmentation
- 1. Production Analysis
- 2. Consumption Analysis
- 3. Import Market Analysis (Value & Volume)
- 4. Export Market Analysis (Value & Volume)
- 5. Price Trend Analysis
GCC REIT Industry Segmentation By Geography
-
1. North America
- 1.1. United States
- 1.2. Canada
- 1.3. Mexico
-
2. South America
- 2.1. Brazil
- 2.2. Argentina
- 2.3. Rest of South America
-
3. Europe
- 3.1. United Kingdom
- 3.2. Germany
- 3.3. France
- 3.4. Italy
- 3.5. Spain
- 3.6. Russia
- 3.7. Benelux
- 3.8. Nordics
- 3.9. Rest of Europe
-
4. Middle East & Africa
- 4.1. Turkey
- 4.2. Israel
- 4.3. GCC
- 4.4. North Africa
- 4.5. South Africa
- 4.6. Rest of Middle East & Africa
-
5. Asia Pacific
- 5.1. China
- 5.2. India
- 5.3. Japan
- 5.4. South Korea
- 5.5. ASEAN
- 5.6. Oceania
- 5.7. Rest of Asia Pacific
GCC REIT Industry Regional Market Share
Geographic Coverage of GCC REIT Industry
GCC REIT Industry REPORT HIGHLIGHTS
| Aspects | Details |
|---|---|
| Study Period | 2020-2034 |
| Base Year | 2025 |
| Estimated Year | 2026 |
| Forecast Period | 2026-2034 |
| Historical Period | 2020-2025 |
| Growth Rate | CAGR of 8.24% from 2020-2034 |
| Segmentation |
|
Table of Contents
- 1. Introduction
- 1.1. Research Scope
- 1.2. Market Segmentation
- 1.3. Research Objective
- 1.4. Definitions and Assumptions
- 2. Executive Summary
- 2.1. Market Snapshot
- 3. Market Dynamics
- 3.1. Market Drivers
- 3.2. Market Restrains
- 3.3. Market Trends
- 3.4. Market Opportunities
- 4. Market Factor Analysis
- 4.1. Porters Five Forces
- 4.1.1. Bargaining Power of Suppliers
- 4.1.2. Bargaining Power of Buyers
- 4.1.3. Threat of New Entrants
- 4.1.4. Threat of Substitutes
- 4.1.5. Competitive Rivalry
- 4.2. PESTEL analysis
- 4.3. BCG Analysis
- 4.3.1. Stars (High Growth, High Market Share)
- 4.3.2. Cash Cows (Low Growth, High Market Share)
- 4.3.3. Question Mark (High Growth, Low Market Share)
- 4.3.4. Dogs (Low Growth, Low Market Share)
- 4.4. Ansoff Matrix Analysis
- 4.5. Supply Chain Analysis
- 4.6. Regulatory Landscape
- 4.7. Current Market Potential and Opportunity Assessment (TAM–SAM–SOM Framework)
- 4.8. MDP Analyst Note
- 4.1. Porters Five Forces
- 5. Market Analysis, Insights and Forecast 2021-2033
- 5.1. Market Analysis, Insights and Forecast - by Production Analysis
- 5.2. Market Analysis, Insights and Forecast - by Consumption Analysis
- 5.3. Market Analysis, Insights and Forecast - by Import Market Analysis (Value & Volume)
- 5.4. Market Analysis, Insights and Forecast - by Export Market Analysis (Value & Volume)
- 5.5. Market Analysis, Insights and Forecast - by Price Trend Analysis
- 5.6. Market Analysis, Insights and Forecast - by Region
- 5.6.1. North America
- 5.6.2. South America
- 5.6.3. Europe
- 5.6.4. Middle East & Africa
- 5.6.5. Asia Pacific
- 6. Global GCC REIT Industry Analysis, Insights and Forecast, 2021-2033
- 6.1. Market Analysis, Insights and Forecast - by Production Analysis
- 6.2. Market Analysis, Insights and Forecast - by Consumption Analysis
- 6.3. Market Analysis, Insights and Forecast - by Import Market Analysis (Value & Volume)
- 6.4. Market Analysis, Insights and Forecast - by Export Market Analysis (Value & Volume)
- 6.5. Market Analysis, Insights and Forecast - by Price Trend Analysis
- 7. North America GCC REIT Industry Analysis, Insights and Forecast, 2020-2032
- 7.1. Market Analysis, Insights and Forecast - by Production Analysis
- 7.2. Market Analysis, Insights and Forecast - by Consumption Analysis
- 7.3. Market Analysis, Insights and Forecast - by Import Market Analysis (Value & Volume)
- 7.4. Market Analysis, Insights and Forecast - by Export Market Analysis (Value & Volume)
- 7.5. Market Analysis, Insights and Forecast - by Price Trend Analysis
- 8. South America GCC REIT Industry Analysis, Insights and Forecast, 2020-2032
- 8.1. Market Analysis, Insights and Forecast - by Production Analysis
- 8.2. Market Analysis, Insights and Forecast - by Consumption Analysis
- 8.3. Market Analysis, Insights and Forecast - by Import Market Analysis (Value & Volume)
- 8.4. Market Analysis, Insights and Forecast - by Export Market Analysis (Value & Volume)
- 8.5. Market Analysis, Insights and Forecast - by Price Trend Analysis
- 9. Europe GCC REIT Industry Analysis, Insights and Forecast, 2020-2032
- 9.1. Market Analysis, Insights and Forecast - by Production Analysis
- 9.2. Market Analysis, Insights and Forecast - by Consumption Analysis
- 9.3. Market Analysis, Insights and Forecast - by Import Market Analysis (Value & Volume)
- 9.4. Market Analysis, Insights and Forecast - by Export Market Analysis (Value & Volume)
- 9.5. Market Analysis, Insights and Forecast - by Price Trend Analysis
- 10. Middle East & Africa GCC REIT Industry Analysis, Insights and Forecast, 2020-2032
- 10.1. Market Analysis, Insights and Forecast - by Production Analysis
- 10.2. Market Analysis, Insights and Forecast - by Consumption Analysis
- 10.3. Market Analysis, Insights and Forecast - by Import Market Analysis (Value & Volume)
- 10.4. Market Analysis, Insights and Forecast - by Export Market Analysis (Value & Volume)
- 10.5. Market Analysis, Insights and Forecast - by Price Trend Analysis
- 11. Asia Pacific GCC REIT Industry Analysis, Insights and Forecast, 2020-2032
- 11.1. Market Analysis, Insights and Forecast - by Production Analysis
- 11.2. Market Analysis, Insights and Forecast - by Consumption Analysis
- 11.3. Market Analysis, Insights and Forecast - by Import Market Analysis (Value & Volume)
- 11.4. Market Analysis, Insights and Forecast - by Export Market Analysis (Value & Volume)
- 11.5. Market Analysis, Insights and Forecast - by Price Trend Analysis
- 12. Competitive Analysis
- 12.1. Company Profiles
- 12.1.1 Emaar Malls Group
- 12.1.1.1. Company Overview
- 12.1.1.2. Products
- 12.1.1.3. Company Financials
- 12.1.1.4. SWOT Analysis
- 12.1.2 Aldar Properties
- 12.1.2.1. Company Overview
- 12.1.2.2. Products
- 12.1.2.3. Company Financials
- 12.1.2.4. SWOT Analysis
- 12.1.3 Qatar Real Estate Investment Fund (QREIF)
- 12.1.3.1. Company Overview
- 12.1.3.2. Products
- 12.1.3.3. Company Financials
- 12.1.3.4. SWOT Analysis
- 12.1.4 Mabanee Company K.S.C.P.
- 12.1.4.1. Company Overview
- 12.1.4.2. Products
- 12.1.4.3. Company Financials
- 12.1.4.4. SWOT Analysis
- 12.1.5 Saudi Real Estate Company (SAREC)
- 12.1.5.1. Company Overview
- 12.1.5.2. Products
- 12.1.5.3. Company Financials
- 12.1.5.4. SWOT Analysis
- 12.1.6 Mall of Oman
- 12.1.6.1. Company Overview
- 12.1.6.2. Products
- 12.1.6.3. Company Financials
- 12.1.6.4. SWOT Analysis
- 12.1.7 National Real Estate Company (NREC)
- 12.1.7.1. Company Overview
- 12.1.7.2. Products
- 12.1.7.3. Company Financials
- 12.1.7.4. SWOT Analysis
- 12.1.1 Emaar Malls Group
- 12.2. Market Entropy
- 12.2.1 Company's Key Areas Served
- 12.2.2 Recent Developments
- 12.3. Company Market Share Analysis 2025
- 12.3.1 Top 5 Companies Market Share Analysis
- 12.3.2 Top 3 Companies Market Share Analysis
- 12.4. List of Potential Customers
- 13. Research Methodology
List of Figures
- Figure 1: Global GCC REIT Industry Revenue Breakdown (Million, %) by Region 2025 & 2033
- Figure 2: North America GCC REIT Industry Revenue (Million), by Production Analysis 2025 & 2033
- Figure 3: North America GCC REIT Industry Revenue Share (%), by Production Analysis 2025 & 2033
- Figure 4: North America GCC REIT Industry Revenue (Million), by Consumption Analysis 2025 & 2033
- Figure 5: North America GCC REIT Industry Revenue Share (%), by Consumption Analysis 2025 & 2033
- Figure 6: North America GCC REIT Industry Revenue (Million), by Import Market Analysis (Value & Volume) 2025 & 2033
- Figure 7: North America GCC REIT Industry Revenue Share (%), by Import Market Analysis (Value & Volume) 2025 & 2033
- Figure 8: North America GCC REIT Industry Revenue (Million), by Export Market Analysis (Value & Volume) 2025 & 2033
- Figure 9: North America GCC REIT Industry Revenue Share (%), by Export Market Analysis (Value & Volume) 2025 & 2033
- Figure 10: North America GCC REIT Industry Revenue (Million), by Price Trend Analysis 2025 & 2033
- Figure 11: North America GCC REIT Industry Revenue Share (%), by Price Trend Analysis 2025 & 2033
- Figure 12: North America GCC REIT Industry Revenue (Million), by Country 2025 & 2033
- Figure 13: North America GCC REIT Industry Revenue Share (%), by Country 2025 & 2033
- Figure 14: South America GCC REIT Industry Revenue (Million), by Production Analysis 2025 & 2033
- Figure 15: South America GCC REIT Industry Revenue Share (%), by Production Analysis 2025 & 2033
- Figure 16: South America GCC REIT Industry Revenue (Million), by Consumption Analysis 2025 & 2033
- Figure 17: South America GCC REIT Industry Revenue Share (%), by Consumption Analysis 2025 & 2033
- Figure 18: South America GCC REIT Industry Revenue (Million), by Import Market Analysis (Value & Volume) 2025 & 2033
- Figure 19: South America GCC REIT Industry Revenue Share (%), by Import Market Analysis (Value & Volume) 2025 & 2033
- Figure 20: South America GCC REIT Industry Revenue (Million), by Export Market Analysis (Value & Volume) 2025 & 2033
- Figure 21: South America GCC REIT Industry Revenue Share (%), by Export Market Analysis (Value & Volume) 2025 & 2033
- Figure 22: South America GCC REIT Industry Revenue (Million), by Price Trend Analysis 2025 & 2033
- Figure 23: South America GCC REIT Industry Revenue Share (%), by Price Trend Analysis 2025 & 2033
- Figure 24: South America GCC REIT Industry Revenue (Million), by Country 2025 & 2033
- Figure 25: South America GCC REIT Industry Revenue Share (%), by Country 2025 & 2033
- Figure 26: Europe GCC REIT Industry Revenue (Million), by Production Analysis 2025 & 2033
- Figure 27: Europe GCC REIT Industry Revenue Share (%), by Production Analysis 2025 & 2033
- Figure 28: Europe GCC REIT Industry Revenue (Million), by Consumption Analysis 2025 & 2033
- Figure 29: Europe GCC REIT Industry Revenue Share (%), by Consumption Analysis 2025 & 2033
- Figure 30: Europe GCC REIT Industry Revenue (Million), by Import Market Analysis (Value & Volume) 2025 & 2033
- Figure 31: Europe GCC REIT Industry Revenue Share (%), by Import Market Analysis (Value & Volume) 2025 & 2033
- Figure 32: Europe GCC REIT Industry Revenue (Million), by Export Market Analysis (Value & Volume) 2025 & 2033
- Figure 33: Europe GCC REIT Industry Revenue Share (%), by Export Market Analysis (Value & Volume) 2025 & 2033
- Figure 34: Europe GCC REIT Industry Revenue (Million), by Price Trend Analysis 2025 & 2033
- Figure 35: Europe GCC REIT Industry Revenue Share (%), by Price Trend Analysis 2025 & 2033
- Figure 36: Europe GCC REIT Industry Revenue (Million), by Country 2025 & 2033
- Figure 37: Europe GCC REIT Industry Revenue Share (%), by Country 2025 & 2033
- Figure 38: Middle East & Africa GCC REIT Industry Revenue (Million), by Production Analysis 2025 & 2033
- Figure 39: Middle East & Africa GCC REIT Industry Revenue Share (%), by Production Analysis 2025 & 2033
- Figure 40: Middle East & Africa GCC REIT Industry Revenue (Million), by Consumption Analysis 2025 & 2033
- Figure 41: Middle East & Africa GCC REIT Industry Revenue Share (%), by Consumption Analysis 2025 & 2033
- Figure 42: Middle East & Africa GCC REIT Industry Revenue (Million), by Import Market Analysis (Value & Volume) 2025 & 2033
- Figure 43: Middle East & Africa GCC REIT Industry Revenue Share (%), by Import Market Analysis (Value & Volume) 2025 & 2033
- Figure 44: Middle East & Africa GCC REIT Industry Revenue (Million), by Export Market Analysis (Value & Volume) 2025 & 2033
- Figure 45: Middle East & Africa GCC REIT Industry Revenue Share (%), by Export Market Analysis (Value & Volume) 2025 & 2033
- Figure 46: Middle East & Africa GCC REIT Industry Revenue (Million), by Price Trend Analysis 2025 & 2033
- Figure 47: Middle East & Africa GCC REIT Industry Revenue Share (%), by Price Trend Analysis 2025 & 2033
- Figure 48: Middle East & Africa GCC REIT Industry Revenue (Million), by Country 2025 & 2033
- Figure 49: Middle East & Africa GCC REIT Industry Revenue Share (%), by Country 2025 & 2033
- Figure 50: Asia Pacific GCC REIT Industry Revenue (Million), by Production Analysis 2025 & 2033
- Figure 51: Asia Pacific GCC REIT Industry Revenue Share (%), by Production Analysis 2025 & 2033
- Figure 52: Asia Pacific GCC REIT Industry Revenue (Million), by Consumption Analysis 2025 & 2033
- Figure 53: Asia Pacific GCC REIT Industry Revenue Share (%), by Consumption Analysis 2025 & 2033
- Figure 54: Asia Pacific GCC REIT Industry Revenue (Million), by Import Market Analysis (Value & Volume) 2025 & 2033
- Figure 55: Asia Pacific GCC REIT Industry Revenue Share (%), by Import Market Analysis (Value & Volume) 2025 & 2033
- Figure 56: Asia Pacific GCC REIT Industry Revenue (Million), by Export Market Analysis (Value & Volume) 2025 & 2033
- Figure 57: Asia Pacific GCC REIT Industry Revenue Share (%), by Export Market Analysis (Value & Volume) 2025 & 2033
- Figure 58: Asia Pacific GCC REIT Industry Revenue (Million), by Price Trend Analysis 2025 & 2033
- Figure 59: Asia Pacific GCC REIT Industry Revenue Share (%), by Price Trend Analysis 2025 & 2033
- Figure 60: Asia Pacific GCC REIT Industry Revenue (Million), by Country 2025 & 2033
- Figure 61: Asia Pacific GCC REIT Industry Revenue Share (%), by Country 2025 & 2033
List of Tables
- Table 1: Global GCC REIT Industry Revenue Million Forecast, by Production Analysis 2020 & 2033
- Table 2: Global GCC REIT Industry Revenue Million Forecast, by Consumption Analysis 2020 & 2033
- Table 3: Global GCC REIT Industry Revenue Million Forecast, by Import Market Analysis (Value & Volume) 2020 & 2033
- Table 4: Global GCC REIT Industry Revenue Million Forecast, by Export Market Analysis (Value & Volume) 2020 & 2033
- Table 5: Global GCC REIT Industry Revenue Million Forecast, by Price Trend Analysis 2020 & 2033
- Table 6: Global GCC REIT Industry Revenue Million Forecast, by Region 2020 & 2033
- Table 7: Global GCC REIT Industry Revenue Million Forecast, by Production Analysis 2020 & 2033
- Table 8: Global GCC REIT Industry Revenue Million Forecast, by Consumption Analysis 2020 & 2033
- Table 9: Global GCC REIT Industry Revenue Million Forecast, by Import Market Analysis (Value & Volume) 2020 & 2033
- Table 10: Global GCC REIT Industry Revenue Million Forecast, by Export Market Analysis (Value & Volume) 2020 & 2033
- Table 11: Global GCC REIT Industry Revenue Million Forecast, by Price Trend Analysis 2020 & 2033
- Table 12: Global GCC REIT Industry Revenue Million Forecast, by Country 2020 & 2033
- Table 13: United States GCC REIT Industry Revenue (Million) Forecast, by Application 2020 & 2033
- Table 14: Canada GCC REIT Industry Revenue (Million) Forecast, by Application 2020 & 2033
- Table 15: Mexico GCC REIT Industry Revenue (Million) Forecast, by Application 2020 & 2033
- Table 16: Global GCC REIT Industry Revenue Million Forecast, by Production Analysis 2020 & 2033
- Table 17: Global GCC REIT Industry Revenue Million Forecast, by Consumption Analysis 2020 & 2033
- Table 18: Global GCC REIT Industry Revenue Million Forecast, by Import Market Analysis (Value & Volume) 2020 & 2033
- Table 19: Global GCC REIT Industry Revenue Million Forecast, by Export Market Analysis (Value & Volume) 2020 & 2033
- Table 20: Global GCC REIT Industry Revenue Million Forecast, by Price Trend Analysis 2020 & 2033
- Table 21: Global GCC REIT Industry Revenue Million Forecast, by Country 2020 & 2033
- Table 22: Brazil GCC REIT Industry Revenue (Million) Forecast, by Application 2020 & 2033
- Table 23: Argentina GCC REIT Industry Revenue (Million) Forecast, by Application 2020 & 2033
- Table 24: Rest of South America GCC REIT Industry Revenue (Million) Forecast, by Application 2020 & 2033
- Table 25: Global GCC REIT Industry Revenue Million Forecast, by Production Analysis 2020 & 2033
- Table 26: Global GCC REIT Industry Revenue Million Forecast, by Consumption Analysis 2020 & 2033
- Table 27: Global GCC REIT Industry Revenue Million Forecast, by Import Market Analysis (Value & Volume) 2020 & 2033
- Table 28: Global GCC REIT Industry Revenue Million Forecast, by Export Market Analysis (Value & Volume) 2020 & 2033
- Table 29: Global GCC REIT Industry Revenue Million Forecast, by Price Trend Analysis 2020 & 2033
- Table 30: Global GCC REIT Industry Revenue Million Forecast, by Country 2020 & 2033
- Table 31: United Kingdom GCC REIT Industry Revenue (Million) Forecast, by Application 2020 & 2033
- Table 32: Germany GCC REIT Industry Revenue (Million) Forecast, by Application 2020 & 2033
- Table 33: France GCC REIT Industry Revenue (Million) Forecast, by Application 2020 & 2033
- Table 34: Italy GCC REIT Industry Revenue (Million) Forecast, by Application 2020 & 2033
- Table 35: Spain GCC REIT Industry Revenue (Million) Forecast, by Application 2020 & 2033
- Table 36: Russia GCC REIT Industry Revenue (Million) Forecast, by Application 2020 & 2033
- Table 37: Benelux GCC REIT Industry Revenue (Million) Forecast, by Application 2020 & 2033
- Table 38: Nordics GCC REIT Industry Revenue (Million) Forecast, by Application 2020 & 2033
- Table 39: Rest of Europe GCC REIT Industry Revenue (Million) Forecast, by Application 2020 & 2033
- Table 40: Global GCC REIT Industry Revenue Million Forecast, by Production Analysis 2020 & 2033
- Table 41: Global GCC REIT Industry Revenue Million Forecast, by Consumption Analysis 2020 & 2033
- Table 42: Global GCC REIT Industry Revenue Million Forecast, by Import Market Analysis (Value & Volume) 2020 & 2033
- Table 43: Global GCC REIT Industry Revenue Million Forecast, by Export Market Analysis (Value & Volume) 2020 & 2033
- Table 44: Global GCC REIT Industry Revenue Million Forecast, by Price Trend Analysis 2020 & 2033
- Table 45: Global GCC REIT Industry Revenue Million Forecast, by Country 2020 & 2033
- Table 46: Turkey GCC REIT Industry Revenue (Million) Forecast, by Application 2020 & 2033
- Table 47: Israel GCC REIT Industry Revenue (Million) Forecast, by Application 2020 & 2033
- Table 48: GCC GCC REIT Industry Revenue (Million) Forecast, by Application 2020 & 2033
- Table 49: North Africa GCC REIT Industry Revenue (Million) Forecast, by Application 2020 & 2033
- Table 50: South Africa GCC REIT Industry Revenue (Million) Forecast, by Application 2020 & 2033
- Table 51: Rest of Middle East & Africa GCC REIT Industry Revenue (Million) Forecast, by Application 2020 & 2033
- Table 52: Global GCC REIT Industry Revenue Million Forecast, by Production Analysis 2020 & 2033
- Table 53: Global GCC REIT Industry Revenue Million Forecast, by Consumption Analysis 2020 & 2033
- Table 54: Global GCC REIT Industry Revenue Million Forecast, by Import Market Analysis (Value & Volume) 2020 & 2033
- Table 55: Global GCC REIT Industry Revenue Million Forecast, by Export Market Analysis (Value & Volume) 2020 & 2033
- Table 56: Global GCC REIT Industry Revenue Million Forecast, by Price Trend Analysis 2020 & 2033
- Table 57: Global GCC REIT Industry Revenue Million Forecast, by Country 2020 & 2033
- Table 58: China GCC REIT Industry Revenue (Million) Forecast, by Application 2020 & 2033
- Table 59: India GCC REIT Industry Revenue (Million) Forecast, by Application 2020 & 2033
- Table 60: Japan GCC REIT Industry Revenue (Million) Forecast, by Application 2020 & 2033
- Table 61: South Korea GCC REIT Industry Revenue (Million) Forecast, by Application 2020 & 2033
- Table 62: ASEAN GCC REIT Industry Revenue (Million) Forecast, by Application 2020 & 2033
- Table 63: Oceania GCC REIT Industry Revenue (Million) Forecast, by Application 2020 & 2033
- Table 64: Rest of Asia Pacific GCC REIT Industry Revenue (Million) Forecast, by Application 2020 & 2033
Frequently Asked Questions
1. What is the projected Compound Annual Growth Rate (CAGR) of the GCC REIT Industry?
The projected CAGR is approximately 8.24%.
2. Which companies are prominent players in the GCC REIT Industry?
Key companies in the market include Emaar Malls Group , Aldar Properties , Qatar Real Estate Investment Fund (QREIF) , Mabanee Company K.S.C.P., Saudi Real Estate Company (SAREC) , Mall of Oman , National Real Estate Company (NREC) .
3. What are the main segments of the GCC REIT Industry?
The market segments include Production Analysis, Consumption Analysis, Import Market Analysis (Value & Volume), Export Market Analysis (Value & Volume), Price Trend Analysis.
4. Can you provide details about the market size?
The market size is estimated to be USD 10.37 Million as of 2022.
5. What are some drivers contributing to market growth?
Fund Inflows is Driving the ETF Market.
6. What are the notable trends driving market growth?
Growing Asset Allocation to Real Estate by Large Investors in The Region.
7. Are there any restraints impacting market growth?
Underlying Fluctuations and Risks are Restraining the Market.
8. Can you provide examples of recent developments in the market?
In September 2022, Saudi Arabia introduced a real estate investment trust (REIT) regime. In November 2016, Riyad REIT was the first REIT to be listed in Saudi Arabia (and only the second REIT to be listed in the Middle East), which was followed by another 17 REITs up to July 2022, with a number of them also increasing their capital to acquire additional assets.
9. What pricing options are available for accessing the report?
Pricing options include single-user, multi-user, and enterprise licenses priced at USD 3800, USD 4500, and USD 5800 respectively.
10. Is the market size provided in terms of value or volume?
The market size is provided in terms of value, measured in Million.
11. Are there any specific market keywords associated with the report?
Yes, the market keyword associated with the report is "GCC REIT Industry," which aids in identifying and referencing the specific market segment covered.
12. How do I determine which pricing option suits my needs best?
The pricing options vary based on user requirements and access needs. Individual users may opt for single-user licenses, while businesses requiring broader access may choose multi-user or enterprise licenses for cost-effective access to the report.
13. Are there any additional resources or data provided in the GCC REIT Industry report?
While the report offers comprehensive insights, it's advisable to review the specific contents or supplementary materials provided to ascertain if additional resources or data are available.
14. How can I stay updated on further developments or reports in the GCC REIT Industry?
To stay informed about further developments, trends, and reports in the GCC REIT Industry, consider subscribing to industry newsletters, following relevant companies and organizations, or regularly checking reputable industry news sources and publications.
Methodology
Step 1 - Identification of Relevant Samples Size from Population Database


Step 2 - Approaches for Defining Global Market Size (Value, Volume* & Price*)

Note*: In applicable scenarios
Step 3 - Data Sources
Primary Research
- Web Analytics
- Survey Reports
- Research Institute
- Latest Research Reports
- Opinion Leaders
Secondary Research
- Annual Reports
- White Paper
- Latest Press Release
- Industry Association
- Paid Database
- Investor Presentations

Step 4 - Data Triangulation
Involves using different sources of information in order to increase the validity of a study
These sources are likely to be stakeholders in a program - participants, other researchers, program staff, other community members, and so on.
Then we put all data in single framework & apply various statistical tools to find out the dynamic on the market.
During the analysis stage, feedback from the stakeholder groups would be compared to determine areas of agreement as well as areas of divergence