

Key Insights
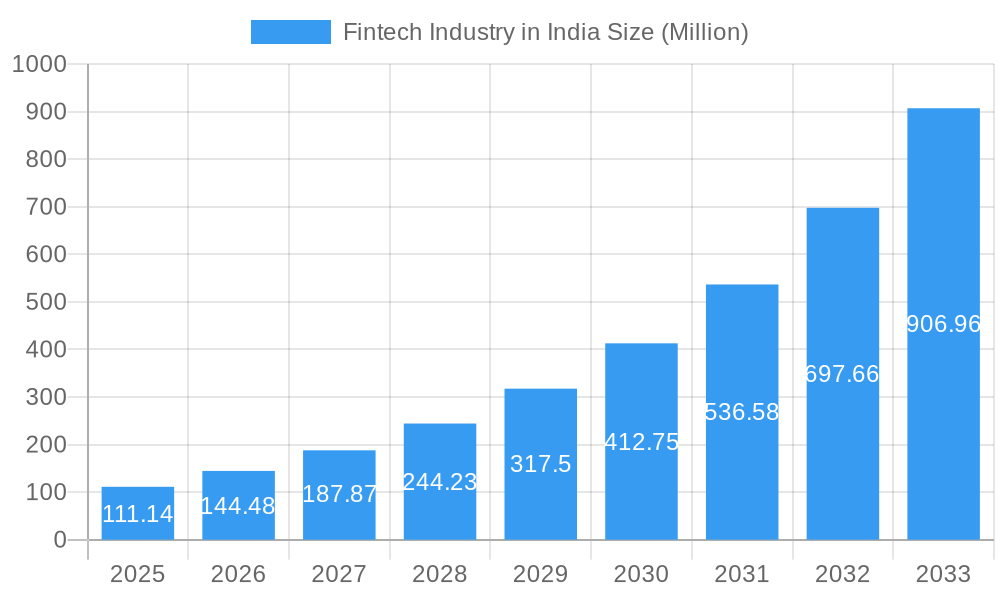
The Indian Fintech market, valued at $111.14 million in 2025, is experiencing explosive growth, projected to expand significantly over the next decade. A compound annual growth rate (CAGR) of 30.55% from 2025 to 2033 indicates a massive market expansion driven by several key factors. Increased smartphone penetration and internet access across India's vast population have fueled digital financial services adoption. Government initiatives promoting financial inclusion, such as the Digital India program, further accelerate this growth. The rising popularity of mobile payment platforms, digital lending, and insurtech solutions caters to the needs of a young and tech-savvy population increasingly comfortable managing their finances digitally. Competition is fierce, with established players like Paytm and PhonePe vying for market share alongside innovative startups offering specialized financial products. While regulatory hurdles and cybersecurity concerns pose challenges, the overall market trajectory remains strongly positive.
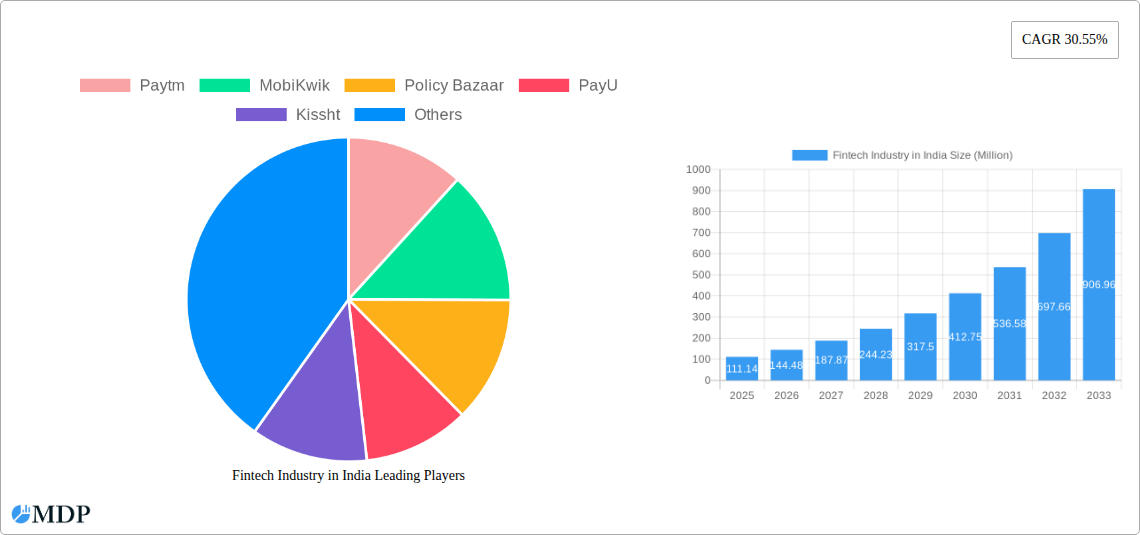
Fintech Industry in India Market Size (In Million)
Despite the rapid expansion, certain restraints exist. Maintaining data security and consumer trust amidst rising cyber threats is crucial for long-term sustainability. The need for financial literacy initiatives to ensure widespread understanding and responsible usage of Fintech services is also important. Regulatory changes and their impact on the market require continuous monitoring and adaptation. Nevertheless, the market's inherent dynamism, driven by technological advancements and the evolving financial needs of the Indian population, suggests a continuously expanding and promising landscape for Fintech companies. The diversity of Fintech services, from payments and lending to investments and insurance, suggests significant opportunities for both existing players and new entrants alike, prompting a highly competitive and dynamic environment.
Fintech Industry in India Company Market Share
Fintech Industry in India: A Comprehensive Market Report (2019-2033)
This comprehensive report provides a detailed analysis of the burgeoning Fintech industry in India, covering market dynamics, leading players, key trends, and future growth prospects. The study period spans from 2019 to 2033, with 2025 as the base and estimated year. The forecast period is 2025-2033, and the historical period is 2019-2024. This report is essential reading for investors, industry stakeholders, and anyone seeking to understand the transformative impact of Fintech on the Indian economy. Expect in-depth analysis covering market size (projected to reach xx Million by 2033), growth drivers, challenges, and opportunities within this dynamic sector.
Keywords: Fintech India, Indian Fintech Market, Digital Payments India, Fintech Investment India, Lending Fintech India, Insurtech India, Mobile Payments India, Paytm, Phonepe, Policy Bazaar, MobiKwik, PayU, Kissht, Shubh Loans, Lending Kart, Faircent, ET Money, Fintech Regulations India, Fintech Growth India, Fintech Trends India.
Fintech Industry in India Market Dynamics & Concentration
The Indian Fintech market is a vibrant and rapidly expanding ecosystem, characterized by dynamic growth, intense competition, and a notable trend towards consolidation. While precise market size figures can fluctuate, projections indicate a significant upward trajectory, with estimates suggesting a market value reaching substantial figures by 2033, driven by a robust Compound Annual Growth Rate (CAGR). The market exhibits a degree of concentration, with established leaders holding substantial market share, particularly in mature segments. However, this is complemented by a flourishing landscape of innovative startups and emerging players continuously introducing novel solutions and disrupting traditional financial services.
- Market Dominance & Share: In the digital payments arena, platforms like Paytm and PhonePe have established significant leadership. The Insurtech sector sees players like Policy Bazaar at the forefront. While exact, up-to-the-minute market share data for every entity is elusive, the competitive landscape is clearly defined by these key players and a multitude of agile startups.
- Catalysts for Innovation: Key drivers fuelling this innovation include proactive government initiatives aimed at fostering digital inclusion and financial literacy, such as the widespread adoption of Aadhaar and the Unified Payments Interface (UPI). Complementing this is the ever-increasing penetration of smartphones across the nation. Emerging technologies like Artificial Intelligence (AI), big data analytics, and blockchain are also playing a transformative role in shaping new Fintech products and services.
- Evolving Regulatory Landscape: The Reserve Bank of India (RBI) remains a central figure in the Fintech regulatory framework, meticulously balancing the imperative for innovation with the critical need for risk management and consumer protection. Recent regulatory adjustments and evolving guidelines continue to shape market dynamics and influence business strategies.
- Competition from Traditional Institutions: While traditional financial institutions offer a range of competing services, Fintech companies distinguish themselves by providing unparalleled convenience, accessibility, and often, more cost-effective solutions that are frequently absent in the legacy banking system.
- Shifting End-User Behavior: India's young, digitally native, and increasingly tech-savvy population is rapidly adopting digital financial services. There is a pronounced and growing demand for personalized, seamless, and cost-efficient financial products, which is a primary engine for the sector's expansion.
- Mergers, Acquisitions, and Consolidation: The Fintech sector is witnessing an uptick in Mergers and Acquisitions (M&A) activities as larger players seek to expand their offerings and smaller startups gain access to capital and market reach. Notable examples, such as CreditVidya's acquisition by CRED in November 2022, highlight this trend. Industry observers anticipate a further acceleration of M&A deals, particularly among smaller fintech startups, with a significant number of such transactions projected in the coming years.
Fintech Industry in India Industry Trends & Analysis
The Indian Fintech market is experiencing exponential growth, fueled by several key factors. The increasing adoption of smartphones and internet penetration has significantly expanded the market reach. Government initiatives promoting digital payments and financial inclusion, such as the Unified Payments Interface (UPI), have created a conducive environment for Fintech growth. The rapid rise of digital lending platforms addresses the credit gap for underserved populations.
Technological disruptions, such as the widespread adoption of AI and machine learning, are transforming the industry, leading to more efficient and personalized financial services. Consumer preferences are shifting towards digital platforms, driven by convenience and accessibility. This shift impacts traditional financial institutions, forcing them to adapt or risk losing market share. Competitive dynamics are characterized by intense rivalry among established players and new entrants, leading to continuous innovation and pricing pressure.
Leading Markets & Segments in Fintech Industry in India
The Indian Fintech market presents a geographically diverse growth story, with significant expansion occurring across various regions. However, urban centers, characterized by high internet penetration and widespread smartphone ownership, continue to lead in adoption rates. At present, the digital payments segment holds a dominant position, closely followed by the rapidly growing areas of digital lending and insurtech, reflecting the immediate needs and evolving preferences of the Indian consumer.
- Key Drivers for Segment Dominance:
- Ubiquitous Smartphone Penetration: India boasts one of the highest rates of smartphone adoption globally, providing a foundational platform for digital financial services.
- Expanding Internet Accessibility: The continuous growth in internet access opens up vast opportunities to engage a burgeoning base of potential Fintech users.
- Proactive Government Support: Government-backed policies and initiatives designed to enhance financial inclusion and promote digital adoption are instrumental in the sector's growth.
- Favorable Demographic Profile: A predominantly young and technologically adept population is inherently more receptive to adopting and leveraging Fintech solutions.
- Addressing the Underbanked: Fintech solutions are effectively reaching and serving a significant segment of the population that was previously unbanked or underbanked.
The current dominance of specific segments is a direct consequence of addressing prevailing market needs and capitalizing on emerging opportunities within India. This trend is expected to continue, propelled by ongoing technological advancements and the dynamic evolution of consumer expectations.
Fintech Industry in India Product Developments
The Indian Fintech sector is witnessing rapid product innovation, driven by technological advancements and evolving customer demands. New products focus on addressing specific needs, such as improving access to credit, providing affordable insurance, and enhancing payment options. This innovation creates competitive advantages for Fintech companies and drives market growth. The integration of AI and machine learning enhances customer experience and risk assessment. Furthermore, advancements in blockchain technology are exploring applications in areas like secure transactions and supply chain finance.
Key Drivers of Fintech Industry in India Growth
The robust growth trajectory of India's Fintech sector is propelled by a confluence of powerful drivers. Foundational to this expansion are technological advancements, particularly in areas like mobile payment solutions and AI-driven lending platforms. Complementing these innovations, government initiatives actively promoting digital inclusion and financial literacy are significantly boosting adoption rates. Furthermore, the rapid expansion of the Indian middle class, coupled with increasing disposable incomes, fuels a growing demand for sophisticated and accessible financial services. A supportive regulatory environment, which fosters innovation while upholding stringent consumer protection measures, is also a critical element contributing to the sector's sustained growth.
Challenges in the Fintech Industry in India Market
Despite significant growth potential, several challenges hinder the Fintech industry in India. Regulatory hurdles, including compliance requirements and licensing processes, can be complex and time-consuming. Data security and privacy concerns, especially with sensitive financial information, are critical. Cybersecurity threats and the risk of fraud pose significant challenges, requiring robust security measures. Competition is intense, requiring continuous innovation and adaptation to maintain market share. Infrastructure limitations in certain regions can also impede expansion and adoption. The estimated impact of these challenges on overall market growth is xx Million per year.
Emerging Opportunities in Fintech Industry in India
Significant long-term growth opportunities exist within the Indian Fintech sector. Further technological innovations, such as advancements in AI and blockchain, can lead to more efficient and secure financial services. Strategic partnerships between Fintech companies and traditional financial institutions can broaden market reach and enhance product offerings. Expansion into underserved markets and segments can unlock substantial growth potential. The increasing adoption of open banking principles can facilitate greater interoperability and innovation.
Key Milestones in Fintech Industry in India Industry
- September 2023: PayU partners with WhatsApp to enhance the Indian purchasing experience, significantly impacting digital payments.
- November 2022: CreditVidya, a Hyderabad-based SaaS company, is acquired by CRED, highlighting consolidation within the Fintech space.
Strategic Outlook for Fintech Industry in India Market
The outlook for the Indian Fintech market remains exceptionally promising, with substantial room for continued expansion. Strategic alliances and collaborative partnerships are poised to become increasingly crucial for navigating this complex landscape and unlocking new growth avenues. Ongoing technological advancements and the continued evolution of regulatory clarity will undoubtedly shape the sector's future trajectory. A persistent focus on enhancing financial inclusion and extending services to underserved populations will remain a cornerstone of growth. Companies that adeptly manage regulatory complexities, maintain robust cybersecurity protocols, and consistently deliver innovative, customer-centric solutions are well-positioned to thrive and lead in this dynamic and rapidly evolving market.
Fintech Industry in India Segmentation
-
1. Service Proposition
- 1.1. Money Transfer and Payments
- 1.2. Savings and Investments
- 1.3. Digital Lending and Lending Marketplaces
- 1.4. Online Insurance and Insurance Marketplaces
-
2. Application
- 2.1. E-Commerce
- 2.2. Utilities
- 2.3. Travel
Fintech Industry in India Segmentation By Geography
-
1. North America
- 1.1. United States
- 1.2. Canada
- 1.3. Mexico
-
2. South America
- 2.1. Brazil
- 2.2. Argentina
- 2.3. Rest of South America
-
3. Europe
- 3.1. United Kingdom
- 3.2. Germany
- 3.3. France
- 3.4. Italy
- 3.5. Spain
- 3.6. Russia
- 3.7. Benelux
- 3.8. Nordics
- 3.9. Rest of Europe
-
4. Middle East & Africa
- 4.1. Turkey
- 4.2. Israel
- 4.3. GCC
- 4.4. North Africa
- 4.5. South Africa
- 4.6. Rest of Middle East & Africa
-
5. Asia Pacific
- 5.1. China
- 5.2. India
- 5.3. Japan
- 5.4. South Korea
- 5.5. ASEAN
- 5.6. Oceania
- 5.7. Rest of Asia Pacific
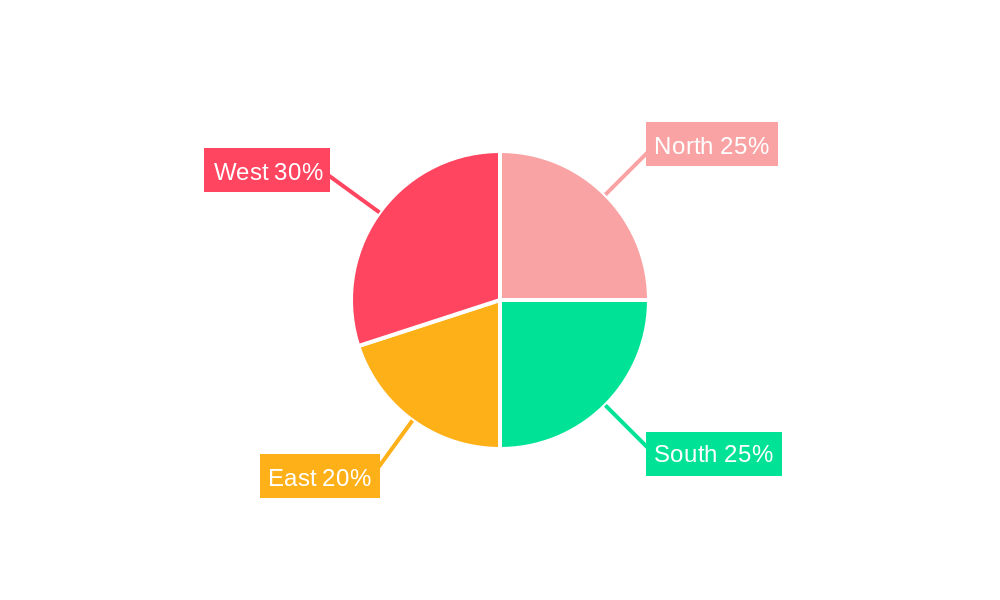
Fintech Industry in India Regional Market Share
Geographic Coverage of Fintech Industry in India
Fintech Industry in India REPORT HIGHLIGHTS
| Aspects | Details |
|---|---|
| Study Period | 2020-2034 |
| Base Year | 2025 |
| Estimated Year | 2026 |
| Forecast Period | 2026-2034 |
| Historical Period | 2020-2025 |
| Growth Rate | CAGR of 30.55% from 2020-2034 |
| Segmentation |
|
Table of Contents
- 1. Introduction
- 1.1. Research Scope
- 1.2. Market Segmentation
- 1.3. Research Objective
- 1.4. Definitions and Assumptions
- 2. Executive Summary
- 2.1. Market Snapshot
- 3. Market Dynamics
- 3.1. Market Drivers
- 3.2. Market Restrains
- 3.3. Market Trends
- 3.4. Market Opportunities
- 4. Market Factor Analysis
- 4.1. Porters Five Forces
- 4.1.1. Bargaining Power of Suppliers
- 4.1.2. Bargaining Power of Buyers
- 4.1.3. Threat of New Entrants
- 4.1.4. Threat of Substitutes
- 4.1.5. Competitive Rivalry
- 4.2. PESTEL analysis
- 4.3. BCG Analysis
- 4.3.1. Stars (High Growth, High Market Share)
- 4.3.2. Cash Cows (Low Growth, High Market Share)
- 4.3.3. Question Mark (High Growth, Low Market Share)
- 4.3.4. Dogs (Low Growth, Low Market Share)
- 4.4. Ansoff Matrix Analysis
- 4.5. Supply Chain Analysis
- 4.6. Regulatory Landscape
- 4.7. Current Market Potential and Opportunity Assessment (TAM–SAM–SOM Framework)
- 4.8. MDP Analyst Note
- 4.1. Porters Five Forces
- 5. Market Analysis, Insights and Forecast 2021-2033
- 5.1. Market Analysis, Insights and Forecast - by Service Proposition
- 5.1.1. Money Transfer and Payments
- 5.1.2. Savings and Investments
- 5.1.3. Digital Lending and Lending Marketplaces
- 5.1.4. Online Insurance and Insurance Marketplaces
- 5.2. Market Analysis, Insights and Forecast - by Application
- 5.2.1. E-Commerce
- 5.2.2. Utilities
- 5.2.3. Travel
- 5.3. Market Analysis, Insights and Forecast - by Region
- 5.3.1. North America
- 5.3.2. South America
- 5.3.3. Europe
- 5.3.4. Middle East & Africa
- 5.3.5. Asia Pacific
- 5.1. Market Analysis, Insights and Forecast - by Service Proposition
- 6. Global Fintech Industry in India Analysis, Insights and Forecast, 2021-2033
- 6.1. Market Analysis, Insights and Forecast - by Service Proposition
- 6.1.1. Money Transfer and Payments
- 6.1.2. Savings and Investments
- 6.1.3. Digital Lending and Lending Marketplaces
- 6.1.4. Online Insurance and Insurance Marketplaces
- 6.2. Market Analysis, Insights and Forecast - by Application
- 6.2.1. E-Commerce
- 6.2.2. Utilities
- 6.2.3. Travel
- 6.1. Market Analysis, Insights and Forecast - by Service Proposition
- 7. North America Fintech Industry in India Analysis, Insights and Forecast, 2020-2032
- 7.1. Market Analysis, Insights and Forecast - by Service Proposition
- 7.1.1. Money Transfer and Payments
- 7.1.2. Savings and Investments
- 7.1.3. Digital Lending and Lending Marketplaces
- 7.1.4. Online Insurance and Insurance Marketplaces
- 7.2. Market Analysis, Insights and Forecast - by Application
- 7.2.1. E-Commerce
- 7.2.2. Utilities
- 7.2.3. Travel
- 7.1. Market Analysis, Insights and Forecast - by Service Proposition
- 8. South America Fintech Industry in India Analysis, Insights and Forecast, 2020-2032
- 8.1. Market Analysis, Insights and Forecast - by Service Proposition
- 8.1.1. Money Transfer and Payments
- 8.1.2. Savings and Investments
- 8.1.3. Digital Lending and Lending Marketplaces
- 8.1.4. Online Insurance and Insurance Marketplaces
- 8.2. Market Analysis, Insights and Forecast - by Application
- 8.2.1. E-Commerce
- 8.2.2. Utilities
- 8.2.3. Travel
- 8.1. Market Analysis, Insights and Forecast - by Service Proposition
- 9. Europe Fintech Industry in India Analysis, Insights and Forecast, 2020-2032
- 9.1. Market Analysis, Insights and Forecast - by Service Proposition
- 9.1.1. Money Transfer and Payments
- 9.1.2. Savings and Investments
- 9.1.3. Digital Lending and Lending Marketplaces
- 9.1.4. Online Insurance and Insurance Marketplaces
- 9.2. Market Analysis, Insights and Forecast - by Application
- 9.2.1. E-Commerce
- 9.2.2. Utilities
- 9.2.3. Travel
- 9.1. Market Analysis, Insights and Forecast - by Service Proposition
- 10. Middle East & Africa Fintech Industry in India Analysis, Insights and Forecast, 2020-2032
- 10.1. Market Analysis, Insights and Forecast - by Service Proposition
- 10.1.1. Money Transfer and Payments
- 10.1.2. Savings and Investments
- 10.1.3. Digital Lending and Lending Marketplaces
- 10.1.4. Online Insurance and Insurance Marketplaces
- 10.2. Market Analysis, Insights and Forecast - by Application
- 10.2.1. E-Commerce
- 10.2.2. Utilities
- 10.2.3. Travel
- 10.1. Market Analysis, Insights and Forecast - by Service Proposition
- 11. Asia Pacific Fintech Industry in India Analysis, Insights and Forecast, 2020-2032
- 11.1. Market Analysis, Insights and Forecast - by Service Proposition
- 11.1.1. Money Transfer and Payments
- 11.1.2. Savings and Investments
- 11.1.3. Digital Lending and Lending Marketplaces
- 11.1.4. Online Insurance and Insurance Marketplaces
- 11.2. Market Analysis, Insights and Forecast - by Application
- 11.2.1. E-Commerce
- 11.2.2. Utilities
- 11.2.3. Travel
- 11.1. Market Analysis, Insights and Forecast - by Service Proposition
- 12. Competitive Analysis
- 12.1. Company Profiles
- 12.1.1 Paytm
- 12.1.1.1. Company Overview
- 12.1.1.2. Products
- 12.1.1.3. Company Financials
- 12.1.1.4. SWOT Analysis
- 12.1.2 MobiKwik
- 12.1.2.1. Company Overview
- 12.1.2.2. Products
- 12.1.2.3. Company Financials
- 12.1.2.4. SWOT Analysis
- 12.1.3 Policy Bazaar
- 12.1.3.1. Company Overview
- 12.1.3.2. Products
- 12.1.3.3. Company Financials
- 12.1.3.4. SWOT Analysis
- 12.1.4 PayU
- 12.1.4.1. Company Overview
- 12.1.4.2. Products
- 12.1.4.3. Company Financials
- 12.1.4.4. SWOT Analysis
- 12.1.5 Kissht
- 12.1.5.1. Company Overview
- 12.1.5.2. Products
- 12.1.5.3. Company Financials
- 12.1.5.4. SWOT Analysis
- 12.1.6 Shubh Loans
- 12.1.6.1. Company Overview
- 12.1.6.2. Products
- 12.1.6.3. Company Financials
- 12.1.6.4. SWOT Analysis
- 12.1.7 Lending Kart
- 12.1.7.1. Company Overview
- 12.1.7.2. Products
- 12.1.7.3. Company Financials
- 12.1.7.4. SWOT Analysis
- 12.1.8 Phonepe
- 12.1.8.1. Company Overview
- 12.1.8.2. Products
- 12.1.8.3. Company Financials
- 12.1.8.4. SWOT Analysis
- 12.1.9 Faircent
- 12.1.9.1. Company Overview
- 12.1.9.2. Products
- 12.1.9.3. Company Financials
- 12.1.9.4. SWOT Analysis
- 12.1.10 ET money**List Not Exhaustive
- 12.1.10.1. Company Overview
- 12.1.10.2. Products
- 12.1.10.3. Company Financials
- 12.1.10.4. SWOT Analysis
- 12.1.1 Paytm
- 12.2. Market Entropy
- 12.2.1 Company's Key Areas Served
- 12.2.2 Recent Developments
- 12.3. Company Market Share Analysis 2025
- 12.3.1 Top 5 Companies Market Share Analysis
- 12.3.2 Top 3 Companies Market Share Analysis
- 12.4. List of Potential Customers
- 13. Research Methodology
List of Figures
- Figure 1: Global Fintech Industry in India Revenue Breakdown (Million, %) by Region 2025 & 2033
- Figure 2: Global Fintech Industry in India Volume Breakdown (Billion, %) by Region 2025 & 2033
- Figure 3: North America Fintech Industry in India Revenue (Million), by Service Proposition 2025 & 2033
- Figure 4: North America Fintech Industry in India Volume (Billion), by Service Proposition 2025 & 2033
- Figure 5: North America Fintech Industry in India Revenue Share (%), by Service Proposition 2025 & 2033
- Figure 6: North America Fintech Industry in India Volume Share (%), by Service Proposition 2025 & 2033
- Figure 7: North America Fintech Industry in India Revenue (Million), by Application 2025 & 2033
- Figure 8: North America Fintech Industry in India Volume (Billion), by Application 2025 & 2033
- Figure 9: North America Fintech Industry in India Revenue Share (%), by Application 2025 & 2033
- Figure 10: North America Fintech Industry in India Volume Share (%), by Application 2025 & 2033
- Figure 11: North America Fintech Industry in India Revenue (Million), by Country 2025 & 2033
- Figure 12: North America Fintech Industry in India Volume (Billion), by Country 2025 & 2033
- Figure 13: North America Fintech Industry in India Revenue Share (%), by Country 2025 & 2033
- Figure 14: North America Fintech Industry in India Volume Share (%), by Country 2025 & 2033
- Figure 15: South America Fintech Industry in India Revenue (Million), by Service Proposition 2025 & 2033
- Figure 16: South America Fintech Industry in India Volume (Billion), by Service Proposition 2025 & 2033
- Figure 17: South America Fintech Industry in India Revenue Share (%), by Service Proposition 2025 & 2033
- Figure 18: South America Fintech Industry in India Volume Share (%), by Service Proposition 2025 & 2033
- Figure 19: South America Fintech Industry in India Revenue (Million), by Application 2025 & 2033
- Figure 20: South America Fintech Industry in India Volume (Billion), by Application 2025 & 2033
- Figure 21: South America Fintech Industry in India Revenue Share (%), by Application 2025 & 2033
- Figure 22: South America Fintech Industry in India Volume Share (%), by Application 2025 & 2033
- Figure 23: South America Fintech Industry in India Revenue (Million), by Country 2025 & 2033
- Figure 24: South America Fintech Industry in India Volume (Billion), by Country 2025 & 2033
- Figure 25: South America Fintech Industry in India Revenue Share (%), by Country 2025 & 2033
- Figure 26: South America Fintech Industry in India Volume Share (%), by Country 2025 & 2033
- Figure 27: Europe Fintech Industry in India Revenue (Million), by Service Proposition 2025 & 2033
- Figure 28: Europe Fintech Industry in India Volume (Billion), by Service Proposition 2025 & 2033
- Figure 29: Europe Fintech Industry in India Revenue Share (%), by Service Proposition 2025 & 2033
- Figure 30: Europe Fintech Industry in India Volume Share (%), by Service Proposition 2025 & 2033
- Figure 31: Europe Fintech Industry in India Revenue (Million), by Application 2025 & 2033
- Figure 32: Europe Fintech Industry in India Volume (Billion), by Application 2025 & 2033
- Figure 33: Europe Fintech Industry in India Revenue Share (%), by Application 2025 & 2033
- Figure 34: Europe Fintech Industry in India Volume Share (%), by Application 2025 & 2033
- Figure 35: Europe Fintech Industry in India Revenue (Million), by Country 2025 & 2033
- Figure 36: Europe Fintech Industry in India Volume (Billion), by Country 2025 & 2033
- Figure 37: Europe Fintech Industry in India Revenue Share (%), by Country 2025 & 2033
- Figure 38: Europe Fintech Industry in India Volume Share (%), by Country 2025 & 2033
- Figure 39: Middle East & Africa Fintech Industry in India Revenue (Million), by Service Proposition 2025 & 2033
- Figure 40: Middle East & Africa Fintech Industry in India Volume (Billion), by Service Proposition 2025 & 2033
- Figure 41: Middle East & Africa Fintech Industry in India Revenue Share (%), by Service Proposition 2025 & 2033
- Figure 42: Middle East & Africa Fintech Industry in India Volume Share (%), by Service Proposition 2025 & 2033
- Figure 43: Middle East & Africa Fintech Industry in India Revenue (Million), by Application 2025 & 2033
- Figure 44: Middle East & Africa Fintech Industry in India Volume (Billion), by Application 2025 & 2033
- Figure 45: Middle East & Africa Fintech Industry in India Revenue Share (%), by Application 2025 & 2033
- Figure 46: Middle East & Africa Fintech Industry in India Volume Share (%), by Application 2025 & 2033
- Figure 47: Middle East & Africa Fintech Industry in India Revenue (Million), by Country 2025 & 2033
- Figure 48: Middle East & Africa Fintech Industry in India Volume (Billion), by Country 2025 & 2033
- Figure 49: Middle East & Africa Fintech Industry in India Revenue Share (%), by Country 2025 & 2033
- Figure 50: Middle East & Africa Fintech Industry in India Volume Share (%), by Country 2025 & 2033
- Figure 51: Asia Pacific Fintech Industry in India Revenue (Million), by Service Proposition 2025 & 2033
- Figure 52: Asia Pacific Fintech Industry in India Volume (Billion), by Service Proposition 2025 & 2033
- Figure 53: Asia Pacific Fintech Industry in India Revenue Share (%), by Service Proposition 2025 & 2033
- Figure 54: Asia Pacific Fintech Industry in India Volume Share (%), by Service Proposition 2025 & 2033
- Figure 55: Asia Pacific Fintech Industry in India Revenue (Million), by Application 2025 & 2033
- Figure 56: Asia Pacific Fintech Industry in India Volume (Billion), by Application 2025 & 2033
- Figure 57: Asia Pacific Fintech Industry in India Revenue Share (%), by Application 2025 & 2033
- Figure 58: Asia Pacific Fintech Industry in India Volume Share (%), by Application 2025 & 2033
- Figure 59: Asia Pacific Fintech Industry in India Revenue (Million), by Country 2025 & 2033
- Figure 60: Asia Pacific Fintech Industry in India Volume (Billion), by Country 2025 & 2033
- Figure 61: Asia Pacific Fintech Industry in India Revenue Share (%), by Country 2025 & 2033
- Figure 62: Asia Pacific Fintech Industry in India Volume Share (%), by Country 2025 & 2033
List of Tables
- Table 1: Global Fintech Industry in India Revenue Million Forecast, by Service Proposition 2020 & 2033
- Table 2: Global Fintech Industry in India Volume Billion Forecast, by Service Proposition 2020 & 2033
- Table 3: Global Fintech Industry in India Revenue Million Forecast, by Application 2020 & 2033
- Table 4: Global Fintech Industry in India Volume Billion Forecast, by Application 2020 & 2033
- Table 5: Global Fintech Industry in India Revenue Million Forecast, by Region 2020 & 2033
- Table 6: Global Fintech Industry in India Volume Billion Forecast, by Region 2020 & 2033
- Table 7: Global Fintech Industry in India Revenue Million Forecast, by Service Proposition 2020 & 2033
- Table 8: Global Fintech Industry in India Volume Billion Forecast, by Service Proposition 2020 & 2033
- Table 9: Global Fintech Industry in India Revenue Million Forecast, by Application 2020 & 2033
- Table 10: Global Fintech Industry in India Volume Billion Forecast, by Application 2020 & 2033
- Table 11: Global Fintech Industry in India Revenue Million Forecast, by Country 2020 & 2033
- Table 12: Global Fintech Industry in India Volume Billion Forecast, by Country 2020 & 2033
- Table 13: United States Fintech Industry in India Revenue (Million) Forecast, by Application 2020 & 2033
- Table 14: United States Fintech Industry in India Volume (Billion) Forecast, by Application 2020 & 2033
- Table 15: Canada Fintech Industry in India Revenue (Million) Forecast, by Application 2020 & 2033
- Table 16: Canada Fintech Industry in India Volume (Billion) Forecast, by Application 2020 & 2033
- Table 17: Mexico Fintech Industry in India Revenue (Million) Forecast, by Application 2020 & 2033
- Table 18: Mexico Fintech Industry in India Volume (Billion) Forecast, by Application 2020 & 2033
- Table 19: Global Fintech Industry in India Revenue Million Forecast, by Service Proposition 2020 & 2033
- Table 20: Global Fintech Industry in India Volume Billion Forecast, by Service Proposition 2020 & 2033
- Table 21: Global Fintech Industry in India Revenue Million Forecast, by Application 2020 & 2033
- Table 22: Global Fintech Industry in India Volume Billion Forecast, by Application 2020 & 2033
- Table 23: Global Fintech Industry in India Revenue Million Forecast, by Country 2020 & 2033
- Table 24: Global Fintech Industry in India Volume Billion Forecast, by Country 2020 & 2033
- Table 25: Brazil Fintech Industry in India Revenue (Million) Forecast, by Application 2020 & 2033
- Table 26: Brazil Fintech Industry in India Volume (Billion) Forecast, by Application 2020 & 2033
- Table 27: Argentina Fintech Industry in India Revenue (Million) Forecast, by Application 2020 & 2033
- Table 28: Argentina Fintech Industry in India Volume (Billion) Forecast, by Application 2020 & 2033
- Table 29: Rest of South America Fintech Industry in India Revenue (Million) Forecast, by Application 2020 & 2033
- Table 30: Rest of South America Fintech Industry in India Volume (Billion) Forecast, by Application 2020 & 2033
- Table 31: Global Fintech Industry in India Revenue Million Forecast, by Service Proposition 2020 & 2033
- Table 32: Global Fintech Industry in India Volume Billion Forecast, by Service Proposition 2020 & 2033
- Table 33: Global Fintech Industry in India Revenue Million Forecast, by Application 2020 & 2033
- Table 34: Global Fintech Industry in India Volume Billion Forecast, by Application 2020 & 2033
- Table 35: Global Fintech Industry in India Revenue Million Forecast, by Country 2020 & 2033
- Table 36: Global Fintech Industry in India Volume Billion Forecast, by Country 2020 & 2033
- Table 37: United Kingdom Fintech Industry in India Revenue (Million) Forecast, by Application 2020 & 2033
- Table 38: United Kingdom Fintech Industry in India Volume (Billion) Forecast, by Application 2020 & 2033
- Table 39: Germany Fintech Industry in India Revenue (Million) Forecast, by Application 2020 & 2033
- Table 40: Germany Fintech Industry in India Volume (Billion) Forecast, by Application 2020 & 2033
- Table 41: France Fintech Industry in India Revenue (Million) Forecast, by Application 2020 & 2033
- Table 42: France Fintech Industry in India Volume (Billion) Forecast, by Application 2020 & 2033
- Table 43: Italy Fintech Industry in India Revenue (Million) Forecast, by Application 2020 & 2033
- Table 44: Italy Fintech Industry in India Volume (Billion) Forecast, by Application 2020 & 2033
- Table 45: Spain Fintech Industry in India Revenue (Million) Forecast, by Application 2020 & 2033
- Table 46: Spain Fintech Industry in India Volume (Billion) Forecast, by Application 2020 & 2033
- Table 47: Russia Fintech Industry in India Revenue (Million) Forecast, by Application 2020 & 2033
- Table 48: Russia Fintech Industry in India Volume (Billion) Forecast, by Application 2020 & 2033
- Table 49: Benelux Fintech Industry in India Revenue (Million) Forecast, by Application 2020 & 2033
- Table 50: Benelux Fintech Industry in India Volume (Billion) Forecast, by Application 2020 & 2033
- Table 51: Nordics Fintech Industry in India Revenue (Million) Forecast, by Application 2020 & 2033
- Table 52: Nordics Fintech Industry in India Volume (Billion) Forecast, by Application 2020 & 2033
- Table 53: Rest of Europe Fintech Industry in India Revenue (Million) Forecast, by Application 2020 & 2033
- Table 54: Rest of Europe Fintech Industry in India Volume (Billion) Forecast, by Application 2020 & 2033
- Table 55: Global Fintech Industry in India Revenue Million Forecast, by Service Proposition 2020 & 2033
- Table 56: Global Fintech Industry in India Volume Billion Forecast, by Service Proposition 2020 & 2033
- Table 57: Global Fintech Industry in India Revenue Million Forecast, by Application 2020 & 2033
- Table 58: Global Fintech Industry in India Volume Billion Forecast, by Application 2020 & 2033
- Table 59: Global Fintech Industry in India Revenue Million Forecast, by Country 2020 & 2033
- Table 60: Global Fintech Industry in India Volume Billion Forecast, by Country 2020 & 2033
- Table 61: Turkey Fintech Industry in India Revenue (Million) Forecast, by Application 2020 & 2033
- Table 62: Turkey Fintech Industry in India Volume (Billion) Forecast, by Application 2020 & 2033
- Table 63: Israel Fintech Industry in India Revenue (Million) Forecast, by Application 2020 & 2033
- Table 64: Israel Fintech Industry in India Volume (Billion) Forecast, by Application 2020 & 2033
- Table 65: GCC Fintech Industry in India Revenue (Million) Forecast, by Application 2020 & 2033
- Table 66: GCC Fintech Industry in India Volume (Billion) Forecast, by Application 2020 & 2033
- Table 67: North Africa Fintech Industry in India Revenue (Million) Forecast, by Application 2020 & 2033
- Table 68: North Africa Fintech Industry in India Volume (Billion) Forecast, by Application 2020 & 2033
- Table 69: South Africa Fintech Industry in India Revenue (Million) Forecast, by Application 2020 & 2033
- Table 70: South Africa Fintech Industry in India Volume (Billion) Forecast, by Application 2020 & 2033
- Table 71: Rest of Middle East & Africa Fintech Industry in India Revenue (Million) Forecast, by Application 2020 & 2033
- Table 72: Rest of Middle East & Africa Fintech Industry in India Volume (Billion) Forecast, by Application 2020 & 2033
- Table 73: Global Fintech Industry in India Revenue Million Forecast, by Service Proposition 2020 & 2033
- Table 74: Global Fintech Industry in India Volume Billion Forecast, by Service Proposition 2020 & 2033
- Table 75: Global Fintech Industry in India Revenue Million Forecast, by Application 2020 & 2033
- Table 76: Global Fintech Industry in India Volume Billion Forecast, by Application 2020 & 2033
- Table 77: Global Fintech Industry in India Revenue Million Forecast, by Country 2020 & 2033
- Table 78: Global Fintech Industry in India Volume Billion Forecast, by Country 2020 & 2033
- Table 79: China Fintech Industry in India Revenue (Million) Forecast, by Application 2020 & 2033
- Table 80: China Fintech Industry in India Volume (Billion) Forecast, by Application 2020 & 2033
- Table 81: India Fintech Industry in India Revenue (Million) Forecast, by Application 2020 & 2033
- Table 82: India Fintech Industry in India Volume (Billion) Forecast, by Application 2020 & 2033
- Table 83: Japan Fintech Industry in India Revenue (Million) Forecast, by Application 2020 & 2033
- Table 84: Japan Fintech Industry in India Volume (Billion) Forecast, by Application 2020 & 2033
- Table 85: South Korea Fintech Industry in India Revenue (Million) Forecast, by Application 2020 & 2033
- Table 86: South Korea Fintech Industry in India Volume (Billion) Forecast, by Application 2020 & 2033
- Table 87: ASEAN Fintech Industry in India Revenue (Million) Forecast, by Application 2020 & 2033
- Table 88: ASEAN Fintech Industry in India Volume (Billion) Forecast, by Application 2020 & 2033
- Table 89: Oceania Fintech Industry in India Revenue (Million) Forecast, by Application 2020 & 2033
- Table 90: Oceania Fintech Industry in India Volume (Billion) Forecast, by Application 2020 & 2033
- Table 91: Rest of Asia Pacific Fintech Industry in India Revenue (Million) Forecast, by Application 2020 & 2033
- Table 92: Rest of Asia Pacific Fintech Industry in India Volume (Billion) Forecast, by Application 2020 & 2033
Frequently Asked Questions
1. What is the projected Compound Annual Growth Rate (CAGR) of the Fintech Industry in India?
The projected CAGR is approximately 30.55%.
2. Which companies are prominent players in the Fintech Industry in India?
Key companies in the market include Paytm, MobiKwik, Policy Bazaar, PayU, Kissht, Shubh Loans, Lending Kart, Phonepe, Faircent, ET money**List Not Exhaustive.
3. What are the main segments of the Fintech Industry in India?
The market segments include Service Proposition, Application.
4. Can you provide details about the market size?
The market size is estimated to be USD 111.14 Million as of 2022.
5. What are some drivers contributing to market growth?
Increasing Demand for Digital Services; Rapid Advancement in Technology is Driving the Market.
6. What are the notable trends driving market growth?
Increase in Mobile Banking Payments is Surging the Growth of the Market.
7. Are there any restraints impacting market growth?
Increasing Demand for Digital Services; Rapid Advancement in Technology is Driving the Market.
8. Can you provide examples of recent developments in the market?
September 2023: PayU, an Indian payments company, partnered with WhatsApp to considerably improve Indians' purchasing experience.
9. What pricing options are available for accessing the report?
Pricing options include single-user, multi-user, and enterprise licenses priced at USD 3800, USD 4500, and USD 5800 respectively.
10. Is the market size provided in terms of value or volume?
The market size is provided in terms of value, measured in Million and volume, measured in Billion.
11. Are there any specific market keywords associated with the report?
Yes, the market keyword associated with the report is "Fintech Industry in India," which aids in identifying and referencing the specific market segment covered.
12. How do I determine which pricing option suits my needs best?
The pricing options vary based on user requirements and access needs. Individual users may opt for single-user licenses, while businesses requiring broader access may choose multi-user or enterprise licenses for cost-effective access to the report.
13. Are there any additional resources or data provided in the Fintech Industry in India report?
While the report offers comprehensive insights, it's advisable to review the specific contents or supplementary materials provided to ascertain if additional resources or data are available.
14. How can I stay updated on further developments or reports in the Fintech Industry in India?
To stay informed about further developments, trends, and reports in the Fintech Industry in India, consider subscribing to industry newsletters, following relevant companies and organizations, or regularly checking reputable industry news sources and publications.
Methodology
Step 1 - Identification of Relevant Samples Size from Population Database


Step 2 - Approaches for Defining Global Market Size (Value, Volume* & Price*)

Note*: In applicable scenarios
Step 3 - Data Sources
Primary Research
- Web Analytics
- Survey Reports
- Research Institute
- Latest Research Reports
- Opinion Leaders
Secondary Research
- Annual Reports
- White Paper
- Latest Press Release
- Industry Association
- Paid Database
- Investor Presentations

Step 4 - Data Triangulation
Involves using different sources of information in order to increase the validity of a study
These sources are likely to be stakeholders in a program - participants, other researchers, program staff, other community members, and so on.
Then we put all data in single framework & apply various statistical tools to find out the dynamic on the market.
During the analysis stage, feedback from the stakeholder groups would be compared to determine areas of agreement as well as areas of divergence